AT&T Second-Quarter Results Demonstrate Consistent, Strong 5G and Fiber Customer Growth
Connectivity investments continue to attract and retain high-value subscribers who choose both wireless and fiber service
DALLAS, July 24, 2024 /PRNewswire/ -- AT&T Inc. (NYSE:T) reported second-quarter results that delivered durable and profitable 5G and fiber customer growth with increasing Mobility service and broadband revenues. Following consistent first-half performance, the Company reiterates all full-year 2024 financial guidance.
Second-Quarter Consolidated Results
- Revenues of $29.8 billion
- Diluted EPS of $0.49; adjusted EPS* of $0.57
- Operating income of $5.8 billion; adjusted operating income* of $6.3 billion
- Net income of $3.9 billion; adjusted EBITDA* of $11.3 billion
- Cash from operating activities of $9.1 billion, down $0.8 billion year over year
- Capital expenditures of $4.4 billion; capital investment* of $4.9 billion
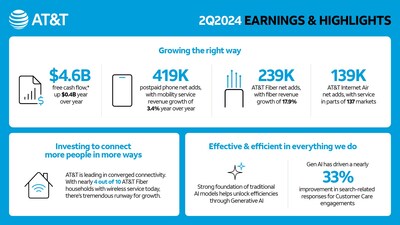
- Free cash flow* of $4.6 billion, up $0.4 billion year over year
Second-Quarter Highlights
- 419,000 postpaid phone net adds with an expected industry-leading postpaid phone churn of 0.70%
- Mobility service revenues of $16.3 billion, up 3.4% year over year
- 239,000 AT&T Fiber net adds; 200,000+ net adds for 18 consecutive quarters
- Consumer broadband revenues of $2.7 billion, up 7.0% year over year
- 27.8 million consumer and business locations passed with fiber
"For the past four years, we've delivered consistent, positive results that have repositioned AT&T. Our solid performance this quarter demonstrates the durable benefits of our investment-led strategy," said John Stankey, AT&T CEO. "AT&T is leading the way in converged connectivity as customers increasingly seek one provider who can seamlessly connect them in their home, at work and on the go. This is proving to be a winning strategy. Today, nearly four of every 10 AT&T Fiber households also choose AT&T wireless service. As the nation's largest consumer fiber builder, we see this as an opportunity to continue to grow subscribers and revenues, while deepening customer relationships."
2024 Outlook
For the full year, AT&T reiterates guidance of:
- Wireless service revenue growth in the 3% range.
- Broadband revenue growth of 7%+.
- Adjusted EBITDA* growth in the 3% range.
- Capital investment* in the $21-$22 billion range.
- Free cash flow* in the $17-$18 billion range.
- Adjusted EPS* in the $2.15-$2.25 range.
- In 2025, the company expects to deliver Adjusted EPS* growth.
- The company continues to expect to achieve net debt-to-adjusted EBITDA* in the 2.5x range in the first half of 2025.
- On track to pass 30 million-plus consumer and business locations with fiber by the end of 2025.
Note: AT&T's second-quarter earnings conference call will be webcast at 8:30 a.m. ET on Wednesday, July 24, 2024. The webcast and related materials, including financial highlights, will be available at https://investors.att.com.
Consolidated Financial Results
- Revenues for the second quarter totaled $29.8 billion versus $29.9 billion in the year-ago quarter, down 0.4%. This was due to lower Business Wireline service revenues and declines in Mobility equipment revenues driven by lower sales volumes. These decreases were mostly offset by higher Mobility service, Consumer Wireline and Mexico revenues.
- Operating expenses were $24.0 billion versus $23.5 billion in the year-ago quarter. Operating expenses increased primarily due to our Open RAN network modernization efforts, including restructuring costs and accelerated depreciation on wireless network equipment, and higher depreciation related to our continued fiber and 5G investment. This was largely offset by lower Mobility equipment costs from lower sales volumes and benefits from continued transformation.
- Operating income was $5.8 billion versus $6.4 billion in the year-ago quarter. When adjusting for certain items, adjusted operating income* was $6.3 billion, versus $6.4 billion in the year-ago quarter.
- Equity in net income of affiliates was $0.3 billion, primarily from the DIRECTV investment. With adjustment for our proportionate share of intangible amortization, adjusted equity in net income from the DIRECTV investment* was $0.6 billion.
- Net income was $3.9 billion versus $4.8 billion in the year-ago quarter.
- Net income attributable to common stock was $3.5 billion versus $4.4 billion in the year-ago quarter. Earnings per diluted common share was $0.49 versus $0.61 in the year-ago quarter. Adjusting for $0.08, which includes restructuring costs, our proportionate share of intangible amortization from the DIRECTV equity method investment, and other items, adjusted earnings per diluted common share* was $0.57 compared to $0.63 in the year-ago quarter.
- Adjusted EBITDA* was $11.3 billion versus $11.1 billion in the year-ago quarter.
- Cash from operating activities was $9.1 billion, down $0.8 billion year over year, due to timing of working capital, including lower receivable sales partly offset by lower device payments.
- Capital expenditures were $4.4 billion in the quarter versus $4.3 billion in the year-ago quarter.
Capital investment* totaled $4.9 billion versus $5.9 billion in the year-ago quarter. In the quarter, cash payments for vendor financing totaled $0.6 billion versus $1.6 billion in the year-ago quarter. - Free cash flow* was $4.6 billion for the quarter versus $4.2 billion in the year-ago quarter.
- Total debt was $130.6 billion at the end of the second quarter, and net debt* was $126.9 billion. In the quarter, the company repaid $2.2 billion of long-term debt.
Segment and Business Unit Results
Communications Segment | |||
Dollars in millions | Second Quarter | Percent | |
Unaudited | 2024 | 2023 | Change |
Operating Revenues | $ 28,582 | $ 28,845 | (0.9 %) |
Operating Income | 7,005 | 7,177 | (2.4 %) |
Operating Income Margin | 24.5 % | 24.9 % | (40 BP) |
Communications segment revenues were $28.6 billion, down 0.9% year over year, with operating income down 2.4%.
Mobility | |||
Dollars in millions; Subscribers in thousands | Second Quarter | Percent | |
Unaudited | 2024 | 2023 | Change |
Operating Revenues | $ 20,480 | $ 20,315 | 0.8 % |
Service | 16,277 | 15,745 | 3.4 % |
Equipment | 4,203 | 4,570 | (8.0 %) |
Operating Expenses | 13,761 | 13,702 | 0.4 % |
Operating Income | 6,719 | 6,613 | 1.6 % |
Operating Income Margin | 32.8 % | 32.6 % | 20 BP |
EBITDA* | $ 9,195 | $ 8,736 | 5.3 % |
EBITDA Margin* | 44.9 % | 43.0 % | 190 BP |
EBITDA Service Margin* | 56.5 % | 55.5 % | 100 BP |
Total Wireless Net Adds (excl. Connected Devices)1 | 997 | 1,063 | |
Postpaid | 593 | 464 | |
Postpaid Phone | 419 | 326 | |
Postpaid Other | 174 | 138 | |
Prepaid Phone | 35 | 123 | |
Postpaid Churn | 0.85 % | 0.95 % | (10 BP) |
Postpaid Phone-Only Churn | 0.70 % | 0.79 % | (9 BP) |
Prepaid Churn | 2.57 % | 2.50 % | 7 BP |
Postpaid Phone ARPU | $56.42 | $55.63 | 1.4 % |
Mobility service revenue grew 3.4% year over year driving EBITDA service margin* expansion of 100 basis points. Postpaid phone net adds were 419,000 with postpaid phone churn of 0.70%, down 9 basis points year over year.
Mobility revenues were up 0.8% year over year, driven by service revenue growth of 3.4% from subscriber gains and postpaid phone average revenue per subscriber (ARPU) growth, offset by lower equipment revenues due to lower sales volumes. Operating expenses were up 0.4% year over year due to higher depreciation expense from Open RAN deployment and network transformation, partially offset by lower equipment expenses resulting from lower sales volumes. Operating income was $6.7 billion, up 1.6% year over year. EBITDA* was $9.2 billion, up $459 million year over year, driven by service revenue growth. This was the company's highest-ever second-quarter Mobility EBITDA*.
Business Wireline | |||
Dollars in millions | Second Quarter | Percent | |
Unaudited | 2024 | 2023 | Change |
Operating Revenues | $ 4,755 | $ 5,279 | (9.9 %) |
Operating Expenses | 4,653 | 4,883 | (4.7 %) |
Operating Income | 102 | 396 | (74.2 %) |
Operating Income Margin | 2.1 % | 7.5 % | (540 BP) |
EBITDA* | $ 1,488 | $ 1,729 | (13.9 %) |
EBITDA Margin* | 31.3 % | 32.8 % | (150 BP) |
Business Wireline revenues and profitability declined year over year driven by continued secular pressures on legacy voice and data services that were partially offset by growth in fiber and other advanced connectivity services.
Business Wireline revenues were down 9.9% year over year, primarily due to lower demand for legacy voice and data services as well as product simplification, partially offset by growth in connectivity services. Results also reflect the second-quarter 2024 contribution of our cybersecurity business into a new joint venture. Operating expenses were down 4.7% year over year due to lower personnel, network access and customer support expenses, partially offset by higher vendor credits in the prior year quarter. Operating income was $102 million versus $396 million in the prior-year quarter, and EBITDA* was $1.5 billion, down $241 million year over year.
Consumer Wireline | |||
Dollars in millions; Subscribers in thousands | Second Quarter | Percent | |
Unaudited | 2024 | 2023 | Change |
Operating Revenues | $ 3,347 | $ 3,251 | 3.0 % |
Broadband | 2,741 | 2,561 | 7.0 % |
Operating Expenses | 3,163 | 3,083 | 2.6 % |
Operating Income | 184 | 168 | 9.5 % |
Operating Income Margin | 5.5 % | 5.2 % | 30 BP |
EBITDA* | $ 1,098 | $ 1,025 | 7.1 % |
EBITDA Margin* | 32.8 % | 31.5 % | 130 BP |
Broadband Net Adds (excluding DSL) | 52 | (35) | |
Fiber | 239 | 251 | |
Non Fiber | (187) | (286) | |
AT&T Internet Air | 139 | 2 | |
Broadband ARPU | $66.17 | $62.26 | 6.3 % |
Fiber ARPU | $69.00 | $66.70 | 3.4 % |
Consumer Wireline achieved strong revenue growth with improving EBITDA margins*. Consumer Wireline also delivered positive broadband net adds for the fourth consecutive quarter, driven by 239,000 AT&T Fiber net adds and 139,000 AT&T Internet Air net adds.
Consumer Wireline revenues were up 3.0% year over year driven by growth in broadband revenues attributable to fiber revenues, which grew 17.9%, partially offset by declines in legacy voice and data services and other services. Operating expenses were up 2.6% year over year, primarily due to higher depreciation and increased network-related costs, which were largely offset by lower customer support costs. Operating income was $184 million versus $168 million in the prior-year quarter, and EBITDA* was $1.1 billion, up $73 million year over year.
Latin America Segment - Mexico | |||
Dollars in millions; Subscribers in thousands | Second Quarter | Percent | |
Unaudited | 2024 | 2023 | Change |
Operating Revenues | $ 1,103 | $ 967 | 14.1 % |
Service | 699 | 635 | 10.1 % |
Equipment | 404 | 332 | 21.7 % |
Operating Expenses | 1,097 | 1,006 | 9.0 % |
Operating Income/(Loss) | 6 | (39) | -- % |
EBITDA* | 178 | 146 | 21.9 % |
Total Wireless Net Adds | 177 | 76 | |
Postpaid | 142 | 56 | |
Prepaid | 67 | 50 | |
Reseller | (32) | (30) | |
Latin America segment revenues were up 14.1% year over year, primarily due to higher equipment sales, subscriber growth, and favorable impacts of foreign exchange rates. Operating expenses were up 9.0% due to higher equipment and selling costs attributable to subscriber growth and unfavorable impact of foreign exchange. Operating income was $6 million compared to ($39) million in the year-ago quarter. EBITDA* was $178 million, up $32 million year over year.
* Further clarification and explanation of non-GAAP measures and reconciliations to their most comparable GAAP measures can be found in the "Non-GAAP Measures and Reconciliations to GAAP Measures" section of the release and at https://investors.att.com. |
1 Effective with our first-quarter 2024 reporting, we have removed connected devices from our total Mobility subscribers, consistent with industry standards and our key performance metrics. Connected devices include data-centric devices such as session-based tablets, monitoring devices and primarily wholesale automobile systems. |
About AT&T
We help more than 100 million U.S. families, friends and neighbors, plus nearly 2.5 million businesses, connect to greater possibility. From the first phone call 140+ years ago to our 5G wireless and multi-gig internet offerings today, we @ATT innovate to improve lives. For more information about AT&T Inc. ((T), please visit us at about.att.com. Investors can learn more at investors.att.com.
Cautionary Language Concerning Forward-Looking Statements
Information set forth in this news release contains financial estimates and other forward-looking statements that are subject to risks and uncertainties, and actual results might differ materially. A discussion of factors that may affect future results is contained in AT&T's filings with the Securities and Exchange Commission. AT&T disclaims any obligation to update and revise statements contained in this news release based on new information or otherwise. This news release may contain certain non-GAAP financial measures. Reconciliations between the non-GAAP financial measures and the GAAP financial measures are available on the company's website at https://investors.att.com.
Non-GAAP Measures and Reconciliations to GAAP Measures
Schedules and reconciliations of non-GAAP financial measures cited in this document to the most directly comparable financial measures under generally accepted accounting principles (GAAP) can be found at https://investors.att.com and in our Form 8-K dated July 24, 2024. Adjusted diluted EPS, adjusted operating income, EBITDA, adjusted EBITDA, free cash flow, net debt and net debt-to-adjusted EBITDA are non-GAAP financial measures frequently used by investors and credit rating agencies.
Adjusted diluted EPS is calculated by excluding from operating revenues, operating expenses, other income (expenses) and income tax expense, certain significant items that are non-operational or non-recurring in nature, including dispositions and merger integration and transaction costs, actuarial gains and losses, significant abandonments and impairments, benefit-related gains and losses, employee separation and other material gains and losses.
Non-operational items arising from asset acquisitions and dispositions include the amortization of intangible assets. While the expense associated with the amortization of certain wireless licenses and customer lists is excluded, the revenue of the acquired companies is reflected in the measure and those assets contribute to revenue generation.
We also adjust for net actuarial gains or losses associated with our pension and postemployment benefit plans due to the often-significant impact on our results (we immediately recognize this gain or loss in the income statement, pursuant to our accounting policy for the recognition of actuarial gains and losses). Consequently, our adjusted results reflect an expected return on plan assets rather than the actual return on plan assets, as included in the GAAP measure of income.
The tax impact of adjusting items is calculated using the effective tax rate during the quarter except for adjustments that, given their magnitude, can drive a change in the effective tax rate, in these cases we use the actual tax expense or combined marginal rate of approximately 25%.
For 2Q24, adjusted EPS of $0.57 is diluted EPS of $0.49 adjusted for $0.05 restructuring costs and $0.03 proportionate share of intangible amortization at the DIRECTV equity method investment.
For 2Q23, adjusted EPS of $0.63 is diluted EPS of $0.61 adjusted for $0.03 proportionate share of intangible amortization at the DIRECTV equity method investment, minus $0.01 net actuarial and settlement gains on benefit plans.
The company expects adjustments to 2024 reported diluted EPS to include our proportionate share of intangible amortization at the DIRECTV equity method investment in the range of $0.5-$0.7 billion, a non-cash mark-to-market benefit plan gain/loss, and other items. The company expects the mark-to-market adjustment, which is driven by interest rates and investment returns that are not reasonably estimable at this time, to be a significant item. Our projected 2024 and 2025 adjusted EPS depend on future levels of revenues and expenses, most of which are not reasonably estimable at this time. Accordingly, we cannot provide a reconciliation between these projected non-GAAP metrics and the reported GAAP metrics without unreasonable effort.
Adjusted operating income is operating income adjusted for revenues and costs we consider non-operational in nature, including items arising from asset acquisitions or dispositions. For 2Q24, adjusted operating income of $6.3 billion is calculated as operating income of $5.8 billion plus $520 million of adjustments. For 2Q23, adjusted operating income of $6.4 billion is calculated as operating income of $6.4 billion minus $11 million of adjustments. Adjustments for all periods are detailed in the Discussion and Reconciliation of Non-GAAP Measures included in our Form 8-K dated July 24, 2024.
EBITDA is net income plus income tax, interest, and depreciation and amortization expenses minus equity in net income of affiliates and other income (expense) – net. Adjusted EBITDA is calculated by excluding from EBITDA certain significant items that are non-operational or non-recurring in nature, including dispositions and merger integration and transaction costs, significant abandonments and impairments, benefit-related gains and losses, employee separation and other material gains and losses. Adjusted EBITDA estimates depend on future levels of revenues and expenses which are not reasonably estimable at this time. Accordingly, we cannot provide a reconciliation between projected adjusted EBITDA and the most comparable GAAP metrics without unreasonable effort.
For 2Q24, adjusted EBITDA of $11.3 billion is calculated as net income of $3.9 billion, plus income tax expense of $1.1 billion, plus interest expense of $1.7 billion, minus equity in net income of affiliates of $0.3 billion, minus other income (expense) – net of $0.7 billion, plus depreciation and amortization of $5.1 billion, plus adjustments of $505 million. For 2Q23, adjusted EBITDA of $11.1 billion is calculated as net income of $4.8 billion, plus income tax expense of $1.4 billion, plus interest expense of $1.6 billion, minus equity in net income of affiliates of $0.4 billion, minus other income (expense) – net of $1.0 billion, plus depreciation and amortization of $4.7 billion, minus adjustments of $28 million. Adjustments for all periods are detailed in the Discussion and Reconciliation of Non-GAAP Measures included in our Form 8-K dated July 24, 2024.
At the segment or business unit level, EBITDA is operating income before depreciation and amortization. EBITDA margin is operating income before depreciation and amortization, divided by total revenues. EBITDA service margin is operating income before depreciation and amortization, divided by total service revenues.
Free cash flow for 2Q24 of $4.6 billion is cash from operating activities of $9.1 billion, plus cash distributions from DIRECTV classified as investing activities of $0.4 billion, minus capital expenditures of $4.4 billion and cash paid for vendor financing of $0.6 billion. For 2Q23, free cash flow of $4.2 billion is cash from operating activities of $9.9 billion, plus cash distributions from DIRECTV classified as investing activities of $0.2 billion, minus capital expenditures of $4.3 billion and cash paid for vendor financing of $1.6 billion. Due to high variability and difficulty in predicting items that impact cash from operating activities, cash distributions from DIRECTV, capital expenditures and vendor financing payments, the company is not able to provide a reconciliation between projected free cash flow and the most comparable GAAP metric without unreasonable effort.
Capital investment provides a comprehensive view of cash used to invest in our networks, product developments and support systems. In connection with capital improvements, we have favorable payment terms of 120 days or more with certain vendors, referred to as vendor financing, which are excluded from capital expenditures and reported as financing activities. Capital investment includes capital expenditures and cash paid for vendor financing ($0.6 billion in 2Q24 and $1.6 billion in 2Q23). For 2024, capital investment is expected to be in the $21-$22 billion range. Due to high variability and difficulty in predicting items that impact capital expenditures and vendor financing payments, the company is not able to provide a reconciliation between projected capital investment and the most comparable GAAP metrics without unreasonable effort.
Adjusted equity in net income from DIRECTV investment of $0.6 billion for 2Q24 is calculated as equity income from DIRECTV of $0.4 billion reported in Equity in Net Income of Affiliates and excludes $0.3 billion of AT&T's proportionate share of the noncash depreciation and amortization of fair value accretion from DIRECTV's revaluation of assets and purchase price allocation.
Net debt of $126.9 billion at June 30, 2024, is calculated as total debt of $130.6 billion less cash and cash equivalents of $3.1 billion and time deposits (i.e. deposits at financial institutions that are greater than 90 days) of $0.7 billion.
Net debt-to-adjusted EBITDA is calculated by dividing net debt by the sum of the most recent four quarters of adjusted EBITDA. Net debt and adjusted EBITDA are calculated as defined above. Net debt and adjusted EBITDA estimates depend on future levels of revenues, expenses and other metrics which are not reasonably estimable at this time. Accordingly, we cannot provide a reconciliation between projected net debt-to-adjusted EBITDA and the most comparable GAAP metrics and related ratios without unreasonable effort.
Discussion and Reconciliation of Non-GAAP Measures
We believe the following measures are relevant and useful information to investors as they are part of AT&T's internal management reporting and planning processes and are important metrics that management uses to evaluate the operating performance of AT&T and its segments. Management also uses these measures as a method of comparing performance with that of many of our competitors. These measures should be considered in addition to, but not as a substitute for, other measures of financial performance reported in accordance with U.S. generally accepted accounting principles (GAAP).
Free Cash Flow
Free cash flow is defined as cash from operations and cash distributions from DIRECTV classified as investing activities minus capital expenditures and cash paid for vendor financing (classified as financing activities). Free cash flow after dividends is defined as cash from operations and cash distributions from DIRECTV classified as investing activities, minus capital expenditures, cash paid for vendor financing and dividends on common and preferred shares. Free cash flow dividend payout ratio is defined as the percentage of dividends paid on common and preferred shares to free cash flow. We believe these metrics provide useful information to our investors because management views free cash flow as an important indicator of how much cash is generated by routine business operations, including capital expenditures and vendor financing, and from our continued economic interest in the U.S. video operations as part of our DIRECTV equity method investment, and makes decisions based on it. Management also views free cash flow as a measure of cash available to pay debt and return cash to shareowners.
Free Cash Flow and Free Cash Flow Dividend Payout Ratio | |||||
Dollars in millions | |||||
Second Quarter | Six-Month Period | ||||
2024 | 2023 | 2024 | 2023 | ||
Net cash provided by operating activities1 | $ 9,093 | $ 9,922 | $ 16,640 | $ 16,600 | |
Add: Distributions from DIRECTV classified as investing activities | 392 | 200 | 586 | 974 | |
Less: Capital expenditures | (4,360) | (4,270) | (8,118) | (8,605) | |
Less: Cash paid for vendor financing | (550) | (1,643) | (1,391) | (3,756) | |
Free Cash Flow | 4,575 | 4,209 | 7,717 | 5,213 | |
Less: Dividends paid | (2,099) | (2,083) | (4,133) | (4,097) | |
Free Cash Flow after Dividends | $ 2,476 | $ 2,126 | $ 3,584 | $ 1,116 | |
Free Cash Flow Dividend Payout Ratio | 45.9 % | 49.5 % | 53.6 % | 78.6 % | |
Includes distributions from DIRECTV of $350 and $674 in the second quarter and for the first six months of 2024, and $377 and $911 in the second quarter and for the first six months of 2023. |
Cash Paid for Capital Investment
In connection with capital improvements, we negotiate with some of our vendors to obtain favorable payment terms of 120 days or more, referred to as vendor financing, which are excluded from capital expenditures and reported in accordance with GAAP as financing activities. We present an additional view of cash paid for capital investment to provide investors with a comprehensive view of cash used to invest in our networks, product developments and support systems.
Cash Paid for Capital Investment | |||||
Dollars in millions | |||||
Second Quarter | Six-Month Period | ||||
2024 | 2023 | 2024 | 2023 | ||
Capital Expenditures | $ (4,360) | $ (4,270) | $ (8,118) | $ (8,605) | |
Cash paid for vendor financing | (550) | (1,643) | (1,391) | (3,756) | |
Cash paid for Capital Investment | $ (4,910) | $ (5,913) | $ (9,509) | $ (12,361) | |
EBITDA
Our calculation of EBITDA, as presented, may differ from similarly titled measures reported by other companies. For AT&T, EBITDA excludes other income (expense) – net, and equity in net income (loss) of affiliates, as these do not reflect the operating results of our subscriber base or operations that are not under our control. Equity in net income (loss) of affiliates represents the proportionate share of the net income (loss) of affiliates in which we exercise significant influence, but do not control. Because we do not control these entities, management excludes these results when evaluating the performance of our primary operations. EBITDA also excludes interest expense and the provision for income taxes. Excluding these items eliminates the expenses associated with our capital and tax structures. Finally, EBITDA excludes depreciation and amortization in order to eliminate the impact of capital investments. EBITDA does not give effect to cash used for debt service requirements and thus does not reflect available funds for distributions, reinvestment or other discretionary uses. EBITDA is not presented as an alternative measure of operating results or cash flows from operations, as determined in accordance with GAAP.
EBITDA service margin is calculated as EBITDA divided by service revenues.
These measures are used by management as a gauge of our success in acquiring, retaining and servicing subscribers because we believe these measures reflect AT&T's ability to generate and grow subscriber revenues while providing a high level of customer service in a cost-effective manner. Management also uses these measures as a method of comparing cash generation potential with that of many of its competitors. The financial and operating metrics which affect EBITDA include the key revenue and expense drivers for which management is responsible and upon which we evaluate performance.
We believe EBITDA Service Margin (EBITDA as a percentage of service revenues) to be a more relevant measure than EBITDA Margin (EBITDA as a percentage of total revenue) for our Mobility business unit operating margin. We also use wireless service revenues to calculate margin to facilitate comparison, both internally and externally with our wireless competitors, as they calculate their margins using wireless service revenues as well.
There are material limitations to using these non-GAAP financial measures. EBITDA, EBITDA margin and EBITDA service margin, as we have defined them, may not be comparable to similarly titled measures reported by other companies. Furthermore, these performance measures do not take into account certain significant items, including depreciation and amortization, interest expense, tax expense and equity in net income (loss) of affiliates. For market comparability, management analyzes performance measures that are similar in nature to EBITDA as we present it, and considering the economic effect of the excluded expense items independently as well as in connection with its analysis of net income as calculated in accordance with GAAP. EBITDA, EBITDA margin and EBITDA service margin should be considered in addition to, but not as a substitute for, other measures of financial performance reported in accordance with GAAP.
EBITDA, EBITDA Margin and EBITDA Service Margin | |||||
Dollars in millions | |||||
Second Quarter | Six-Month Period | ||||
2024 | 2023 | 2024 | 2023 | ||
Net Income | $ 3,949 | $ 4,762 | $ 7,700 | $ 9,215 | |
Additions: | |||||
Income Tax Expense | 1,142 | 1,403 | 2,260 | 2,717 | |
Interest Expense | 1,699 | 1,608 | 3,423 | 3,316 | |
Equity in Net (Income) of Affiliates | (348) | (380) | (643) | (918) | |
Other (Income) Expense - Net | (682) | (987) | (1,133) | (1,922) | |
Depreciation and amortization | 5,072 | 4,675 | 10,119 | 9,306 | |
EBITDA | 10,832 | 11,081 | 21,726 | 21,714 | |
Transaction and other costs | 35 | — | 67 | — | |
Benefit-related (gain) loss | (10) | (28) | (49) | (72) | |
Asset impairments and abandonments and restructuring | 480 | — | 639 | — | |
Adjusted EBITDA1 | $ 11,337 | $ 11,053 | $ 22,383 | $ 21,642 | |
1 See "Adjusting Items" section for additional discussion and reconciliation of adjusted items. |
Segment and Business Unit EBITDA, EBITDA Margin and EBITDA Service Margin | |||||
Dollars in millions | |||||
Second Quarter | Six-Month Period | ||||
2024 | 2023 | 2024 | 2023 | ||
Communications Segment | |||||
Operating Income | $ 7,005 | $ 7,177 | $ 13,750 | $ 13,920 | |
Add: Depreciation and amortization | 4,776 | 4,313 | 9,506 | 8,602 | |
EBITDA | $ 11,781 | $ 11,490 | $ 23,256 | $ 22,522 | |
Total Operating Revenues | $ 28,582 | $ 28,845 | $ 57,439 | $ 57,997 | |
Operating Income Margin | 24.5 % | 24.9 % | 23.9 % | 24.0 % | |
EBITDA Margin | 41.2 % | 39.8 % | 40.5 % | 38.8 % | |
Mobility | |||||
Operating Income | $ 6,719 | $ 6,613 | $ 13,187 | $ 12,884 | |
Add: Depreciation and amortization | 2,476 | 2,123 | 4,963 | 4,221 | |
EBITDA | $ 9,195 | $ 8,736 | $ 18,150 | $ 17,105 | |
Total Operating Revenues | $ 20,480 | $ 20,315 | $ 41,074 | $ 40,897 | |
Service Revenues | 16,277 | 15,745 | 32,271 | 31,228 | |
Operating Income Margin | 32.8 % | 32.6 % | 32.1 % | 31.5 % | |
EBITDA Margin | 44.9 % | 43.0 % | 44.2 % | 41.8 % | |
EBITDA Service Margin | 56.5 % | 55.5 % | 56.2 % | 54.8 % | |
Business Wireline | |||||
Operating Income | $ 102 | $ 396 | $ 166 | $ 774 | |
Add: Depreciation and amortization | 1,386 | 1,333 | 2,748 | 2,663 | |
EBITDA | $ 1,488 | $ 1,729 | $ 2,914 | $ 3,437 | |
Total Operating Revenues | $ 4,755 | $ 5,279 | $ 9,668 | $ 10,610 | |
Operating Income Margin | 2.1 % | 7.5 % | 1.7 % | 7.3 % | |
EBITDA Margin | 31.3 % | 32.8 % | 30.1 % | 32.4 % | |
Consumer Wireline | |||||
Operating Income | $ 184 | $ 168 | $ 397 | $ 262 | |
Add: Depreciation and amortization | 914 | 857 | 1,795 | 1,718 | |
EBITDA | $ 1,098 | $ 1,025 | $ 2,192 | $ 1,980 | |
Total Operating Revenues | $ 3,347 | $ 3,251 | $ 6,697 | $ 6,490 | |
Operating Income Margin | 5.5 % | 5.2 % | 5.9 % | 4.0 % | |
EBITDA Margin | 32.8 % | 31.5 % | 32.7 % | 30.5 % | |
Latin America Segment | |||||
Operating Income (Loss) | $ 6 | $ (39) | $ 9 | $ (69) | |
Add: Depreciation and amortization | 172 | 185 | 349 | 360 | |
EBITDA | $ 178 | $ 146 | $ 358 | $ 291 | |
Total Operating Revenues | $ 1,103 | $ 967 | $ 2,166 | $ 1,850 | |
Operating Income Margin | 0.5 % | -4.0 % | 0.4 % | -3.7 % | |
EBITDA Margin | 16.1 % | 15.1 % | 16.5 % | 15.7 % | |
Adjusting Items
Adjusting items include revenues and costs we consider non-operational in nature, including items arising from asset acquisitions or dispositions, including the amortization of intangible assets. While the expense associated with the amortization of certain wireless licenses and customer lists is excluded, the revenue of the acquired companies is reflected in the measure and that those assets contribute to revenue generation. We also adjust for net actuarial gains or losses associated with our pension and postemployment benefit plans due to the often-significant impact on our results (we immediately recognize this gain or loss in the income statement, pursuant to our accounting policy for the recognition of actuarial gains and losses). Consequently, our adjusted results reflect an expected return on plan assets rather than the actual return on plan assets, as included in the GAAP measure of income.
The tax impact of adjusting items is calculated using the effective tax rate during the quarter except for adjustments that, given their magnitude, can drive a change in the effective tax rate, in these cases we use the actual tax expense or combined marginal rate of approximately 25%.
Adjusting Items | |||||
Dollars in millions | |||||
Second Quarter | Six-Month Period | ||||
2024 | 2023 | 2024 | 2023 | ||
Operating Expenses | |||||
Transaction and other costs | $ 35 | $ — | $ 67 | $ — | |
Benefit-related (gain) loss | (10) | (28) | (49) | (72) | |
Asset impairments and abandonments and restructuring | 480 | — | 639 | — | |
Adjustments to Operations and Support Expenses | 505 | (28) | 657 | (72) | |
Amortization of intangible assets | 15 | 17 | 30 | 34 | |
Adjustments to Operating Expenses | 520 | (11) | 687 | (38) | |
Other | |||||
DIRECTV intangible amortization (proportionate share) | 255 | 324 | 541 | 665 | |
Benefit-related (gain) loss, impairments of investment and other | (16) | (82) | 238 | (193) | |
Actuarial and settlement (gain) loss - net | — | (74) | — | (74) | |
Adjustments to Income Before Income Taxes | 759 | 157 | 1,466 | 360 | |
Tax impact of adjustments | 169 | 35 | 331 | 81 | |
Adjustments to Net Income | $ 590 | $ 122 | $ 1,135 | $ 279 | |
Adjusted Operating Income, Adjusted Operating Income Margin, Adjusted EBITDA, Adjusted EBITDA margin, Adjusted EBITDA service margin and Adjusted diluted EPS are non-GAAP financial measures calculated by excluding from operating revenues, operating expenses, other income (expense) and income tax expense, certain significant items that are non-operational or non-recurring in nature, including dispositions and merger integration and transaction costs, actuarial gains and losses, significant abandonments and impairments, benefit-related gains and losses, employee separation and other material gains and losses. Management believes that these measures provide relevant and useful information to investors and other users of our financial data in evaluating the effectiveness of our operations and underlying business trends.
Adjusted Operating Revenues, Adjusted Operating Income, Adjusted Operating Income Margin, Adjusted EBITDA, Adjusted EBITDA margin, Adjusted EBITDA service margin and Adjusted diluted EPS should be considered in addition to, but not as a substitute for, other measures of financial performance reported in accordance with GAAP. AT&T's calculation of Adjusted items, as presented, may differ from similarly titled measures reported by other companies.
Adjusted Operating Income, Adjusted Operating Income Margin, Adjusted EBITDA and Adjusted EBITDA Margin | |||||
Dollars in millions | |||||
Second Quarter | Six-Month Period | ||||
2024 | 2023 | 2024 | 2023 | ||
Operating Income | $ 5,760 | $ 6,406 | $ 11,607 | $ 12,408 | |
Adjustments to Operating Expenses | 520 | (11) | 687 | (38) | |
Adjusted Operating Income | $ 6,280 | $ 6,395 | $ 12,294 | $ 12,370 | |
EBITDA | $ 10,832 | $ 11,081 | $ 21,726 | $ 21,714 | |
Adjustments to Operations and Support Expenses | 505 | (28) | 657 | (72) | |
Adjusted EBITDA | $ 11,337 | $ 11,053 | $ 22,383 | $ 21,642 | |
Total Operating Revenues | $ 29,797 | $ 29,917 | $ 59,825 | $ 60,056 | |
Operating Income Margin | 19.3 % | 21.4 % | 19.4 % | 20.7 % | |
Adjusted Operating Income Margin | 21.1 % | 21.4 % | 20.5 % | 20.6 % | |
Adjusted EBITDA Margin | 38.0 % | 36.9 % | 37.4 % | 36.0 % | |
Adjusted Diluted EPS | |||||
Second Quarter | Six-Month Period | ||||
2024 | 2023 | 2024 | 2023 | ||
Diluted Earnings Per Share (EPS) | $ 0.49 | $ 0.61 | $ 0.96 | $ 1.19 | |
DIRECTV intangible amortization (proportionate share) | 0.03 | 0.03 | 0.06 | 0.07 | |
Actuarial and settlement (gain) loss - net | — | (0.01) | — | (0.01) | |
Restructuring and impairments | 0.05 | — | 0.11 | — | |
Benefit-related, transaction and other costs | — | — | (0.01) | (0.02) | |
Adjusted EPS | $ 0.57 | $ 0.63 | $ 1.12 | $ 1.23 | |
Year-over-year growth - Adjusted | -9.5 % | -8.9 % | |||
Weighted Average Common Shares Outstanding with Dilution (000,000) | 7,198 | 7,180 | 7,195 | 7,327 | |
Net Debt to Adjusted EBITDA
Net Debt to EBITDA ratios are non-GAAP financial measures frequently used by investors and credit rating agencies and management believes these measures provide relevant and useful information to investors and other users of our financial data. Our Net Debt to Adjusted EBITDA ratio is calculated by dividing the Net Debt by the sum of the most recent four quarters Adjusted EBITDA. Net Debt is calculated by subtracting cash and cash equivalents and deposits at financial institutions that are greater than 90 days (e.g., certificates of deposit and time deposits), from the sum of debt maturing within one year and long-term debt.
Net Debt to Adjusted EBITDA - 2024 | |||||||||
Dollars in millions | |||||||||
Three Months Ended | |||||||||
Sept. 30, | Dec. 31, | March 31, | June 30, | Four Quarters | |||||
20231 | 20231 | 20241 | 2024 | ||||||
Adjusted EBITDA | $ 11,203 | $ 10,555 | $ 11,046 | $ 11,337 | $ 44,141 | ||||
End-of-period current debt | 5,249 | ||||||||
End-of-period long-term debt | 125,355 | ||||||||
Total End-of-Period Debt | 130,604 | ||||||||
Less: Cash and Cash Equivalents | 3,093 | ||||||||
Less: Time Deposits | 650 | ||||||||
Net Debt Balance | 126,861 | ||||||||
Annualized Net Debt to Adjusted EBITDA Ratio | 2.87 | ||||||||
1 As reported in AT&T's Form 8-K filed April 24, 2024.
|
Net Debt to Adjusted EBITDA - 2023 | |||||||||
Dollars in millions | |||||||||
Three Months Ended | |||||||||
Sept. 30, | Dec. 31, | March 31, | June 30, | Four Quarters | |||||
20221 | 20221 | 20231 | 20231 | ||||||
Adjusted EBITDA | $ 10,714 | $ 10,231 | $ 10,589 | $ 11,053 | $ 42,587 | ||||
End-of-period current debt | 15,268 | ||||||||
End-of-period long-term debt | 128,012 | ||||||||
Total End-of-Period Debt | 143,280 | ||||||||
Less: Cash and Cash Equivalents | 9,528 | ||||||||
Less: Time Deposits | 1,750 | ||||||||
Net Debt Balance | 132,002 | ||||||||
Annualized Net Debt to Adjusted EBITDA Ratio | 3.10 | ||||||||
1 As reported in AT&T's Form 8-K filed April 24, 2024.
|
Supplemental Operational Measures
As a supplemental presentation to our Communications segment operating results, we are providing a view of our AT&T Business Solutions results which includes both wireless and fixed operations. This combined view presents a complete profile of the entire business customer relationship and underscores the importance of mobile solutions to serving our business customers. Our supplemental presentation of business solutions operations is calculated by combining our Mobility and Business Wireline operating units, and then adjusting to remove non-business operations. The following table presents a reconciliation of our supplemental Business Solutions results.
Supplemental Operational Measure | ||||||||||
Second Quarter | ||||||||||
June 30, 2024 | June 30, 2023 | |||||||||
Mobility | Business Wireline | Adj.1 | Business Solutions | Mobility | Business Wireline | Adj.1 | Business Solutions | Percent | ||
Operating Revenues | ||||||||||
Wireless service | $ 16,277 | $ — | $ (13,809) | $ 2,468 | $ 15,745 | $ — | $ (13,371) | $ 2,374 | 4.0 % | |
Wireline service | — | 4,571 | — | 4,571 | — | 5,114 | — | 5,114 | (10.6) % | |
Wireless equipment | 4,203 | — | (3,459) | 744 | 4,570 | — | (3,796) | 774 | (3.9) % | |
Wireline equipment | — | 184 | — | 184 | — | 165 | — | 165 | 11.5 % | |
Total Operating Revenues | 20,480 | 4,755 | (17,268) | 7,967 | 20,315 | 5,279 | (17,167) | 8,427 | (5.5) % | |
Operating Expenses | ||||||||||
Operations and support | 11,285 | 3,267 | (9,201) | 5,351 | 11,579 | 3,550 | (9,440) | 5,689 | (5.9) % | |
EBITDA | 9,195 | 1,488 | (8,067) | 2,616 | 8,736 | 1,729 | (7,727) | 2,738 | (4.5) % | |
Depreciation and amortization | 2,476 | 1,386 | (2,025) | 1,837 | 2,123 | 1,333 | (1,733) | 1,723 | 6.6 % | |
Total Operating Expenses | 13,761 | 4,653 | (11,226) | 7,188 | 13,702 | 4,883 | (11,173) | 7,412 | (3.0) % | |
Operating Income | $ 6,719 | $ 102 | $ (6,042) | $ 779 | $ 6,613 | $ 396 | $ (5,994) | $ 1,015 | (23.3) % | |
Operating Income Margin | 9.8 % | 12.0 % | (220) BP | |||||||
1 Non-business wireless reported in the Communications segment under the Mobility business unit.
|
Supplemental Operational Measure | ||||||||||
Six-Month Period | ||||||||||
June 30, 2024 | June 30, 2023 | |||||||||
Mobility | Business Wireline | Adj.1 | Business Solutions | Mobility | Business Wireline | Adj.1 | Business Solutions | Percent Change | ||
Operating Revenues | ||||||||||
Wireless service | $ 32,271 | $ — | $ (27,417) | $ 4,854 | $ 31,228 | $ — | $ (26,574) | $ 4,654 | 4.3 % | |
Wireline service | — | 9,271 | — | 9,271 | — | 10,314 | — | 10,314 | (10.1) % | |
Wireless equipment | 8,803 | — | (7,293) | 1,510 | 9,669 | — | (8,122) | 1,547 | (2.4) % | |
Wireline equipment | — | 397 | — | 397 | — | 296 | — | 296 | 34.1 % | |
Total Operating Revenues | 41,074 | 9,668 | (34,710) | 16,032 | 40,897 | 10,610 | (34,696) | 16,811 | (4.6) % | |
Operating Expenses | ||||||||||
Operations and support | 22,924 | 6,754 | (18,727) | 10,951 | 23,792 | 7,173 | (19,636) | 11,329 | (3.3) % | |
EBITDA | 18,150 | 2,914 | (15,983) | 5,081 | 17,105 | 3,437 | (15,060) | 5,482 | (7.3) % | |
Depreciation and amortization | 4,963 | 2,748 | (4,058) | 3,653 | 4,221 | 2,663 | (3,445) | 3,439 | 6.2 % | |
Total Operating Expenses | 27,887 | 9,502 | (22,785) | 14,604 | 28,013 | 9,836 | (23,081) | 14,768 | (1.1) % | |
Operating Income | $ 13,187 | $ 166 | $ (11,925) | $ 1,428 | $ 12,884 | $ 774 | $ (11,615) | $ 2,043 | (30.1) % | |
Operating Income Margin | 8.9 % | 12.2 % | (330) BP | |||||||
1 Non-business wireless reported in the Communications segment under the Mobility business unit.
|
![]()
© 2024 AT&T Intellectual Property. All rights reserved. AT&T and the Globe logo are registered trademarks of AT&T Intellectual Property.
![]() View original content to download multimedia:https://www.prnewswire.com/news-releases/att-second-quarter-results-demonstrate-consistent-strong-5g-and-fiber-customer-growth-302205205.html
View original content to download multimedia:https://www.prnewswire.com/news-releases/att-second-quarter-results-demonstrate-consistent-strong-5g-and-fiber-customer-growth-302205205.html
SOURCE AT&T