Beyond The Numbers: 8 Analysts Discuss Driven Brands Hldgs Stock
In the last three months, 8 analysts have published ratings on Driven Brands Hldgs (NASDAQ:DRVN), offering a diverse range of perspectives from bullish to bearish.
Summarizing their recent assessments, the table below illustrates the evolving sentiments in the past 30 days and compares them to the preceding months.
| Bullish | Somewhat Bullish | Indifferent | Somewhat Bearish | Bearish | |
|---|---|---|---|---|---|
| Total Ratings | 2 | 4 | 2 | 0 | 0 |
| Last 30D | 0 | 1 | 2 | 0 | 0 |
| 1M Ago | 0 | 0 | 0 | 0 | 0 |
| 2M Ago | 1 | 0 | 0 | 0 | 0 |
| 3M Ago | 1 | 3 | 0 | 0 | 0 |
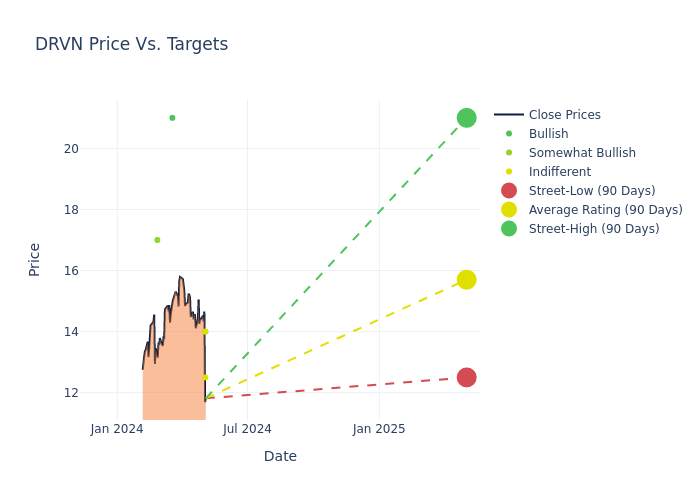
Analysts have set 12-month price targets for Driven Brands Hldgs, revealing an average target of $16.81, a high estimate of $21.00, and a low estimate of $12.50. A negative shift in sentiment is evident as analysts have decreased the average price target by 13.26%.

Breaking Down Analyst Ratings: A Detailed Examination
The analysis of recent analyst actions sheds light on the perception of Driven Brands Hldgs by financial experts. The following summary presents key analysts, their recent evaluations, and adjustments to ratings and price targets.
| Analyst | Analyst Firm | Action Taken | Rating | Current Price Target | Prior Price Target |
|---|---|---|---|---|---|
| Kate McShane | Goldman Sachs | Lowers | Neutral | $14.00 | $16.00 |
| Christian Carlino | JP Morgan | Lowers | Neutral | $12.50 | $18.00 |
| Peter Keith | Piper Sandler | Lowers | Overweight | $14.00 | $18.00 |
| Brian McNamara | Canaccord Genuity | Raises | Buy | $21.00 | $20.00 |
| Steven Shemesh | RBC Capital | Lowers | Outperform | $17.00 | $20.00 |
| Peter Keith | Piper Sandler | Lowers | Overweight | $18.00 | $22.00 |
| Brian McNamara | Canaccord Genuity | Lowers | Buy | $20.00 | $22.00 |
| Christopher Horvers | JP Morgan | Lowers | Overweight | $18.00 | $19.00 |
Key Insights:
- Action Taken: Responding to changing market dynamics and company performance, analysts update their recommendations. Whether they 'Maintain', 'Raise', or 'Lower' their stance, it signifies their response to recent developments related to Driven Brands Hldgs. This offers insight into analysts' perspectives on the current state of the company.
- Rating: Analysts assign qualitative assessments to stocks, ranging from 'Outperform' to 'Underperform'. These ratings convey the analysts' expectations for the relative performance of Driven Brands Hldgs compared to the broader market.
- Price Targets: Analysts navigate through adjustments in price targets, providing estimates for Driven Brands Hldgs's future value. Comparing current and prior targets offers insights into analysts' evolving expectations.
Capture valuable insights into Driven Brands Hldgs's market standing by understanding these analyst evaluations alongside pertinent financial indicators. Stay informed and make strategic decisions with our Ratings Table.
Stay up to date on Driven Brands Hldgs analyst ratings.
If you are interested in following small-cap stock news and performance you can start by tracking it here.
Get to Know Driven Brands Hldgs Better
Driven Brands Holdings Inc is an automotive services company in North America. Its platform provides high-quality services to an extensive range of retail and commercial customers. The company provides an extensive range of core consumer and commercial automotive needs, including paint, collision, glass, and repair services, as well as a variety of high-frequency services, such as oil changes and car washes.
Driven Brands Hldgs: Financial Performance Dissected
Market Capitalization Analysis: Reflecting a smaller scale, the company's market capitalization is positioned below industry averages. This could be attributed to factors such as growth expectations or operational capacity.
Revenue Growth: Driven Brands Hldgs's revenue growth over a period of 3 months has been noteworthy. As of 31 December, 2023, the company achieved a revenue growth rate of approximately 2.6%. This indicates a substantial increase in the company's top-line earnings. As compared to competitors, the company encountered difficulties, with a growth rate lower than the average among peers in the Industrials sector.
Net Margin: Driven Brands Hldgs's net margin is below industry standards, pointing towards difficulties in achieving strong profitability. With a net margin of 0.46%, the company may encounter challenges in effective cost control.
Return on Equity (ROE): Driven Brands Hldgs's financial strength is reflected in its exceptional ROE, which exceeds industry averages. With a remarkable ROE of 0.28%, the company showcases efficient use of equity capital and strong financial health.
Return on Assets (ROA): Driven Brands Hldgs's ROA is below industry averages, indicating potential challenges in efficiently utilizing assets. With an ROA of 0.04%, the company may face hurdles in achieving optimal financial returns.
Debt Management: Driven Brands Hldgs's debt-to-equity ratio surpasses industry norms, standing at 4.72. This suggests the company carries a substantial amount of debt, posing potential financial challenges.
The Basics of Analyst Ratings
Within the domain of banking and financial systems, analysts specialize in reporting for specific stocks or defined sectors. Their work involves attending company conference calls and meetings, researching company financial statements, and communicating with insiders to publish "analyst ratings" for stocks. Analysts typically assess and rate each stock once per quarter.
In addition to their assessments, some analysts extend their insights by offering predictions for key metrics such as earnings, revenue, and growth estimates. This supplementary information provides further guidance for traders. It is crucial to recognize that, despite their specialization, analysts are human and can only provide forecasts based on their beliefs.
This article was generated by Benzinga's automated content engine and reviewed by an editor.
