Deere Reports Net Income of $2.369 Billion for Fourth Quarter, $10.166 Billion for Fiscal Year
- Net income grows for quarter and full year, driven by solid market conditions, differentiated products, and strong execution.
- Full-year 2024 earnings forecast to be $7.75 to $8.25 billion, as volumes return to mid‑cycle levels.
- Ongoing focus on structural profitability, investments that deliver customer value.
MOLINE, Ill., Nov. 22, 2023 /PRNewswire/ -- Deere & Company reported net income of $2.369 billion for the fourth quarter ended October 29, 2023, or $8.26 per share, compared with net income of $2.246 billion, or $7.44 per share, for the quarter ended October 30, 2022. For fiscal-year 2023, net income attributable to Deere & Company was $10.166 billion, or $34.63 per share, compared with $7.131 billion, or $23.28 per share, in fiscal 2022.
Worldwide net sales and revenues decreased 1 percent, to $15.412 billion, for the fourth quarter of fiscal 2023 and rose 16 percent, to $61.251 billion, for the full year. Net sales were $13.801 billion for the quarter and $55.565 billion for the year, compared with $14.351 billion and $47.917 billion in 2022.
"Deere's fourth-quarter and full-year results can be attributed to the successful execution of our Smart Industrial Operating Model and the value that customers recognize in our industry-leading products and solutions," said John C. May, chairman and chief executive officer. "We must also recognize and credit our dedicated employees, dealers, and suppliers, whose hard work and focus have been instrumental to our overall success."
Company Outlook & Summary
Net income attributable to Deere & Company for fiscal 2024 is forecasted to be in a range of $7.75 billion to $8.25 billion.
"While our end markets will fluctuate, we remain focused on disciplined execution and strategically investing in solutions that drive customer value," May said. "As evidenced by our guidance for 2024, we are demonstrating higher levels of through-cycle structural profitability while making our company more resilient and better equipped for the future."
Deere & Company | Fourth Quarter | Full Year | |||||||||||||||
$ in millions, except per share amounts | 2023 | 2022 | % Change | 2023 | 2022 | % Change | |||||||||||
Net sales and revenues | $ | 15,412 | $ | 15,536 | -1 % | $ | 61,251 | $ | 52,577 | 16 % | |||||||
Net income | $ | 2,369 | $ | 2,246 | 5 % | $ | 10,166 | $ | 7,131 | 43 % | |||||||
Fully diluted EPS | $ | 8.26 | $ | 7.44 | $ | 34.63 | $ | 23.28 | |||||||||
Results for the presented periods were affected by special items. See Note 1 of the financial statements for further details.
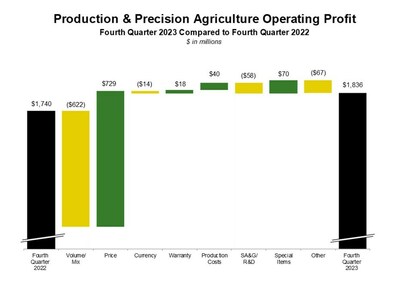
Production & Precision Agriculture | Fourth Quarter | ||||||||
$ in millions | 2023 | 2022 | % Change | ||||||
Net sales | $ | 6,965 | $ | 7,434 | -6 % | ||||
Operating profit | $ | 1,836 | $ | 1,740 | 6 % | ||||
Operating margin | 26.4 % | 23.4 % | |||||||
Production and precision agriculture sales decreased for the quarter due to lower shipment volumes partially offset by price realization. Operating profit improved primarily due to price realization partially offset by lower shipment volumes / sales mix and higher SA&G and R&D expenses. The prior period was impacted by higher reserves on assets in Russia.
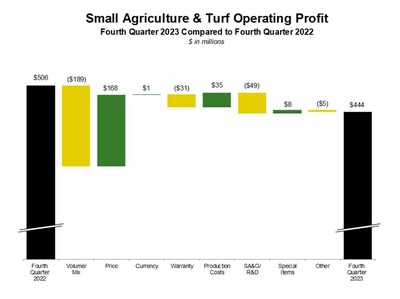
Small Agriculture & Turf | Fourth Quarter | ||||||||
$ in millions | 2023 | 2022 | % Change | ||||||
Net sales | $ | 3,094 | $ | 3,544 | -13 % | ||||
Operating profit | $ | 444 | $ | 506 | -12 % | ||||
Operating margin | 14.4 % | 14.3 % | |||||||
Small agriculture and turf sales decreased for the quarter due to lower shipment volumes partially offset by price realization. Operating profit decreased due to lower shipment volumes / sales mix and higher SA&G and R&D expenses, partially offset by price realization.
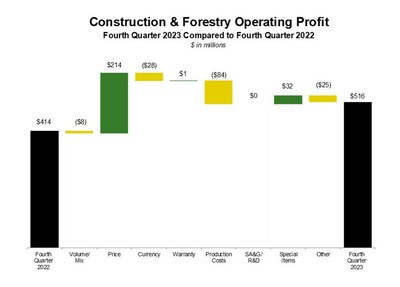
Construction & Forestry | Fourth Quarter | ||||||||
$ in millions | 2023 | 2022 | % Change | ||||||
Net sales | $ | 3,742 | $ | 3,373 | 11 % | ||||
Operating profit | $ | 516 | $ | 414 | 25 % | ||||
Operating margin | 13.8 % | 12.3 % | |||||||
Construction and forestry sales increased for the quarter due to price realization and higher shipment volumes. Operating profit improved primarily due to price realization, partially offset by higher production costs, less-favorable sales mix, the unfavorable effects of foreign currency exchange, and a loss on the sale of the Russian roadbuilding business. The prior period was impacted by higher reserves on assets in Russia.
Financial Services | Fourth Quarter | ||||||||
$ in millions | 2023 | 2022 | % Change | ||||||
Net income | $ | 190 | $ | 232 | -18 % | ||||
Financial services net income for the quarter decreased due to unfavorable derivative valuation adjustments, less-favorable financing spreads, and a higher provision for credit losses (excluding reserves in Russia). These factors were partially offset by income earned on a higher average portfolio. In the fourth quarter of 2022, financial services increased its reserves for credit losses in Russia and recorded an intercompany benefit from the equipment operations, which guarantees the financial services' investment in certain international markets, including Russia.
Industry Outlook for Fiscal 2024 | |||||||
Agriculture & Turf | |||||||
U.S. & Canada: | |||||||
Large Ag | Down 10 to 15% | ||||||
Small Ag & Turf | Down 5 to 10% | ||||||
Europe | Down ~10% | ||||||
South America (Tractors & Combines) | Down ~10% | ||||||
Asia | Down moderately | ||||||
Construction & Forestry | |||||||
U.S. & Canada: | |||||||
Construction Equipment | Down 5 to 10% | ||||||
Compact Construction Equipment | Flat to Down 5% | ||||||
Global Forestry | Down ~10% | ||||||
Global Roadbuilding | Flat |
Deere Segment Outlook for Fiscal 2024 | Currency | Price | |||||
$ in millions | Net Sales | Translation | Realization | ||||
Production & Precision Ag | Down 15 to 20% | ~ Flat | +1.5 % | ||||
Small Ag & Turf | Down 10 to 15% | ~ Flat | +1.0 % | ||||
Construction & Forestry | Down ~10% | ~ Flat | +1.5 % | ||||
Financial Services | Net Income | ~ $770 | |||||
Financial Services. Fiscal-year 2024 net income attributable to Deere & Company for the financial services operations is forecast to be approximately $770 million. Results are expected to be higher in 2024 due to income earned on a higher average portfolio, partially offset by less-favorable financing spreads and lower gains on operating-lease residual values. A correction of the accounting treatment for financing incentives offered to John Deere dealers impacted 2023 financial results. See Note 1 of the financial statements for further details.
FORWARD-LOOKING STATEMENTS
Certain statements contained herein, including in the section entitled "Company Outlook & Summary," "Industry Outlook," and "Deere Segment Outlook," relating to future events, expectations, and trends constitute "forward-looking statements" as defined in the Private Securities Litigation Reform Act of 1995 and involve factors that are subject to change, assumptions, risks, and uncertainties that could cause actual results to differ materially. Some of these risks and uncertainties could affect all lines of the company's operations generally while others could more heavily affect a particular line of business.
Forward-looking statements are based on currently available information and current assumptions, expectations, and projections about future events and should not be relied upon. Except as required by law, the company expressly disclaims any obligation to update or revise its forward-looking statements. Many factors, risks, and uncertainties could cause actual results to differ materially from these forward-looking statements. Among these factors are risks related to:
- changes in U.S., foreign and international laws, regulations, and policies relating to trade, spending, taxing, banking, monetary, environmental (including climate change and engine emission), and farming policies;
- political, economic, and social instability of the geographies in which the company operates, including the ongoing war between Russia and Ukraine and the war between Israel and Hamas;
- adverse macroeconomic conditions, including unemployment, inflation, rising interest rates, changes in consumer practices due to slower economic growth or possible recession, and regional or global liquidity constraints;
- growth and sustainability of non-food uses for crops (including ethanol and biodiesel production);
- the ability to execute business strategies, including the company's Smart Industrial Operating Model, Leap Ambitions, and mergers and acquisitions;
- the ability to understand and meet customers' changing expectations and demand for John Deere products and solutions;
- accurately forecasting customer demand for products and services and adequately managing inventory;
- the ability to integrate new technology, including automation and machine learning, and deliver precision technology and solutions to customers;
- changes to governmental communications channels (radio frequency technology);
- the ability to adapt in highly competitive markets;
- dealer practices and their ability to manage distribution of John Deere products and support and service precision technology solutions;
- changes in climate patterns, unfavorable weather events, and natural disasters;
- governmental and other actions designed to address climate change in connection with a transition to a lower-carbon economy;
- higher interest rates and currency fluctuations which could adversely affect the U.S. dollar, customer confidence, access to capital, and demand for John Deere products and solutions;
- availability and price of raw materials, components, and whole goods;
- delays or disruptions in the company's supply chain;
- labor relations and contracts, including work stoppages and other disruptions;
- the ability to attract, develop, engage, and retain qualified personnel;
- security breaches, cybersecurity attacks, technology failures, and other disruptions to John Deere information technology infrastructure and products;
- loss of or challenges to intellectual property rights;
- compliance with evolving U.S. and foreign laws, including economic sanctions, data privacy, and environmental laws and regulations;
- legislation introduced or enacted that could affect the company's business model and intellectual property, such as so-called right to repair or right to modify legislation;
- investigations, claims, lawsuits, or other legal proceedings;
- events that damage the company's reputation or brand;
- world grain stocks, available farm acres, soil conditions, harvest yields, prices for commodities and livestock, input costs, and availability of transport for crops; and
- housing starts and supply, real estate and housing prices, levels of public and non-residential construction, and infrastructure investment.
Further information concerning the company and its businesses, including factors that could materially affect the financial results, is included in the company's filings with the SEC (including, but not limited to, the factors discussed in Item 1A. "Risk Factors" of the most recent Annual Report on Form 10-K and subsequent Quarterly Reports on Form 10-Q). There also may be other factors that the company cannot anticipate or that are not described herein because the company does not currently perceive them to be material.
DEERE & COMPANY FOURTH QUARTER 2023 PRESS RELEASE (In millions of dollars) Unaudited | ||||||||||||||||
Three Months Ended | Years Ended | |||||||||||||||
October 29 | October 30 | % | October 29 | October 30 | % | |||||||||||
2023 | 2022 | Change | 2023 | 2022 | Change | |||||||||||
Net sales and revenues: | ||||||||||||||||
Production & precision ag net sales | $ | 6,965 | $ | 7,434 | -6 | $ | 26,790 | $ | 22,002 | +22 | ||||||
Small ag & turf net sales | 3,094 | 3,544 | -13 | 13,980 | 13,381 | +4 | ||||||||||
Construction & forestry net sales | 3,742 | 3,373 | +11 | 14,795 | 12,534 | +18 | ||||||||||
Financial services revenues | 1,347 | 988 | +36 | 4,721 | 3,625 | +30 | ||||||||||
Other revenues | 264 | 197 | +34 | 965 | 1,035 | -7 | ||||||||||
Total net sales and revenues | $ | 15,412 | $ | 15,536 | -1 | $ | 61,251 | $ | 52,577 | +16 | ||||||
Operating profit: * | ||||||||||||||||
Production & precision ag | $ | 1,836 | $ | 1,740 | +6 | $ | 6,996 | $ | 4,386 | +60 | ||||||
Small ag & turf | 444 | 506 | -12 | 2,472 | 1,949 | +27 | ||||||||||
Construction & forestry | 516 | 414 | +25 | 2,695 | 2,014 | +34 | ||||||||||
Financial services | 229 | 297 | -23 | 795 | 1,159 | -31 | ||||||||||
Total operating profit | 3,025 | 2,957 | +2 | 12,958 | 9,508 | +36 | ||||||||||
Reconciling items ** | 51 | (68) | 79 | (370) | ||||||||||||
Income taxes | (707) | (643) | +10 | (2,871) | (2,007) | +43 | ||||||||||
Net income attributable to | $ | 2,369 | $ | 2,246 | +5 | $ | 10,166 | $ | 7,131 | +43 | ||||||
* | Operating profit is income from continuing operations before corporate expenses, certain external interest expense, certain foreign exchange gains and losses, and income taxes. Operating profit for financial services includes the effect of interest expense and foreign exchange gains or losses. |
** | Reconciling items are primarily corporate expenses, certain interest income and expenses, certain foreign exchange gains and losses, pension and postretirement benefit costs excluding the service cost component, equity in income of unconsolidated affiliates, and net income attributable to noncontrolling interests. |
DEERE & COMPANY STATEMENTS OF CONSOLIDATED INCOME For the Three Months and Years Ended October 29, 2023 and October 30, 2022 (In millions of dollars and shares except per share amounts) Unaudited | ||||||||||||
Three Months Ended | Years Ended | |||||||||||
2023 | 2022 | 2023 | 2022 | |||||||||
Net Sales and Revenues | ||||||||||||
Net sales | $ | 13,801 | $ | 14,351 | $ | 55,565 | $ | 47,917 | ||||
Finance and interest income | 1,357 | 925 | 4,683 | 3,365 | ||||||||
Other income | 254 | 260 | 1,003 | 1,295 | ||||||||
Total | 15,412 | 15,536 | 61,251 | 52,577 | ||||||||
Costs and Expenses | ||||||||||||
Cost of sales | 9,427 | 10,214 | 37,715 | 35,338 | ||||||||
Research and development expenses | 606 | 576 | 2,177 | 1,912 | ||||||||
Selling, administrative and general expenses | 1,203 | 1,192 | 4,595 | 3,863 | ||||||||
Interest expense | 781 | 348 | 2,453 | 1,062 | ||||||||
Other operating expenses | 322 | 320 | 1,292 | 1,275 | ||||||||
Total | 12,339 | 12,650 | 48,232 | 43,450 | ||||||||
Income of Consolidated Group before Income Taxes | 3,073 | 2,886 | 13,019 | 9,127 | ||||||||
Provision for income taxes | 707 | 643 | 2,871 | 2,007 | ||||||||
Income of Consolidated Group | 2,366 | 2,243 | 10,148 | 7,120 | ||||||||
Equity in income of unconsolidated affiliates | 2 | 1 | 7 | 10 | ||||||||
Net Income | 2,368 | 2,244 | 10,155 | 7,130 | ||||||||
Less: Net loss attributable to noncontrolling interests | (1) | (2) | (11) | (1) | ||||||||
Net Income Attributable to Deere & Company | $ | 2,369 | $ | 2,246 | $ | 10,166 | $ | 7,131 | ||||
Per Share Data | ||||||||||||
Basic | $ | 8.30 | $ | 7.48 | $ | 34.80 | $ | 23.42 | ||||
Diluted | 8.26 | 7.44 | 34.63 | 23.28 | ||||||||
Dividends declared | 1.35 | 1.13 | 5.05 | 4.36 | ||||||||
Dividends paid | 1.25 | 1.13 | 4.83 | 4.28 | ||||||||
Average Shares Outstanding | ||||||||||||
Basic | 285.5 | 300.4 | 292.2 | 304.5 | ||||||||
Diluted | 286.9 | 302.1 | 293.6 | 306.3 | ||||||||
See Condensed Notes to Consolidated Financial Statements.
DEERE & COMPANY CONDENSED CONSOLIDATED BALANCE SHEETS As of October 29, 2023 and October 30, 2022 (In millions of dollars) Unaudited | ||||||
2023 | 2022 | |||||
Assets | ||||||
Cash and cash equivalents | $ | 7,458 | $ | 4,774 | ||
Marketable securities | 946 | 734 | ||||
Trade accounts and notes receivable – net | 7,739 | 6,410 | ||||
Financing receivables – net | 43,673 | 36,634 | ||||
Financing receivables securitized – net | 7,335 | 5,936 | ||||
Other receivables | 2,623 | 2,492 | ||||
Equipment on operating leases – net | 6,917 | 6,623 | ||||
Inventories | 8,160 | 8,495 | ||||
Property and equipment – net | 6,879 | 6,056 | ||||
Goodwill | 3,900 | 3,687 | ||||
Other intangible assets – net | 1,133 | 1,218 | ||||
Retirement benefits | 3,007 | 3,730 | ||||
Deferred income taxes | 1,814 | 824 | ||||
Other assets | 2,503 | 2,417 | ||||
Total Assets | $ | 104,087 | $ | 90,030 | ||
Liabilities and Stockholders' Equity | ||||||
Liabilities | ||||||
Short-term borrowings | $ | 17,939 | $ | 12,592 | ||
Short-term securitization borrowings | 6,995 | 5,711 | ||||
Accounts payable and accrued expenses | 16,130 | 14,822 | ||||
Deferred income taxes | 520 | 495 | ||||
Long-term borrowings | 38,477 | 33,596 | ||||
Retirement benefits and other liabilities | 2,140 | 2,457 | ||||
Total liabilities | 82,201 | 69,673 | ||||
Redeemable noncontrolling interest | 97 | 92 | ||||
Stockholders' Equity | ||||||
Total Deere & Company stockholders' equity | 21,785 | 20,262 | ||||
Noncontrolling interests | 4 | 3 | ||||
Total stockholders' equity | 21,789 | 20,265 | ||||
Total Liabilities and Stockholders' Equity | $ | 104,087 | $ | 90,030 | ||
See Condensed Notes to Consolidated Financial Statements.
DEERE & COMPANY STATEMENTS OF CONSOLIDATED CASH FLOWS For the Years Ended October 29, 2023 and October 30, 2022 (In millions of dollars) Unaudited | ||||||
2023 | 2022 | |||||
Cash Flows from Operating Activities | ||||||
Net income | $ | 10,155 | $ | 7,130 | ||
Adjustments to reconcile net income to net cash provided by operating | ||||||
Provision (credit) for credit losses | (16) | 192 | ||||
Provision for depreciation and amortization | 2,004 | 1,895 | ||||
Impairments and other adjustments | 191 | 88 | ||||
Share-based compensation expense | 130 | 85 | ||||
Gain on remeasurement of previously held equity investment | (326) | |||||
Credit for deferred income taxes | (790) | (66) | ||||
Changes in assets and liabilities: | ||||||
Receivables related to sales | (4,253) | (2,483) | ||||
Inventories | 279 | (2,091) | ||||
Accounts payable and accrued expenses | 830 | 1,133 | ||||
Accrued income taxes payable/receivable | (23) | 141 | ||||
Retirement benefits | (170) | (1,015) | ||||
Other | 252 | 16 | ||||
Net cash provided by operating activities | 8,589 | 4,699 | ||||
Cash Flows from Investing Activities | ||||||
Collections of receivables (excluding receivables related to sales) | 23,051 | 20,907 | ||||
Proceeds from sales of equipment on operating leases | 1,981 | 2,093 | ||||
Cost of receivables acquired (excluding receivables related to sales) | (28,772) | (26,300) | ||||
Acquisitions of businesses, net of cash acquired | (82) | (498) | ||||
Purchases of property and equipment | (1,498) | (1,134) | ||||
Cost of equipment on operating leases acquired | (2,970) | (2,654) | ||||
Collateral on derivatives – net | (12) | (642) | ||||
Other | (447) | (257) | ||||
Net cash used for investing activities | (8,749) | (8,485) | ||||
Cash Flows from Financing Activities | ||||||
Net proceeds in short-term borrowings (original maturities three months or less) | 4,008 | 3,852 | ||||
Proceeds from borrowings issued (original maturities greater than three months) | 15,429 | 10,358 | ||||
Payments of borrowings (original maturities greater than three months) | (7,913) | (8,445) | ||||
Repurchases of common stock | (7,216) | (3,597) | ||||
Dividends paid | (1,427) | (1,313) | ||||
Other | (73) | (29) | ||||
Net cash provided by financing activities | 2,808 | 826 | ||||
Effect of Exchange Rate Changes on Cash, Cash Equivalents, and | 31 | (224) | ||||
Net Increase (Decrease) in Cash, Cash Equivalents, and Restricted Cash | 2,679 | (3,184) | ||||
Cash, Cash Equivalents, and Restricted Cash at Beginning of Year | 4,941 | 8,125 | ||||
Cash, Cash Equivalents, and Restricted Cash at End of Year | $ | 7,620 | $ | 4,941 | ||
See Condensed Notes to Consolidated Financial Statements.
DEERE & COMPANY | |
Condensed Notes to Consolidated Financial Statements | |
(In millions of dollars) Unaudited | |
(1) | Special Items |
2023 | |
In the fourth quarter of 2023, the company sold its Russian roadbuilding business, recognizing a loss of $18 million (pretax and after-tax). The loss was recorded in "Other operating expenses" in the construction and forestry segment. | |
In the third quarter of 2023, a favorable tax ruling in Brazil allowed the company to record a $243 million reduction in the provision for income taxes and $47 million of interest income. | |
In the second quarter of 2023, the company corrected the accounting treatment for financing incentives offered to John Deere dealers, which impacted the timing of expense recognition and the presentation of incentive costs in the consolidated financial statements. The cumulative effect of this correction, $173 million pretax ($135 million after-tax), was recorded in the second quarter of 2023. Prior period results for Deere & Company were not restated, as the adjustment is considered immaterial to the company's financial statements. | |
2022 | |
In the second quarter of 2022, the company acquired full ownership of three former Deere-Hitachi joint venture factories. The remeasurement of the previously held equity investment resulted in a non-cash gain of $326 million (pretax and after-tax). | |
In the second quarter of 2022, the company suspended shipments of machines and service parts to Russia. As a result, the company impaired its long-lived assets, increased reserves of certain financial assets, introduced an employee voluntary-separation program, and recorded an accrual for various contractual uncertainties. In the fourth quarter of 2022, the company increased its reserves for credit losses, reflecting further economic uncertainty in Russia. The financial services received an intercompany benefit from the equipment operations, which guarantees the financial services' investment in certain international markets, including Russia. | |
In the first quarter of 2022, the company had a one-time payment related to the ratification of the UAW collective bargaining agreement, totaling $90 million. | |
The following table summarizes the operating profit impact, in millions of dollars, of the special items recorded for the three months and fiscal years ended October 29, 2023 and October 30, 2022: | |
Three Months | Fiscal Years | ||||||||||||||||||||||||||||||
PPA | SAT | CF | FS | Total | PPA | SAT | CF | FS | Total | ||||||||||||||||||||||
2023 Expense: | |||||||||||||||||||||||||||||||
Russian roadbuilding sale – | $ | 18 | $ | 18 | $ | 18 | $ | 18 | |||||||||||||||||||||||
Financing incentive – SA&G | $ | 173 | 173 | ||||||||||||||||||||||||||||
Total expense | 18 | 18 | 18 | 173 | 191 | ||||||||||||||||||||||||||
2022 Expense (benefit): | |||||||||||||||||||||||||||||||
Gain on remeasurement of equity | (326) | (326) | |||||||||||||||||||||||||||||
Total Russia/Ukraine events | $ | 70 | $ | 8 | 50 | 128 | $ | 133 | $ | 11 | 110 | 1 | 255 | ||||||||||||||||||
UAW ratification bonus – | 53 | 9 | 28 | 90 | |||||||||||||||||||||||||||
Total expense (benefit) | 70 | 8 | 50 | 128 | 186 | 20 | (188) | 1 | 19 | ||||||||||||||||||||||
Period over period change | $ | (70) | $ | (8) | $ | (32) | $ | (110) | $ | (186) | $ | (20) | $ | 206 | $ | 172 | $ | 172 | |||||||||||||
(2) | The consolidated financial statements represent the consolidation of all Deere & Company's subsidiaries. The supplemental consolidating data is presented for informational purposes. Transactions between the Equipment Operations and Financial Services have been eliminated to arrive at the consolidated financial statements. In the supplemental consolidating data in Note 3 to the financial statements, the "Equipment Operations" represents the enterprise without "Financial Services", which include the company's production and precision agriculture operations, small agriculture and turf operations, and construction and forestry operations, and other corporate assets, liabilities, revenues, and expenses not reflected within "Financial Services." |
DEERE & COMPANY (3) SUPPLEMENTAL CONSOLIDATING DATA For the Three Months Ended October 29, 2023 and October 30, 2022 (In millions of dollars) Unaudited | |||||||||||||||||||||||||||
EQUIPMENT | FINANCIAL | ||||||||||||||||||||||||||
OPERATIONS | SERVICES | ELIMINATIONS | CONSOLIDATED | ||||||||||||||||||||||||
2023 | 2022 | 2023 | 2022 | 2023 | 2022 | 2023 | 2022 | ||||||||||||||||||||
Net Sales and Revenues | |||||||||||||||||||||||||||
Net sales | $ | 13,801 | $ | 14,351 | $ | 13,801 | $ | 14,351 | |||||||||||||||||||
Finance and interest income | 193 | 83 | $ | 1,445 | $ | 1,003 | $ | (281) | $ | (161) | 1,357 | 925 | 1 | ||||||||||||||
Other income | 218 | 233 | 121 | 231 | (85) | (204) | 254 | 260 | 2, 3 | ||||||||||||||||||
Total | 14,212 | 14,667 | 1,566 | 1,234 | (366) | (365) | 15,412 | 15,536 | |||||||||||||||||||
Costs and Expenses | |||||||||||||||||||||||||||
Cost of sales | 9,433 | 10,215 | (6) | (1) | 9,427 | 10,214 | 4 | ||||||||||||||||||||
Research and development expenses | 606 | 576 | 606 | 576 | |||||||||||||||||||||||
Selling, administrative and general expenses | 980 | 922 | 225 | 272 | (2) | (2) | 1,203 | 1,192 | 4 | ||||||||||||||||||
Interest expense | 114 | 93 | 757 | 306 | (90) | (51) | 781 | 348 | 1 | ||||||||||||||||||
Interest compensation to Financial Services | 191 | 110 | (191) | (110) | 1 | ||||||||||||||||||||||
Other operating expenses | 45 | 163 | 354 | 358 | (77) | (201) | 322 | 320 | 5, 6 | ||||||||||||||||||
Total | 11,369 | 12,079 | 1,336 | 936 | (366) | (365) | 12,339 | 12,650 | |||||||||||||||||||
Income before Income Taxes | 2,843 | 2,588 | 230 | 298 | 3,073 | 2,886 | |||||||||||||||||||||
Provision for income taxes | 665 | 576 | 42 | 67 | 707 | 643 | |||||||||||||||||||||
Income after Income Taxes | 2,178 | 2,012 | 188 | 231 | 2,366 | 2,243 | |||||||||||||||||||||
Equity in income of unconsolidated affiliates | 2 | 1 | 2 | 1 | |||||||||||||||||||||||
Net Income | 2,178 | 2,012 | 190 | 232 | 2,368 | 2,244 | |||||||||||||||||||||
Less: Net loss attributable to | (1) | (2) | (1) | (2) | |||||||||||||||||||||||
Net Income Attributable to Deere & Company | $ | 2,179 | $ | 2,014 | $ | 190 | $ | 232 | $ | 2,369 | $ | 2,246 | |||||||||||||||
1 | Elimination of intercompany interest income and expense. |
2 | Elimination of Equipment Operations' margin from inventory transferred to equipment on operating leases. |
3 | Elimination of Financial Services' income related to intercompany guarantees of investments in certain international markets and intercompany service revenues. |
4 | Elimination of intercompany service fees. |
5 | Elimination of Financial Services' lease depreciation expense related to inventory transferred to equipment on operating leases. |
6 | Elimination of Equipment Operations' expense related to intercompany guarantees of investments in certain international markets and intercompany service expenses. |
DEERE & COMPANY SUPPLEMENTAL CONSOLIDATING DATA (Continued) For the Years Ended October 29, 2023 and October 30, 2022 (In millions of dollars) Unaudited | |||||||||||||||||||||||||||
EQUIPMENT | FINANCIAL | ||||||||||||||||||||||||||
OPERATIONS | SERVICES | ELIMINATIONS | CONSOLIDATED | ||||||||||||||||||||||||
2023 | 2022 | 2023 | 2022 | 2023 | 2022 | 2023 | 2022 | ||||||||||||||||||||
Net Sales and Revenues | |||||||||||||||||||||||||||
Net sales | $ | 55,565 | $ | 47,917 | $ | 55,565 | $ | 47,917 | |||||||||||||||||||
Finance and interest income | 636 | 213 | $ | 5,055 | $ | 3,583 | $ | (1,008) | $ | (431) | 4,683 | 3,365 | 1 | ||||||||||||||
Other income | 858 | 1,261 | 499 | 502 | (354) | (468) | 1,003 | 1,295 | 2, 3 | ||||||||||||||||||
Total | 57,059 | 49,391 | 5,554 | 4,085 | (1,362) | (899) | 61,251 | 52,577 | |||||||||||||||||||
Costs and Expenses | |||||||||||||||||||||||||||
Cost of sales | 37,739 | 35,341 | (24) | (3) | 37,715 | 35,338 | 4 | ||||||||||||||||||||
Research and development expenses | 2,177 | 1,912 | 2,177 | 1,912 | |||||||||||||||||||||||
Selling, administrative and general expenses | 3,611 | 3,137 | 994 | 735 | (10) | (9) | 4,595 | 3,863 | 4 | ||||||||||||||||||
Interest expense | 411 | 390 | 2,362 | 799 | (320) | (127) | 2,453 | 1,062 | 1 | ||||||||||||||||||
Interest compensation to Financial Services | 687 | 299 | (687) | (299) | 1 | ||||||||||||||||||||||
Other operating expenses | 217 | 350 | 1,396 | 1,386 | (321) | (461) | 1,292 | 1,275 | 5, 6 | ||||||||||||||||||
Total | 44,842 | 41,429 | 4,752 | 2,920 | (1,362) | (899) | 48,232 | 43,450 | |||||||||||||||||||
Income before Income Taxes | 12,217 | 7,962 | 802 | 1,165 | 13,019 | 9,127 | |||||||||||||||||||||
Provision for income taxes | 2,685 | 1,718 | 186 | 289 | 2,871 | 2,007 | |||||||||||||||||||||
Income after Income Taxes | 9,532 | 6,244 | 616 | 876 | 10,148 | 7,120 | |||||||||||||||||||||
Equity in income of unconsolidated affiliates | 4 | 6 | 3 | 4 | 7 | 10 | |||||||||||||||||||||
Net Income | 9,536 | 6,250 | 619 | 880 | 10,155 | 7,130 | |||||||||||||||||||||
Less: Net loss attributable to | (11) | (1) | (11) | (1) | |||||||||||||||||||||||
Net Income Attributable to Deere & Company | $ | 9,547 | $ | 6,251 | $ | 619 | $ | 880 | $ | 10,166 | $ | 7,131 | |||||||||||||||
1 | Elimination of intercompany interest income and expense. |
2 | Elimination of Equipment Operations' margin from inventory transferred to equipment on operating leases. |
3 | Elimination of Financial Services' income related to intercompany guarantees of investments in certain international markets and intercompany service revenues. |
4 | Elimination of intercompany service fees. |
5 | Elimination of Financial Services' lease depreciation expense related to inventory transferred to equipment on operating leases. |
6 | Elimination of Equipment Operations' expense related to intercompany guarantees of investments in certain international markets and intercompany service expenses. |
DEERE & COMPANY SUPPLEMENTAL CONSOLIDATING DATA (Continued) CONDENSED BALANCE SHEETS As of October 29, 2023 and October 30, 2022 (In millions of dollars) Unaudited | ||||||||||||||||||||||||||
EQUIPMENT | FINANCIAL | |||||||||||||||||||||||||
OPERATIONS | SERVICES | ELIMINATIONS | CONSOLIDATED | |||||||||||||||||||||||
2023 | 2022 | 2023 | 2022 | 2023 | 2022 | 2023 | 2022 | |||||||||||||||||||
Assets | ||||||||||||||||||||||||||
Cash and cash equivalents | $ | 5,720 | $ | 3,767 | $ | 1,738 | $ | 1,007 | $ | 7,458 | $ | 4,774 | ||||||||||||||
Marketable securities | 104 | 61 | 842 | 673 | 946 | 734 | ||||||||||||||||||||
Receivables from Financial Services | 4,516 | 6,569 | $ | (4,516) | $ | (6,569) | 7 | |||||||||||||||||||
Trade accounts and notes | 1,320 | 1,273 | 8,687 | 6,434 | (2,268) | (1,297) | 7,739 | 6,410 | 8 | |||||||||||||||||
Financing receivables – net | 64 | 47 | 43,609 | 36,587 | 43,673 | 36,634 | ||||||||||||||||||||
Financing receivables securitized – net | 7,335 | 5,936 | 7,335 | 5,936 | ||||||||||||||||||||||
Other receivables | 1,813 | 1,670 | 869 | 832 | (59) | (10) | 2,623 | 2,492 | 8 | |||||||||||||||||
Equipment on operating leases – net | 6,917 | 6,623 | 6,917 | 6,623 | ||||||||||||||||||||||
Inventories | 8,160 | 8,495 | 8,160 | 8,495 | ||||||||||||||||||||||
Property and equipment – net | 6,843 | 6,021 | 36 | 35 | 6,879 | 6,056 | ||||||||||||||||||||
Goodwill | 3,900 | 3,687 | 3,900 | 3,687 | ||||||||||||||||||||||
Other intangible assets – net | 1,133 | 1,218 | 1,133 | 1,218 | ||||||||||||||||||||||
Retirement benefits | 2,936 | 3,666 | 72 | 66 | (1) | (2) | 3,007 | 3,730 | 9 | |||||||||||||||||
Deferred income taxes | 2,133 | 940 | 68 | 45 | (387) | (161) | 1,814 | 824 | 10 | |||||||||||||||||
Other assets | 1,948 | 1,794 | 559 | 626 | (4) | (3) | 2,503 | 2,417 | ||||||||||||||||||
Total Assets | $ | 40,590 | $ | 39,208 | $ | 70,732 | $ | 58,864 | $ | (7,235) | $ | (8,042) | $ | 104,087 | $ | 90,030 | ||||||||||
Liabilities and Stockholders' Equity | ||||||||||||||||||||||||||
Liabilities | ||||||||||||||||||||||||||
Short-term borrowings | $ | 1,230 | $ | 1,040 | $ | 16,709 | $ | 11,552 | $ | 17,939 | $ | 12,592 | ||||||||||||||
Short-term securitization borrowings | 6,995 | 5,711 | 6,995 | 5,711 | ||||||||||||||||||||||
Payables to Equipment Operations | 4,516 | 6,569 | $ | (4,516) | $ | (6,569) | 7 | |||||||||||||||||||
Accounts payable and | 14,862 | 12,962 | 3,599 | 3,170 | (2,331) | (1,310) | 16,130 | 14,822 | 8 | |||||||||||||||||
Deferred income taxes | 452 | 380 | 455 | 276 | (387) | (161) | 520 | 495 | 10 | |||||||||||||||||
Long-term borrowings | 7,210 | 7,917 | 31,267 | 25,679 | 38,477 | 33,596 | ||||||||||||||||||||
Retirement benefits and other liabilities | 2,032 | 2,351 | 109 | 108 | (1) | (2) | 2,140 | 2,457 | 9 | |||||||||||||||||
Total liabilities | 25,786 | 24,650 | 63,650 | 53,065 | (7,235) | (8,042) | 82,201 | 69,673 | ||||||||||||||||||
Redeemable noncontrolling interest | 97 | 92 | 97 | 92 | ||||||||||||||||||||||
Stockholders' Equity | ||||||||||||||||||||||||||
Total Deere & Company | 21,785 | 20,262 | 7,082 | 5,799 | (7,082) | (5,799) | 21,785 | 20,262 | 11 | |||||||||||||||||
Noncontrolling interests | 4 | 3 | 4 | 3 | ||||||||||||||||||||||
Financial Services equity | (7,082) | (5,799) | 7,082 | 5,799 | 11 | |||||||||||||||||||||
Adjusted total stockholders' equity | 14,707 | 14,466 | 7,082 | 5,799 | 21,789 | 20,265 | ||||||||||||||||||||
Total Liabilities and | $ | 40,590 | $ | 39,208 | $ | 70,732 | $ | 58,864 | $ | (7,235) | $ | (8,042) | $ | 104,087 | $ | 90,030 | ||||||||||
7 | Elimination of receivables / payables between Equipment Operations and Financial Services. |
8 | Primarily reclassification of sales incentive accruals on receivables sold to Financial Services. |
9 | Reclassification of net pension assets / liabilities. |
10 | Reclassification of deferred tax assets / liabilities in the same taxing jurisdictions. |
11 | Elimination of Financial Services' equity. |
DEERE & COMPANY SUPPLEMENTAL CONSOLIDATING DATA (Continued) STATEMENTS OF CASH FLOWS For the Years Ended October 29, 2023 and October 30, 2022 (In millions of dollars) Unaudited | |||||||||||||||||||||||||||
EQUIPMENT | FINANCIAL | ||||||||||||||||||||||||||
OPERATIONS | SERVICES | ELIMINATIONS | CONSOLIDATED | ||||||||||||||||||||||||
2023 | 2022 | 2023 | 2022 | 2023 | 2022 | 2023 | 2022 | ||||||||||||||||||||
Cash Flows from Operating Activities | |||||||||||||||||||||||||||
Net income | $ | 9,536 | $ | 6,250 | $ | 619 | $ | 880 | $ | 10,155 | $ | 7,130 | |||||||||||||||
Adjustments to reconcile net income to net cash provided | |||||||||||||||||||||||||||
Provision (credit) for credit losses | 7 | 3 | (23) | 189 | (16) | 192 | |||||||||||||||||||||
Provision (credit) for depreciation and amortization | 1,123 | 1,041 | 1,016 | 1,050 | $ | (135) | $ | (196) | 2,004 | 1,895 | 12 | ||||||||||||||||
Impairments and other adjustments | 18 | 88 | 173 | 191 | 88 | ||||||||||||||||||||||
Share-based compensation expense | 130 | 85 | 130 | 85 | 13 | ||||||||||||||||||||||
Gain on remeasurement of previously held equity | (326) | (326) | |||||||||||||||||||||||||
Distributed earnings of Financial Services | 215 | 444 | (215) | (444) | 14 | ||||||||||||||||||||||
Provision (credit) for deferred income taxes | (959) | 8 | 169 | (74) | (790) | (66) | |||||||||||||||||||||
Changes in assets and liabilities: | |||||||||||||||||||||||||||
Receivables related to sales | (58) | (189) | (4,195) | (2,294) | (4,253) | (2,483) | 15, 17, 18 | ||||||||||||||||||||
Inventories | 474 | (1,924) | (195) | (167) | 279 | (2,091) | 16 | ||||||||||||||||||||
Accounts payable and accrued expenses | 1,352 | 1,444 | 449 | 143 | (971) | (454) | 830 | 1,133 | 17 | ||||||||||||||||||
Accrued income taxes payable/receivable | 8 | 166 | (31) | (25) | (23) | 141 | |||||||||||||||||||||
Retirement benefits | (164) | (1,016) | (6) | 1 | (170) | (1,015) | |||||||||||||||||||||
Other | 367 | 250 | (51) | (287) | (64) | 53 | 252 | 16 | 12, 13, 16 | ||||||||||||||||||
Net cash provided by operating activities | 11,919 | 6,239 | 2,315 | 1,877 | (5,645) | (3,417) | 8,589 | 4,699 | |||||||||||||||||||
Cash Flows from Investing Activities | |||||||||||||||||||||||||||
Collections of receivables (excluding receivables related | 24,128 | 22,400 | (1,077) | (1,493) | 23,051 | 20,907 | 15 | ||||||||||||||||||||
Proceeds from sales of equipment on operating leases | 1,981 | 2,093 | 1,981 | 2,093 | |||||||||||||||||||||||
Cost of receivables acquired (excluding receivables related | (29,229) | (26,903) | 457 | 603 | (28,772) | (26,300) | 15 | ||||||||||||||||||||
Acquisitions of businesses, net of cash acquired | (82) | (498) | (82) | (498) | |||||||||||||||||||||||
Purchases of property and equipment | (1,494) | (1,131) | (4) | (3) | (1,498) | (1,134) | |||||||||||||||||||||
Cost of equipment on operating leases acquired | (3,234) | (2,879) | 264 | 225 | (2,970) | (2,654) | 16 | ||||||||||||||||||||
Increase (decrease) in investment in Financial Services | (870) | 7 | 870 | (7) | 19 | ||||||||||||||||||||||
Increase in trade and wholesale receivables | (5,783) | (3,601) | 5,783 | 3,601 | 15 | ||||||||||||||||||||||
Collateral on derivatives – net | (1) | 5 | (11) | (647) | (12) | (642) | |||||||||||||||||||||
Other | (290) | (213) | (160) | (81) | 3 | 37 | (447) | (257) | 18 | ||||||||||||||||||
Net cash used for investing activities | (2,737) | (1,830) | (12,312) | (9,621) | 6,300 | 2,966 | (8,749) | (8,485) | |||||||||||||||||||
Cash Flows from Financing Activities | |||||||||||||||||||||||||||
Net proceeds (payments) in short-term borrowings (original | (113) | 136 | 4,121 | 3,716 | 4,008 | 3,852 | |||||||||||||||||||||
Change in intercompany receivables/payables | 2,090 | (1,633) | (2,090) | 1,633 | |||||||||||||||||||||||
Proceeds from borrowings issued (original maturities | 342 | 138 | 15,087 | 10,220 | 15,429 | 10,358 | |||||||||||||||||||||
Payments of borrowings (original maturities greater than | (901) | (1,356) | (7,012) | (7,089) | (7,913) | (8,445) | |||||||||||||||||||||
Repurchases of common stock | (7,216) | (3,597) | (7,216) | (3,597) | |||||||||||||||||||||||
Capital investment from Equipment Operations | 870 | (7) | (870) | 7 | 19 | ||||||||||||||||||||||
Dividends paid | (1,427) | (1,313) | (215) | (444) | 215 | 444 | (1,427) | (1,313) | 14 | ||||||||||||||||||
Other | (7) | 6 | (66) | (35) | (73) | (29) | |||||||||||||||||||||
Net cash provided by (used for) financing activities | (7,232) | (7,619) | 10,695 | 7,994 | (655) | 451 | 2,808 | 826 | |||||||||||||||||||
Effect of Exchange Rate Changes on Cash, Cash | 24 | (209) | 7 | (15) | 31 | (224) | |||||||||||||||||||||
Net Increase (Decrease) in Cash, Cash Equivalents, and | 1,974 | (3,419) | 705 | 235 | 2,679 | (3,184) | |||||||||||||||||||||
Cash, Cash Equivalents, and Restricted Cash at | 3,781 | 7,200 | 1,160 | 925 | 4,941 | 8,125 | |||||||||||||||||||||
Cash, Cash Equivalents, and Restricted Cash at | $ | 5,755 | $ | 3,781 | $ | 1,865 | $ | 1,160 | $ | 7,620 | $ | 4,941 | |||||||||||||||
12 | Elimination of depreciation on leases related to inventory transferred to equipment on operating leases. |
13 | Reclassification of share-based compensation expense. |
14 | Elimination of dividends from Financial Services to the Equipment Operations, which are included in the Equipment Operations operating activities. |
15 | Primarily reclassification of receivables related to the sale of equipment. |
16 | Reclassification of direct lease agreements with retail customers. |
17 | Reclassification of sales incentive accruals on receivables sold to Financial Services. |
18 | Elimination and reclassification of the effects of Financial Services partial financing of the construction and forestry retail locations sales and subsequent collection of those amounts. |
19 | Elimination of investment from Equipment Operations to Financial Services. |
DEERE & COMPANY
OTHER FINANCIAL INFORMATION
The company evaluates its business results on the basis of accounting principles generally accepted in the United States. In addition, it uses a metric referred to as Shareholder Value Added (SVA), which management believes is an appropriate measure for the performance of its businesses. SVA is, in effect, the pretax profit left over after subtracting the cost of enterprise capital. The company is aiming for a sustained creation of SVA and is using this metric for various performance goals. Certain compensation is also determined on the basis of performance using this measure. For purposes of determining SVA, each of the equipment segments is assessed a pretax cost of assets, which on an annual basis is approximately 12 percent of the segment's average identifiable operating assets during the applicable period with inventory at standard cost. Management believes that valuing inventories at standard cost more closely approximates the current cost of inventory and the company's investment in the asset. The Financial Services segment is assessed an annual pretax cost of approximately 13 percent of the segment's average equity. The cost of assets or equity, as applicable, is deducted from the operating profit or added to the operating loss of each segment to determine the amount of SVA.
Equipment | Production & | Small Ag | Construction | |||||||||||||||||||||||
For the Years Ended | Operations | Precision Ag | & Turf | & Forestry | ||||||||||||||||||||||
Oct 29 | Oct 30 | Oct 29 | Oct 30 | Oct 29 | Oct 30 | Oct 29 | Oct 30 | |||||||||||||||||||
Dollars in Millions | 2023 | 2022 | 2023 | 2022 | 2023 | 2022 | 2023 | 2022 | ||||||||||||||||||
Net Sales | $ | 55,565 | $ | 47,917 | $ | 26,790 | $ | 22,002 | $ | 13,980 | $ | 13,381 | $ | 14,795 | $ | 12,534 | ||||||||||
Average Identifiable Assets | ||||||||||||||||||||||||||
With Inventories as Reported | $ | 21,114 | $ | 19,420 | $ | 9,256 | $ | 8,336 | $ | 4,601 | $ | 4,349 | $ | 7,257 | $ | 6,735 | ||||||||||
With Inventories at Standard Cost | 23,186 | 20,983 | 10,343 | 9,118 | 5,149 | 4,795 | 7,694 | 7,070 | ||||||||||||||||||
Operating Profit | $ | 12,163 | $ | 8,349 | $ | 6,996 | $ | 4,386 | $ | 2,472 | $ | 1,949 | $ | 2,695 | $ | 2,014 | ||||||||||
Percent of Net Sales | 21.9 | % | 17.4 | % | 26.1 | % | 19.9 | % | 17.7 | % | 14.6 | % | 18.2 | % | 16.1 | % | ||||||||||
Operating Return on Assets | ||||||||||||||||||||||||||
With Inventories as Reported | 57.6 | % | 43.0 | % | 75.6 | % | 52.6 | % | 53.7 | % | 44.8 | % | 37.1 | % | 29.9 | % | ||||||||||
With Inventories at Standard Cost | 52.5 | % | 39.8 | % | 67.6 | % | 48.1 | % | 48.0 | % | 40.6 | % | 35.0 | % | 28.5 | % | ||||||||||
SVA Cost of Assets | $ | (2,782) | $ | (2,519) | $ | (1,241) | $ | (1,094) | $ | (618) | $ | (576) | $ | (923) | $ | (849) | ||||||||||
SVA | 9,381 | 5,830 | 5,755 | 3,292 | 1,854 | 1,373 | 1,772 | 1,165 | ||||||||||||||||||
Financial | ||||||||||||||||||||||||||
For the Years Ended | Services | |||||||||||||||||||||||||
Oct 29 | Oct 30 | |||||||||||||||||||||||||
Dollars in Millions | 2023 | 2022 | ||||||||||||||||||||||||
Net Income Attributable to Deere & Company | $ | 619 | $ | 880 | ||||||||||||||||||||||
Average Equity | 6,588 | 5,725 | ||||||||||||||||||||||||
Return on Equity | 9.4 | % | 15.4 | % | ||||||||||||||||||||||
Operating Profit | $ | 795 | $ | 1,159 | ||||||||||||||||||||||
Cost of Equity | (858) | (760) | ||||||||||||||||||||||||
SVA | (63) | 399 | ||||||||||||||||||||||||
![]() View original content to download multimedia:https://www.prnewswire.com/news-releases/deere-reports-net-income-of-2-369-billion-for-fourth-quarter-10-166-billion-for-fiscal-year-301995571.html
View original content to download multimedia:https://www.prnewswire.com/news-releases/deere-reports-net-income-of-2-369-billion-for-fourth-quarter-10-166-billion-for-fiscal-year-301995571.html
SOURCE John Deere Company