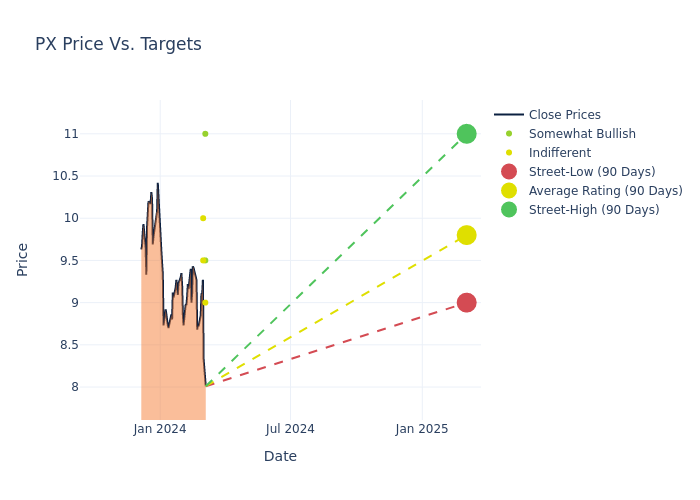
In the latest quarter, 6 analysts provided ratings for P10 (NYSE:PX), showcasing a mix of bullish and bearish perspectives.
The table below summarizes their recent ratings, showcasing the evolving sentiments within the past 30 days and comparing them to the preceding months.
| Bullish | Somewhat Bullish | Indifferent | Somewhat Bearish | Bearish | |
|---|---|---|---|---|---|
| Total Ratings | 0 | 3 | 3 | 0 | 0 |
| Last 30D | 0 | 2 | 1 | 0 | 0 |
| 1M Ago | 0 | 0 | 2 | 0 | 0 |
| 2M Ago | 0 | 1 | 0 | 0 | 0 |
| 3M Ago | 0 | 0 | 0 | 0 | 0 |
The 12-month price targets assessed by analysts reveal further insights, featuring an average target of $10.17, a high estimate of $12.00, and a low estimate of $9.00. This current average represents a 26.94% decrease from the previous average price target of $13.92.

Breaking Down Analyst Ratings: A Detailed Examination
The perception of P10 by financial experts is analyzed through recent analyst actions. The following summary presents key analysts, their recent evaluations, and adjustments to ratings and price targets.
| Analyst | Analyst Firm | Action Taken | Rating | Current Price Target | Prior Price Target |
|---|---|---|---|---|---|
| Chris Kotowski | Oppenheimer | Lowers | Outperform | $11.00 | $17.00 |
| Benjamin Budish | Barclays | Lowers | Overweight | $9.50 | $14.00 |
| Michael Cyprys | Morgan Stanley | Lowers | Equal-Weight | $9.00 | $12.00 |
| Michael Brown | Keefe, Bruyette & Woods | Lowers | Market Perform | $10.00 | $12.00 |
| Ken Worthington | JP Morgan | Lowers | Neutral | $9.50 | $15.50 |
| Michael Cyprys | Morgan Stanley | Lowers | Overweight | $12.00 | $13.00 |
Key Insights:
- Action Taken: Analysts adapt their recommendations to changing market conditions and company performance. Whether they 'Maintain', 'Raise' or 'Lower' their stance, it reflects their response to recent developments related to P10. This information provides a snapshot of how analysts perceive the current state of the company.
- Rating: Unveiling insights, analysts deliver qualitative insights into stock performance, from 'Outperform' to 'Underperform'. These ratings convey expectations for the relative performance of P10 compared to the broader market.
- Price Targets: Analysts set price targets as an estimate of a stock's future value. Comparing the current and prior price targets provides insight into how analysts' expectations have changed over time. This information can be valuable for investors seeking to understand consensus views on the stock's potential future performance.
Analyzing these analyst evaluations alongside relevant financial metrics can provide a comprehensive view of P10's market position. Stay informed and make data-driven decisions with the assistance of our Ratings Table.
Stay up to date on P10 analyst ratings.
If you are interested in following small-cap stock news and performance you can start by tracking it here.
Get to Know P10 Better
P10 Inc is a multi-asset class private market solutions provider in the alternative asset management industry. Its revenue is composed of recurring management and advisory fees, with the vast majority of fees earned on committed capital.
P10: Financial Performance Dissected
Market Capitalization Perspectives: The company's market capitalization falls below industry averages, signaling a relatively smaller size compared to peers. This positioning may be influenced by factors such as perceived growth potential or operational scale.
Revenue Growth: P10 displayed positive results in 3 months. As of 30 September, 2023, the company achieved a solid revenue growth rate of approximately 17.89%. This indicates a notable increase in the company's top-line earnings. When compared to others in the Financials sector, the company faces challenges, achieving a growth rate lower than the average among peers.
Net Margin: P10's net margin falls below industry averages, indicating challenges in achieving strong profitability. With a net margin of -14.28%, the company may face hurdles in effective cost management.
Return on Equity (ROE): P10's ROE falls below industry averages, indicating challenges in efficiently using equity capital. With an ROE of -2.15%, the company may face hurdles in generating optimal returns for shareholders.
Return on Assets (ROA): P10's ROA falls below industry averages, indicating challenges in efficiently utilizing assets. With an ROA of -1.03%, the company may face hurdles in generating optimal returns from its assets.
Debt Management: P10's debt-to-equity ratio is below the industry average at 0.73, reflecting a lower dependency on debt financing and a more conservative financial approach.
The Basics of Analyst Ratings
Analyst ratings serve as essential indicators of stock performance, provided by experts in banking and financial systems. These specialists diligently analyze company financial statements, participate in conference calls, and engage with insiders to generate quarterly ratings for individual stocks.
Some analysts publish their predictions for metrics such as growth estimates, earnings, and revenue to provide additional guidance with their ratings. When using analyst ratings, it is important to keep in mind that stock and sector analysts are also human and are only offering their opinions to investors.
If you want to keep track of which analysts are outperforming others, you can view updated analyst ratings along withanalyst success scores in Benzinga Pro.
This article was generated by Benzinga's automated content engine and reviewed by an editor.
