Informatica Reports Fourth Quarter and Full-Year 2023 Financial Results
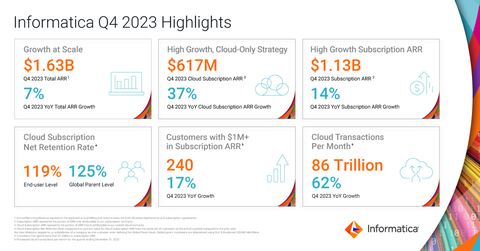
- Cloud Subscription Annual Recurring Revenue (ARR) in the fourth quarter and full-year 2023 increased 37% year-over-year to $617 million
- Subscription ARR in the fourth quarter and full-year 2023 increased 14% year-over-year to $1.13 billion
- Total ARR in the fourth quarter and full-year 2023 increased 7% year-over-year to $1.63 billion
- GAAP Total Revenues in the fourth quarter 2023 increased 12% year-over-year to $445 million and in the full-year 2023 increased 6% year-over-year to $1.60 billion
- Exceeds high end of guidance across all fourth quarter and full-year 2023 metrics
Informatica (NYSE:INFA), an enterprise cloud data management leader, today announced financial results for its fourth quarter and full-year 2023, ended December 31, 2023.
This press release features multimedia. View the full release here: https://www.businesswire.com/news/home/20240214165029/en/
Source: Informatica
"Informatica closed an outstanding fiscal 2023. Once again, we outperformed all growth and profitability guidance metrics, showcasing Informatica's relentless focus on executing a cloud-only, consumption-driven strategy. We delivered cloud subscription ARR growth of 37% year-over-year, $500 million in cloud subscription revenue, and surpassed $1 billion in subscription revenues," said Amit Walia, Chief Executive Officer of Informatica. "Our momentum is driven by demand for our AI-powered IDMC platform and category leadership in data management as a mission-critical component of the modern data stack. We are committed to delivering the best data management products on the industry's only AI-powered data platform, solving complex workloads that are multi-cloud, multi-vendor, and hybrid while delivering significant value to our customers."
Fourth Quarter 2023 Financial Highlights:
- GAAP Total Revenues increased 12% year-over-year to $445.2 million. Fourth quarter total revenues included a positive impact of approximately $6.8 million from foreign currency exchange rates (FX) year-over-year. Adjusted for FX, total revenues increased 10% year-over-year.
- GAAP Subscription Revenues increased 26% year-over-year to $300.1 million. GAAP Cloud Subscription Revenue increased 39% year-over-year to $140.3 million and represented 47% of subscription revenues.
- Total ARR increased 7% year-over-year to $1.63 billion. Fourth quarter total ARR included a negative impact of approximately $0.4 million from FX year-over-year.
- Subscription ARR increased 14% year-over-year to $1.13 billion. Fourth quarter subscription ARR included a negative impact of approximately $1.4 million from FX year-over-year.
- Cloud Subscription ARR increased 37% year-over-year to $616.8 million. Fourth quarter cloud subscription ARR included a negative impact of approximately $0.8 million from FX year-over-year.
- GAAP Operating Income of $36.8 million and Non-GAAP Operating Income of $161.9 million.
- GAAP Operating Cash Flow of $101.0 million.
- Adjusted Unlevered Free Cash Flow (after-tax) of $154.8 million. Cash paid for interest of $38.3 million.
Full-Year 2023 Financial Highlights:
- GAAP Total Revenues increased 6% year-over-year to $1.60 billion. Full-year total revenues included a positive impact of approximately $2.6 million from FX year-over-year.
- GAAP Subscription Revenues increased 17% year-over-year to $1.0 billion. GAAP Cloud Subscription Revenue increased 39% year-over-year to $499.9 million and represented 50% of subscription revenues.
- Total ARR increased 7% year-over-year to $1.63 billion. Full-year total ARR included a negative impact of approximately $7.0 million from FX year-over-year.
- Subscription ARR increased 14% year-over-year to $1.13 billion. Full-year subscription ARR included a negative impact of approximately $5.6 million from FX year-over-year.
- Cloud Subscription ARR increased 37% year-over-year to $616.8 million. Full-year cloud subscription ARR included a negative impact of approximately $2.3 million from FX year-over-year.
- GAAP Operating Income of $33.6 million and Non-GAAP Operating Income of $462.3 million.
- GAAP Operating Cash Flow of $266.3 million.
- Adjusted Unlevered Free Cash Flow (after-tax) of $451.2 million. Cash paid for interest of $147.3 million.
A reconciliation of GAAP to non-GAAP financial measures has been provided in the tables included in this press release. An explanation of these measures is also included below under the heading "Non-GAAP Financial Measures."
Fourth Quarter 2023 Business Highlights:
- Processed 86.0 trillion cloud transactions per month for the quarter ended December 31, 2023, as compared to 53.0 trillion cloud transactions per month in the same quarter last year, an increase of 62% year-over-year.
- Reported 240 customers that spend more than $1 million in subscription ARR at the end of December 31, 2023, an increase of 17% year-over-year.
- Reported 1,988 customers that spend more than $100,000 in subscription ARR at the end of December 31, 2023, an increase of 4% year-over-year.
- Achieved a Cloud Subscription Net Retention Rate (NRR) of 119% at the end-user level and 125% at the global parent level as of December 31, 2023.
Product Innovation:
- Expanded partnership with Microsoft: announced Informatica's Intelligent Data Management Cloud (IDMC) capabilities will be directly embedded as a native application within Microsoft Fabric for data profiling, quality, observability, and integration in the first half of 2024; launched Azure Point of Delivery (POD) in Canada to scale our market reach; showcased integrations and solutions with Microsoft Azure Open AI to enable enterprise Gen AI use cases with a trusted data foundation from IDMC; and built high-scale, high-performance IDMC connectors for Fabric OneLake, Lakehouse and DataWarehouse to serve customers' analytics use cases.
- Expanded partnership with Amazon Web Services (AWS): announced IDMC support for Amazon Bedrock customers to improve the accuracy of key generative AI use cases; earned AWS certification for IDMC integrations with AWS HealthLake, a HIPAA-eligible service that provides Fast Healthcare Interoperability Resource (FHIR) Application Programming Interfaces (APIs) to help healthcare and life sciences companies securely store, transform, transact and analyze health data; and named a launch Partner for Amazon S3 Access Grants, delivering scalable permission management for S3 data lakes with Informatica's Cloud Data Marketplace.
- Expanded partnership with Snowflake: announced availability of Superpipe for Snowflake integrating complex ERP and CRM data into Snowflake up to 3.5X faster than previous approaches; and announced the public preview of our first Snowflake native application, the Enterprise Data Integrator, enabling users to use Superpipe seamlessly from within the Snowflake product experience.
- Expanded partnership with Databricks: announced Databricks-verified Unity catalog support for Cloud Data Integration and Cloud Data Integration Free services.
- Launched a new strategic partnership with MongoDB to deliver modern, cloud-native, trusted, data-driven applications across financial services, insurance and healthcare verticals to combine the benefits of MongoDB Atlas with Informatica's Master Data Management (MDM) SaaS solution.
Industry Recognition:
- Recognized as a Leader in the 2023 Gartner® Magic Quadrant™ for Data Integration Tools report. This marks our 18th consecutive time of being named a Leader, where Informatica is once again positioned highest on the ability to execute axis and furthest on the completeness of vision axis.
- Recognized as a Leader rating in the inaugural Forrester Wave™ Cloud Data Pipelines, Q4 2023 report.
- Recognized as a Leader rating in The Forrester Wave™ Production Information Management, Q4 2023.
- Received "Strong" rating by Gartner in the Product/Service and Technology/Methodology categories in the 2023 Gartner® Vendor Rating report.
- Recognized as a Champion in the Bloor Research Master Data Governance 2023 report.
- Recognized as a Leader and Outperformer in GigaOM Radar for Data Security Platforms report.
November 2023 Restructuring Plan:
- In conjunction with the previously announced November 2023 restructuring plan (the "November Plan"), the Company recorded restructuring charges of $31.6 million in the fourth quarter 2023. The November Plan is intended to further streamline the Company's cost structure as a direct result of its cloud-only, consumption-driven ("CoCd") strategy announced in January 2023.
- The Company expects to record approximately $3.0 million to $5.0 million of additional restructuring charges in the first quarter 2024.
Upcoming Events:
- On February 27, 2024, the Company is scheduled to host investor meetings at the Wolfe Research Software Conference in New York.
- On March 4, 2024, the Company is scheduled to participate in a fireside chat discussion at the Morgan Stanley Technology, Media & Telecom Conference in San Francisco at 2:10 p.m. Pacific Time. A live webcast and replay will be available on the Company's Investor Relations website.
First Quarter and Full-Year 2024 Financial Outlook
The Company provides the financial guidance below based on current market conditions and expectations and it is subject to various important cautionary factors described below. Guidance includes the impact from macroeconomic conditions and expected foreign exchange headwinds versus the prior year comparable periods.
Based on information available as of February 14, 2024, guidance for the first quarter 2024 is as follows:
First Quarter 2024 Ending March 31, 2024:
- GAAP Total Revenues are expected to be in the range of $375 million to $395 million, representing approximately 5.4% year-over-year growth at the midpoint of the range.
- Subscription ARR is expected to be in the range of $1.135 billion to $1.155 billion, representing approximately 12.2% year-over-year growth at the midpoint of the range.
- Cloud Subscription ARR is expected to be in the range of $645 million to $655 million, representing approximately 34.5% year-over-year growth at the midpoint of the range.
- Non-GAAP Operating Income is expected to be in the range of $97 million to $117 million, representing approximately 26.2% year-over-year growth at the midpoint of the range.
Based on information available as of February 14, 2024, guidance for the full-year 2024 is as follows:
Full-Year 2024 Ending December 31, 2024:
- GAAP Total Revenues are expected to be in the range of $1.685 billion to $1.705 billion, representing approximately 6.3% year-over-year growth at the midpoint of the range.
- Total ARR is expected to be in the range of $1.718 billion to $1.772 billion, representing approximately 7.3% year-over-year growth at the midpoint of the range.
- Subscription ARR is expected to be in the range of $1.261 billion to $1.295 billion, representing approximately 12.8% year-over-year growth at the midpoint of the range.
- Cloud Subscription ARR is expected to be in the range of $826 million to $840 million, representing approximately 35.1% year-over-year growth at the midpoint of the range.
- Non-GAAP Operating Income is expected to be in the range of $533 million to $553 million, representing approximately 17.5% year-over-year growth at the midpoint of the range.
- Adjusted Unlevered Free Cash Flow (after-tax) is expected to be in the range of $535 million to $555 million, representing approximately 20.8% year-over-year growth at the midpoint of the range.
The Company is assuming constant FX rates for the year based on the rates at the start of the planning period. For reference purposes, the assumed FX rates for our top four currencies in full-year 2024 are as follows:
Currency |
|
Planned Rate |
EUR/$ |
|
1.10 |
GBP/$ |
|
1.27 |
$/CAD |
|
1.32 |
$/JPY |
|
141 |
Using the foreign exchange rate assumptions noted above, the Company has incorporated the following FX impact into 2024 guidance:
|
Q1 2024 |
|
Full-Year 2024 |
Total Revenues |
~$2.5m positive impact y/y |
|
~$6.0m positive impact y/y |
Total ARR |
~$1.0m negative impact y/y |
|
~$1.0m positive impact y/y |
Subscription ARR |
~$1.0m negative impact y/y |
|
- |
Cloud Subscription ARR |
~$1.0m negative impact y/y |
|
~$1.0m negative impact y/y |
In addition to the above guidance, the Company is also providing first quarter and full-year 2024 cash paid for interest estimates for modeling purposes. For the first quarter 2024, we estimate cash paid for interest to be approximately $39 million. For the full-year 2024, we estimate cash paid for interest to be approximately $144 million, using forward rates based on a 1-month SOFR (Secured Overnight Financing Rate).
In addition to the above guidance, the Company is also providing a first quarter and full-year 2024 weighted-average number of basic and diluted share estimates for modeling purposes. For the first quarter 2024, we expect basic weighted-average shares outstanding to be approximately 297 million shares and diluted weighted-average shares outstanding to be approximately 310 million shares. For the full-year 2024, we expect basic weighted-average shares outstanding to be approximately 302 million shares and diluted weighted-average shares outstanding to be approximately 315 million shares.
Reconciliation of Non-GAAP Operating Income and Adjusted Unlevered Free Cash Flow after-tax guidance to the most directly comparable GAAP measures is not available without unreasonable effort, as certain items cannot be reasonably predicted because of their high variability, complexity, and low visibility. In particular, the measures and effects of our stock-based compensation expense specific to our equity compensation awards and employer payroll tax-related items on employee stock transactions are directly impacted by the timing of employee stock transactions and unpredictable fluctuations in our stock price, which we expect to have a significant impact on our future GAAP financial results.
Webcast and Conference Call
A conference call to discuss Informatica's fourth quarter and full-year 2023 financial results and financial outlook for the first quarter and full-year 2024 is scheduled for 2:00 p.m. Pacific Time today. To participate, please dial 1-833-470-1428 from the U.S. or 1-404-975-4839 from international locations. The conference passcode is 148703. A live webcast of the conference call will be available on the Investor Relations section of Informatica's website at investors.informatica.com where presentation materials will also be posted prior to the conference call. A replay will be available online approximately two hours following the live call for a period of 30 days.
Forward-Looking Statements
This press release and the related conference call and webcast contain forward-looking statements within the meaning of Section 27A of the Securities Act of 1933, as amended, and Section 21E of the Securities Exchange Act of 1934, as amended. These statements may relate to, but are not limited to, expectations of future operating results or financial performance, including our GAAP and non-GAAP guidance for the first quarter and 2024 fiscal year, the effect of foreign currency exchange rates, the effect of macroeconomic conditions, management's plans, priorities, initiatives, and strategies, our efforts to reduce operating expenses and adjust cash flows in light of current business needs and priorities, our expected costs related to restructuring and related charges, including the timing of such charges, the impact of the restructuring and related charges on our business, results of operations and financial condition, plans regarding our stock repurchase authorization, management's estimates and expectations regarding growth of our business, the potential benefits realized by customers by the use of artificial intelligence and machine learning in our products and the potential benefits realized by customers from our cloud modernization programs, market, and partnerships. Forward-looking statements are inherently subject to risks and uncertainties, some of which cannot be predicted or quantified. In some cases, you can identify forward-looking statements because they contain words such as "anticipate," "believe," "contemplate," "continue," "could," "estimate," "expect," "intend," "may," "plan," "potential," "predict," "project," "should," "target," "toward," "will," or "would," or the negative of these words or other similar terms or expressions. You should not put undue reliance on any forward-looking statements. Forward-looking statements should not be read as a guarantee of future performance or results and will not necessarily be accurate indications of the times at, or by, which such performance or results will be achieved, if at all.
Forward-looking statements are based on information available at the time those statements are made and are based on current expectations, estimates, forecasts, and projections as well as the beliefs and assumptions of management as of that time with respect to future events. These statements are subject to risks and uncertainties, many of which involve factors or circumstances that are beyond our control, that could cause actual performance or results to differ materially from those expressed in or suggested by the forward-looking statements. In light of these risks and uncertainties, the forward-looking events and circumstances discussed in this press release may not occur and actual results could differ materially from those anticipated or implied in the forward-looking statements. These risks, uncertainties, assumptions, and other factors include, but are not limited to, those related to our business and financial performance, the effects of adverse global macroeconomic conditions and geopolitical uncertainty, the effects of public health crises on our business, results of operations, and financial condition, our ability to attract and retain customers, our ability to develop new products and services and enhance existing products and services, our ability to respond rapidly to emerging technology trends, our ability to execute on our business strategy, including our strategy related to the Informatica IDMC platform and key partnerships, our ability to increase and predict customer consumption of our platform, our ability to compete effectively, and our ability to manage growth.
Further information on these and additional risks, uncertainties, and other factors that could cause actual outcomes and results to differ materially from those included in or contemplated by the forward-looking statements contained in this release are included under the caption "Risk Factors" and elsewhere in our Annual Report on Form 10-K that was filed for the fiscal year ended December 31, 2022, and other filings and reports we make with the Securities and Exchange Commission from time to time, including our Form 10-K that will be filed for the fiscal year ended December 31, 2023. All forward-looking statements contained herein are based on information available to us as of the date hereof and we do not assume any obligation to update these statements as a result of new information or future events.
Non-GAAP Financial Measures and Key Business Metrics
We review several operating and financial metrics, including the following unaudited non-GAAP financial measures and key business metrics to evaluate our business, measure our performance, identify trends affecting our business, formulate business plans, and make strategic decisions:
Non-GAAP Financial Measures
In addition to our results determined in accordance with U.S. generally accepted accounting principles (GAAP), we believe the following non-GAAP measures are useful in evaluating our operating performance. We use the following non-GAAP financial measures to evaluate our ongoing operations and for internal planning and forecasting purposes. We believe that these non-GAAP financial measures, when taken collectively, may be helpful to investors because they provide consistency and comparability with past financial performance. However, non-GAAP financial measures are presented for supplemental informational purposes only, have limitations as an analytical tool, and should not be considered in isolation or as a substitute for financial information presented in accordance with GAAP. In addition, other companies, including companies in our industry, may calculate similarly titled non-GAAP measures differently or may use other measures to evaluate their performance, all of which could reduce the usefulness of our non-GAAP financial measures as tools for comparison. A reconciliation is provided below for our non-GAAP financial measures to the most directly comparable financial measures stated in accordance with GAAP. Investors are encouraged to review the related GAAP financial measures and the reconciliation of these non-GAAP financial measures to their most directly comparable GAAP financial measures, and not to rely on any single financial measure to evaluate our business.
Non-GAAP Income from Operations and Non-GAAP Net Income exclude the effect of stock-based compensation expense-related charges, amortization of acquired intangibles, equity compensation related payments, expenses associated with acquisitions, and expenses associated with restructuring efforts, and are adjusted for income tax effects. We believe the presentation of operating results that exclude these non-cash or non-recurring items provides useful supplemental information to investors and facilitates the analysis of our operating results and comparison of operating results across reporting periods.
Adjusted EBITDA represents GAAP net loss as adjusted for income tax benefit (expense), interest income, interest expense, loss on debt refinancing, other income (expense) net, stock-based compensation, amortization of intangibles, equity compensation related payments, restructuring, acquisition costs, sponsor-related costs and depreciation. Equity compensation-related payments are related to the repurchase of employee stock options. We believe adjusted EBITDA is an important metric for understanding our business to assess our relative profitability adjusted for balance sheet debt levels.
Adjusted Unlevered Free Cash Flow (after-tax) represents operating cash flow less purchases of property and equipment and is adjusted for interest payments, equity compensation payments, restructuring costs (including payments for impaired leases), and executive severance. We believe this measure provides useful supplemental information to investors because it is an indicator of our liquidity over the long term needed to maintain and grow our core business operations. We also provide actual and forecast cash interest expense to aid in the calculation of adjusted free cash flow (after-tax).
Key Business Metrics
Annual Recurring Revenue (ARR) represents the expected annual billing amounts from all active maintenance and subscription agreements. ARR is calculated based on the contract Monthly Recurring Revenue (MRR) multiplied by 12. MRR is calculated based on the accounting adjusted total contract value divided by the number of months of the agreement based on the start and end dates of each contracted line item. The aggregate ARR calculated at the end of each reported period represents the value of all contracts that are active as of the end of the period, including those contracts that have expired but are still under negotiation for renewal. We typically allow for a grace period of up to 6 months past the original contract expiration quarter during which we engage in the renewal process before we report the contract as lost/inactive. This grace-period ARR amount has been less than 2% of the reported ARR in each period presented. If there is an actual cancellation of an ARR contract, we remove that ARR value at that time. We believe ARR is an important metric for understanding our business since it tracks the annualized cash value collected over a 12-month period for all our recurring contracts, irrespective of whether it is a maintenance contract on a perpetual license, a ratable cloud contract, or a self-managed term-based subscription license. ARR should be viewed independently of total revenue and deferred revenue related to our software and services contracts and is not intended to be combined with or to replace either of those items.
Maintenance Annual Recurring Revenue represents the portion of ARR only attributable to our maintenance contracts. We believe that Maintenance ARR is a helpful metric for understanding our business since it represents the approximate annualized cash value collected over a 12-month period for all our maintenance contracts. Maintenance ARR includes maintenance contracts supporting our perpetual licenses. Maintenance ARR should be viewed independently of maintenance revenue and deferred revenue related to our maintenance contracts and is not intended to be combined with or to replace either of those items.
Subscription Annual Recurring Revenue represents the portion of ARR only attributable to our subscription contracts. We believe that Subscription ARR is a helpful metric for understanding our business since it represents the approximate annualized cash value collected over a 12-month period for all our recurring subscription contracts. Subscription ARR excludes maintenance contracts on our perpetual licenses to provide information regarding the period-to-period performance and overall size and scale of our subscription business as we continue to focus our efforts on subscription-based licensing. Subscription ARR should be viewed independently of subscription revenue and deferred revenue related to our subscription contracts and is not intended to be combined with or to replace either of those items.
Cloud Subscription Annual Recurring Revenue represents the portion of ARR that is attributable to our hosted cloud contracts. We believe that Cloud Subscription ARR is a helpful metric for understanding our business since it represents the approximate annualized cash value collected over a 12-month period for all our recurring Cloud contracts. Cloud Subscription ARR is a subset of our overall Subscription ARR, and by providing this breakdown of Cloud Subscription ARR, it provides visibility on the size and growth rate of our Cloud Subscription ARR within our overall Subscription ARR. Cloud Subscription ARR should be viewed independently of subscription revenue and deferred revenue related to our subscription contracts and is not intended to be combined with or to replace either of those items.
Subscription Net Retention Rate (NRR) compares the contract value for Subscription ARR from the same set of customers at the end of a period compared to the prior year. We treat divisions, segments, or subsidiaries inside companies as separate customers when defining the End-user level. To calculate our Subscription NRR for a particular period, we first establish the Subscription ARR value at the end of the prior-year period. We subsequently measure the Subscription ARR value at the end of the current period from the same cohort of customers. The net retention rate is then calculated by dividing the aggregate Subscription ARR in the current period by the prior-year period. An increase in the Subscription NRR occurs as a result of price increases on existing contracts, higher consumption of existing products, and sales of additional new subscription products to existing customers exceeding losses from subscription contracts due to cancellations. We believe Subscription NRR is an important metric for understanding our business since it measures the rate at which we are able to sell additional products into our subscription customer base.
Cloud Subscription Net Retention Rate compares the contract value for Cloud Subscription ARR from the same set of customers at the end of a period compared to the prior year. We treat divisions, segments or subsidiaries inside companies that contract with us as separate customers when defining the End-user level. We treat divisions, segments, or subsidiaries of a company as one customer when defining the Global Parent level. Global parent customers are determined using Dun & Bradstreet GDUNS identifiers. To calculate our Cloud Subscription NRR for a particular period, we first establish the Cloud Subscription ARR value at the end of the prior year period. We subsequently measure the Cloud Subscription ARR value at the end of the current period from the same cohort of customers. Cloud Subscription NRR is then calculated by dividing the aggregate Cloud Subscription ARR in the current period by the prior year period. An increase in the Cloud Subscription NRR occurs as a result of price increases on existing contracts, higher consumption of existing products, and sales of additional new subscription products to existing customers exceeding losses from subscription contracts due to price decreases, usage decreases and cancellations. We believe Cloud Subscription NRR is an important metric for understanding our business since it measures the rate at which we are able to sell additional products into our cloud subscription customer base.
Supplemental Information
Subscription revenue disaggregation:
- Cloud subscription revenue represents revenues from cloud subscription offerings, which deliver applications and infrastructure technologies via cloud-based deployment models for which we develop functionality, provide unspecified updates and enhancements, host, manage, upgrade, and support, and that customers access by entering into a subscription agreement with us for a stated period.
- Self-managed subscription license revenue represents revenues from customers and partners contracted to use our self-managed software during a subscription term.
- Self-managed subscription support and other revenue represents revenues generated primarily through the sale of license support contracts sold together with the self-managed subscription license purchased by the customer. Self-managed subscription license support contracts provide customers with rights to unspecified software product upgrades, maintenance releases and patches released during the term of the support period and include internet access to technical content, as well as internet and telephone access to technical support personnel.
Gartner Disclaimer: Gartner does not endorse any vendor, product or service depicted in its research publications, and does not advise technology users to select only those vendors with the highest ratings or other designation. Gartner research publications consist of the opinions of Gartner's research organization and should not be construed as statements of fact. Gartner disclaims all warranties, expressed or implied, with respect to this research, including any warranties of merchantability or fitness for a particular purpose. Gartner and Magic Quadrant are a registered trademark of Gartner, Inc. and/or its affiliates in the U.S. and internationally and are used herein with permission. All rights reserved.
The Forrester Wave™ is copyrighted by Forrester Research, Inc. Forrester and Forrester Wave™ are trademarks of Forrester Research, Inc. The Forrester Wave™ is a graphical representation of Forrester's call on a market and is plotted using a detailed spreadsheet with exposed scores, weightings, and comments. Forrester does not endorse any vendor, product, or service depicted in the Forrester Wave™. Information is based on the best available resources. Opinions reflect judgment at the time and are subject to change.
About Informatica
Informatica (NYSE:INFA), an Enterprise Cloud Data Management leader, brings data and AI to life by empowering businesses to realize the transformative power of their most critical assets. We have created a new category of software, the Informatica Intelligent Data Management Cloud™ (IDMC). IDMC is an end-to-end data management platform, powered by CLAIRE® AI, that connects, manages and unifies data across any multi-cloud or hybrid system, democratizing data and enabling enterprises to modernize and advance their business strategies. Customers in approximately 100 countries, including 86 of the Fortune 100, rely on Informatica to drive data-led digital transformation. Informatica. Where data and AI come to life.
INFORMATICA INC. CONSOLIDATED STATEMENTS OF OPERATIONS (in thousands, except per share data) (Unaudited) |
|||||||||||||||
|
Three Months Ended December 31, |
|
Twelve Months Ended December 31, |
||||||||||||
|
|
2023 |
|
|
|
2022 |
|
|
|
2023 |
|
|
|
2022 |
|
Revenues: |
|
|
|
|
|
|
|
||||||||
Subscriptions |
$ |
300,145 |
|
|
$ |
238,364 |
|
|
$ |
1,003,484 |
|
|
$ |
857,163 |
|
Perpetual license |
|
2,283 |
|
|
|
4,217 |
|
|
|
3,307 |
|
|
|
10,397 |
|
Software revenue |
|
302,428 |
|
|
|
242,581 |
|
|
|
1,006,791 |
|
|
|
867,560 |
|
Maintenance and professional services |
|
142,750 |
|
|
|
156,200 |
|
|
|
588,369 |
|
|
|
637,558 |
|
Total revenues |
|
445,178 |
|
|
|
398,781 |
|
|
|
1,595,160 |
|
|
|
1,505,118 |
|
Cost of revenues: |
|
|
|
|
|
|
|
||||||||
Subscriptions |
|
43,786 |
|
|
|
27,814 |
|
|
|
157,229 |
|
|
|
105,387 |
|
Perpetual license |
|
232 |
|
|
|
160 |
|
|
|
787 |
|
|
|
636 |
|
Software costs |
|
44,018 |
|
|
|
27,974 |
|
|
|
158,016 |
|
|
|
106,023 |
|
Maintenance and professional services |
|
39,957 |
|
|
|
49,552 |
|
|
|
168,513 |
|
|
|
202,126 |
|
Amortization of acquired technology |
|
2,990 |
|
|
|
8,578 |
|
|
|
11,766 |
|
|
|
35,354 |
|
Total cost of revenues |
|
86,965 |
|
|
|
86,104 |
|
|
|
338,295 |
|
|
|
343,503 |
|
Gross profit |
|
358,213 |
|
|
|
312,677 |
|
|
|
1,256,865 |
|
|
|
1,161,615 |
|
Operating expenses: |
|
|
|
|
|
|
|
||||||||
Research and development |
|
79,464 |
|
|
|
79,179 |
|
|
|
335,072 |
|
|
|
318,769 |
|
Sales and marketing |
|
135,218 |
|
|
|
130,849 |
|
|
|
528,253 |
|
|
|
535,680 |
|
General and administrative |
|
40,681 |
|
|
|
35,631 |
|
|
|
162,708 |
|
|
|
128,092 |
|
Amortization of intangible assets |
|
34,394 |
|
|
|
38,120 |
|
|
|
137,514 |
|
|
|
153,471 |
|
Restructuring |
|
31,624 |
|
|
|
— |
|
|
|
59,755 |
|
|
|
— |
|
Total operating expenses |
|
321,381 |
|
|
|
283,779 |
|
|
|
1,223,302 |
|
|
|
1,136,012 |
|
Income from operations |
|
36,832 |
|
|
|
28,898 |
|
|
|
33,563 |
|
|
|
25,603 |
|
Interest income |
|
11,736 |
|
|
|
4,916 |
|
|
|
39,686 |
|
|
|
9,224 |
|
Interest expense |
|
(39,552 |
) |
|
|
(26,450 |
) |
|
|
(151,396 |
) |
|
|
(78,020 |
) |
Other (expense) income, net |
|
(7,705 |
) |
|
|
(3,024 |
) |
|
|
975 |
|
|
|
8,996 |
|
Income (loss) before income taxes |
|
1,311 |
|
|
|
4,340 |
|
|
|
(77,172 |
) |
|
|
(34,197 |
) |
Income tax (benefit) expense |
|
(62,950 |
) |
|
|
8,721 |
|
|
|
48,111 |
|
|
|
19,478 |
|
Net income (loss) |
$ |
64,261 |
|
|
$ |
(4,381 |
) |
|
$ |
(125,283 |
) |
|
$ |
(53,675 |
) |
|
|
|
|
|
|
|
|
||||||||
Net income (loss) per share attributable to Class A and Class B-1 common stockholders - basic |
$ |
0.22 |
|
|
$ |
(0.02 |
) |
|
$ |
(0.43 |
) |
|
$ |
(0.19 |
) |
Net income (loss) per share attributable to Class A and Class B-1 common stockholders - diluted |
$ |
0.21 |
|
|
$ |
(0.02 |
) |
|
$ |
(0.43 |
) |
|
$ |
(0.19 |
) |
Weighted-average shares used in computing net income (loss) per share - basic |
|
292,851 |
|
|
|
283,410 |
|
|
|
288,581 |
|
|
|
281,129 |
|
Weighted-average shares used in computing net income (loss) per share - diluted |
|
304,826 |
|
|
|
283,410 |
|
|
|
288,581 |
|
|
|
281,129 |
|
INFORMATICA INC. CONSOLIDATED BALANCE SHEETS (in thousands, except par value data) (Unaudited) |
|||||||
|
December 31, |
|
December 31, |
||||
|
|
2023 |
|
|
|
2022 |
|
Assets |
|
|
|
||||
Current assets: |
|
|
|
||||
Cash and cash equivalents |
$ |
732,443 |
|
|
$ |
497,879 |
|
Short-term investments |
|
259,828 |
|
|
|
218,256 |
|
Accounts receivable, net of allowances of $4,414 and $4,608, respectively |
|
500,068 |
|
|
|
454,759 |
|
Contract assets, net |
|
79,864 |
|
|
|
95,221 |
|
Prepaid expenses and other current assets |
|
180,383 |
|
|
|
132,638 |
|
Total current assets |
|
1,752,586 |
|
|
|
1,398,753 |
|
Property and equipment, net |
|
149,266 |
|
|
|
160,574 |
|
Operating lease right-of-use-assets |
|
57,799 |
|
|
|
67,735 |
|
Goodwill |
|
2,361,643 |
|
|
|
2,337,036 |
|
Customer relationships intangible asset, net |
|
669,781 |
|
|
|
794,898 |
|
Other intangible assets, net |
|
17,393 |
|
|
|
33,094 |
|
Deferred tax assets |
|
15,237 |
|
|
|
13,076 |
|
Other assets |
|
178,377 |
|
|
|
165,733 |
|
Total assets |
$ |
5,202,082 |
|
|
$ |
4,970,899 |
|
Liabilities and Stockholders' Equity |
|
|
|
||||
Current liabilities: |
|
|
|
||||
Accounts payable |
$ |
18,050 |
|
|
$ |
38,002 |
|
Accrued liabilities |
|
61,194 |
|
|
|
58,844 |
|
Accrued compensation and related expenses |
|
167,427 |
|
|
|
150,118 |
|
Current operating lease liabilities |
|
16,411 |
|
|
|
17,514 |
|
Current portion of long-term debt |
|
18,750 |
|
|
|
18,750 |
|
Income taxes payable |
|
4,305 |
|
|
|
3,758 |
|
Contract liabilities |
|
767,244 |
|
|
|
676,470 |
|
Total current liabilities |
|
1,053,381 |
|
|
|
963,456 |
|
Long-term operating lease liabilities |
|
46,003 |
|
|
|
55,178 |
|
Long-term contract liabilities |
|
19,482 |
|
|
|
23,007 |
|
Long-term debt, net |
|
1,805,960 |
|
|
|
1,821,760 |
|
Deferred tax liabilities |
|
22,425 |
|
|
|
18,604 |
|
Long-term income taxes payable |
|
37,679 |
|
|
|
30,601 |
|
Other liabilities |
|
4,554 |
|
|
|
3,932 |
|
Total liabilities |
|
2,989,484 |
|
|
|
2,916,538 |
|
Stockholders' equity: |
|
|
|
||||
Class A common stock; $0.01 par value per share; 2,000,000 and 2,000,000 shares authorized as of December 31, 2023 and December 31, 2022, respectively; Total of 250,874 and 239,749 shares issued and outstanding as of December 31, 2023 and December 31, 2022, respectively |
|
2,510 |
|
|
|
2,398 |
|
Class B-1 common stock; $0.01 par value per share; 200,000 and 200,000 shares authorized as of December 31, 2023 and December 31, 2022, respectively ; Total of 44,050 shares issued and outstanding as of December 31, 2023 and December 31, 2022, respectively |
|
440 |
|
|
|
440 |
|
Class B-2 common stock; $0.00001 par value per share, 200,000 and 200,000 shares authorized as of December 31, 2023 and December 31, 2022, respectively ; Total of 44,050 shares issued and outstanding as of December 31, 2023 and December 31, 2022, respectively |
|
— |
|
|
|
— |
|
Additional paid-in-capital |
|
3,540,502 |
|
|
|
3,282,383 |
|
Accumulated other comprehensive loss |
|
(22,370 |
) |
|
|
(47,671 |
) |
Accumulated deficit |
|
(1,308,484 |
) |
|
|
(1,183,189 |
) |
Total stockholders' equity |
|
2,212,598 |
|
|
|
2,054,361 |
|
Total liabilities and stockholders' equity |
$ |
5,202,082 |
|
|
$ |
4,970,899 |
|
|
|
|
|
||||
INFORMATICA INC. CONSOLIDATED STATEMENTS OF CASH FLOWS (in thousands) (unaudited) |
||||||||||||||||
|
|
Three Months Ended December 31, |
|
Twelve Months Ended December 31, |
||||||||||||
|
|
|
2023 |
|
|
|
2022 |
|
|
|
2023 |
|
|
|
2022 |
|
Operating activities: |
|
|
|
|
|
|
|
|
||||||||
Net income (loss) |
|
$ |
64,261 |
|
|
$ |
(4,381 |
) |
|
$ |
(125,283 |
) |
|
$ |
(53,675 |
) |
Adjustments to reconcile net loss to net cash provided by operating activities: |
|
|
|
|
|
|
|
|
||||||||
Depreciation and amortization |
|
|
4,839 |
|
|
|
4,747 |
|
|
|
17,513 |
|
|
|
21,208 |
|
Non-cash operating lease costs |
|
|
3,525 |
|
|
|
3,427 |
|
|
|
16,325 |
|
|
|
16,268 |
|
Stock-based compensation |
|
|
56,041 |
|
|
|
37,874 |
|
|
|
218,099 |
|
|
|
135,862 |
|
Deferred income taxes |
|
|
(3,365 |
) |
|
|
(793 |
) |
|
|
991 |
|
|
|
(85,579 |
) |
Amortization of intangible assets and acquired technology |
|
|
37,384 |
|
|
|
46,698 |
|
|
|
149,280 |
|
|
|
188,825 |
|
Amortization of debt issuance costs |
|
|
883 |
|
|
|
872 |
|
|
|
3,457 |
|
|
|
3,607 |
|
Amortization of investment discount, net of premium |
|
|
(1,446 |
) |
|
|
(722 |
) |
|
|
(4,422 |
) |
|
|
(1,002 |
) |
Changes in operating assets and liabilities: |
|
|
|
|
|
|
|
|
||||||||
Accounts receivable |
|
|
(220,851 |
) |
|
|
(191,965 |
) |
|
|
(38,301 |
) |
|
|
(17,249 |
) |
Prepaid expenses and other assets |
|
|
(24,003 |
) |
|
|
(35,852 |
) |
|
|
1,891 |
|
|
|
(25,511 |
) |
Accounts payable and accrued liabilities |
|
|
87,309 |
|
|
|
62,095 |
|
|
|
(20,758 |
) |
|
|
(50,697 |
) |
Income taxes payable |
|
|
(67,792 |
) |
|
|
(10,464 |
) |
|
|
(35,218 |
) |
|
|
12,127 |
|
Contract liabilities |
|
|
164,257 |
|
|
|
149,174 |
|
|
|
82,773 |
|
|
|
55,873 |
|
Net cash provided by operating activities |
|
|
101,042 |
|
|
|
60,710 |
|
|
|
266,347 |
|
|
|
200,057 |
|
Investing activities: |
|
|
|
|
|
|
|
|
||||||||
Purchases of property and equipment |
|
|
(1,624 |
) |
|
|
(3,892 |
) |
|
|
(6,543 |
) |
|
|
(5,465 |
) |
Purchases of investments |
|
|
(73,400 |
) |
|
|
(108,795 |
) |
|
|
(328,473 |
) |
|
|
(290,040 |
) |
Maturities of investments |
|
|
72,100 |
|
|
|
41,960 |
|
|
|
252,107 |
|
|
|
109,548 |
|
Sales of investments |
|
|
— |
|
|
|
— |
|
|
|
39,510 |
|
|
|
— |
|
Business acquisitions, net of cash acquired |
|
|
— |
|
|
|
— |
|
|
|
(12,476 |
) |
|
|
— |
|
Net cash used in investing activities |
|
|
(2,924 |
) |
|
|
(70,727 |
) |
|
|
(55,875 |
) |
|
|
(185,957 |
) |
Financing activities: |
|
|
|
|
|
|
|
|
||||||||
Proceeds from issuance of common stock under employee stock purchase plan |
|
|
— |
|
|
|
— |
|
|
|
28,229 |
|
|
|
32,790 |
|
Payments of offering costs |
|
|
— |
|
|
|
— |
|
|
|
— |
|
|
|
(2,085 |
) |
Payments for dividends related to Class B-2 shares |
|
|
— |
|
|
|
— |
|
|
|
(12 |
) |
|
|
(24 |
) |
Payment of debt |
|
|
(4,688 |
) |
|
|
(4,687 |
) |
|
|
(18,752 |
) |
|
|
(14,063 |
) |
Payments for taxes related to net share settlement of equity awards |
|
|
(18,624 |
) |
|
|
— |
|
|
|
(44,876 |
) |
|
|
— |
|
Net activity from derivatives with an other-than-insignificant financing element |
|
|
— |
|
|
|
7,087 |
|
|
|
— |
|
|
|
2,236 |
|
Proceeds from issuance of shares |
|
|
37,087 |
|
|
|
2,410 |
|
|
|
56,779 |
|
|
|
19,947 |
|
Net cash provided by financing activities |
|
|
13,775 |
|
|
|
4,810 |
|
|
|
21,368 |
|
|
|
38,801 |
|
Effect of foreign exchange rate changes on cash, cash equivalents, and restricted cash |
|
|
8,443 |
|
|
|
3,223 |
|
|
|
2,724 |
|
|
|
(13,118 |
) |
Net increase in cash, cash equivalents, and restricted cash |
|
|
120,336 |
|
|
|
(1,984 |
) |
|
|
234,564 |
|
|
|
39,783 |
|
Cash, cash equivalents, and restricted cash at beginning of period |
|
|
612,107 |
|
|
|
499,863 |
|
|
|
497,879 |
|
|
|
458,096 |
|
Cash, cash equivalents, and restricted cash at end of period |
|
$ |
732,443 |
|
|
$ |
497,879 |
|
|
$ |
732,443 |
|
|
$ |
497,879 |
|
Supplemental disclosures: |
|
|
|
|
|
|
|
|
||||||||
Cash paid for interest |
|
$ |
38,251 |
|
|
$ |
30,329 |
|
|
$ |
147,340 |
|
|
$ |
84,563 |
|
Cash paid for income taxes, net of refunds |
|
$ |
8,232 |
|
|
$ |
19,978 |
|
|
$ |
82,342 |
|
|
$ |
92,930 |
|
INFORMATICA INC. NON-GAAP FINANCIAL MEASURES AND KEY BUSINESS METRICS (in thousands, except per share data) (unaudited)
RECONCILIATIONS OF GAAP TO NON-GAAP
Reconciliation of GAAP net income (loss) to Non-GAAP net income |
|||||||||||||||
|
Three Months Ended December 31, |
|
Twelve Months Ended December 31, |
||||||||||||
|
|
2023 |
|
|
|
2022 |
|
|
|
2023 |
|
|
|
2022 |
|
|
(in thousands) |
|
(in thousands) |
||||||||||||
GAAP net income (loss) |
$ |
64,261 |
|
|
$ |
(4,381 |
) |
|
$ |
(125,283 |
) |
|
$ |
(53,675 |
) |
Stock-based compensation |
|
56,041 |
|
|
|
37,874 |
|
|
|
218,099 |
|
|
|
135,862 |
|
Amortization of intangibles |
|
37,384 |
|
|
|
46,698 |
|
|
|
149,280 |
|
|
|
188,825 |
|
Equity compensation |
|
— |
|
|
|
185 |
|
|
|
— |
|
|
|
332 |
|
Restructuring |
|
31,624 |
|
|
|
— |
|
|
|
59,755 |
|
|
|
— |
|
Acquisition costs |
|
— |
|
|
|
— |
|
|
|
1,584 |
|
|
|
— |
|
Executive severance |
|
— |
|
|
|
33 |
|
|
|
— |
|
|
|
132 |
|
Income tax effect |
|
(92,013 |
) |
|
|
(11,779 |
) |
|
|
(32,744 |
) |
|
|
(47,441 |
) |
Non-GAAP net income |
$ |
97,297 |
|
|
$ |
68,630 |
|
|
$ |
270,691 |
|
|
$ |
224,035 |
|
|
|
|
|
|
|
|
|
||||||||
Net income (loss) per share: |
|
|
|
|
|
|
|
||||||||
Net income (loss) per share—basic |
$ |
0.22 |
|
|
$ |
(0.02 |
) |
|
$ |
(0.43 |
) |
|
$ |
(0.19 |
) |
Net income (loss) per share—diluted |
$ |
0.21 |
|
|
$ |
(0.02 |
) |
|
$ |
(0.43 |
) |
|
$ |
(0.19 |
) |
Non-GAAP net income per share—basic |
$ |
0.33 |
|
|
$ |
0.24 |
|
|
$ |
0.94 |
|
|
$ |
0.80 |
|
Non-GAAP net income per share—diluted |
$ |
0.32 |
|
|
$ |
0.24 |
|
|
$ |
0.92 |
|
|
$ |
0.78 |
|
|
|
|
|
|
|
|
|
||||||||
Share count (in thousands): |
|
|
|
|
|
|
|
||||||||
Weighted-average shares used in computing Net loss per share—basic |
|
292,851 |
|
|
|
283,410 |
|
|
|
288,581 |
|
|
|
281,129 |
|
Weighted-average shares used in computing Net loss per share—diluted |
|
304,826 |
|
|
|
283,410 |
|
|
|
288,581 |
|
|
|
281,129 |
|
Weighted-average shares used in computing Non-GAAP net income per share—basic |
|
292,851 |
|
|
|
283,410 |
|
|
|
288,581 |
|
|
|
281,129 |
|
Weighted-average shares used in computing Non-GAAP net income per share—diluted |
|
304,826 |
|
|
|
287,009 |
|
|
|
295,279 |
|
|
|
285,682 |
|
Reconciliation of GAAP income (loss) from operations to Non-GAAP income from operations |
|||||||||||
|
Three Months Ended December 31, |
|
Twelve Months Ended December 31, |
||||||||
|
|
2023 |
|
|
2022 |
|
|
2023 |
|
|
2022 |
|
(in thousands) |
|
(in thousands) |
||||||||
GAAP income from operations |
$ |
36,832 |
|
$ |
28,898 |
|
$ |
33,563 |
|
$ |
25,603 |
Stock-based compensation |
|
56,041 |
|
|
37,874 |
|
|
218,099 |
|
|
135,862 |
Amortization of intangibles |
|
37,384 |
|
|
46,698 |
|
|
149,280 |
|
|
188,825 |
Equity compensation |
|
— |
|
|
185 |
|
|
— |
|
|
332 |
Restructuring |
|
31,624 |
|
|
— |
|
|
59,755 |
|
|
— |
Acquisition costs |
|
— |
|
|
— |
|
|
1,584 |
|
|
— |
Non-GAAP income from operations |
$ |
161,881 |
|
$ |
113,655 |
|
$ |
462,281 |
|
$ |
350,622 |
INFORMATICA INC. NON-GAAP FINANCIAL MEASURES AND KEY BUSINESS METRICS
Adjusted EBITDA Reconciliation |
|||||||||||||||
|
Three Months Ended December 31, |
|
Twelve Months Ended December 31, |
||||||||||||
|
|
2023 |
|
|
|
2022 |
|
|
|
2023 |
|
|
|
2022 |
|
|
(in thousands) |
|
(in thousands) |
||||||||||||
GAAP net income (loss) |
$ |
64,261 |
|
|
$ |
(4,381 |
) |
|
$ |
(125,283 |
) |
|
$ |
(53,675 |
) |
Income tax (benefit) expense |
|
(62,950 |
) |
|
|
8,721 |
|
|
|
48,111 |
|
|
|
19,478 |
|
Interest income |
|
(11,736 |
) |
|
|
(4,916 |
) |
|
|
(39,686 |
) |
|
|
(9,224 |
) |
Interest expense |
|
39,552 |
|
|
|
26,450 |
|
|
|
151,396 |
|
|
|
78,020 |
|
Other expense (income), net |
|
7,705 |
|
|
|
3,024 |
|
|
|
(975 |
) |
|
|
(8,996 |
) |
Stock-based compensation |
|
56,041 |
|
|
|
37,874 |
|
|
|
218,099 |
|
|
|
135,862 |
|
Amortization of intangibles |
|
37,384 |
|
|
|
46,698 |
|
|
|
149,280 |
|
|
|
188,825 |
|
Equity compensation |
|
— |
|
|
|
185 |
|
|
|
— |
|
|
|
332 |
|
Restructuring |
|
31,624 |
|
|
|
— |
|
|
|
59,755 |
|
|
|
— |
|
Acquisition costs |
|
— |
|
|
|
— |
|
|
|
1,584 |
|
|
|
— |
|
Depreciation |
|
4,543 |
|
|
|
4,721 |
|
|
|
17,083 |
|
|
|
21,007 |
|
Adjusted EBITDA |
$ |
166,424 |
|
|
$ |
118,376 |
|
|
$ |
479,364 |
|
|
$ |
371,629 |
|
Adjusted Unlevered Free Cash Flows |
|||||||||||||||
|
Three Months Ended December 31, |
|
Twelve Months Ended December 31, |
||||||||||||
|
|
2023 |
|
|
|
2022 |
|
|
|
2023 |
|
|
|
2022 |
|
|
(in thousands, except percentages) |
|
(in thousands, except percentages) |
||||||||||||
Total GAAP Revenue |
$ |
445,178 |
|
|
$ |
398,781 |
|
|
$ |
1,595,160 |
|
|
$ |
1,505,118 |
|
Net cash provided by operating activities |
$ |
101,042 |
|
|
$ |
60,710 |
|
|
$ |
266,347 |
|
|
$ |
200,057 |
|
Less: Purchases of property, plant, and equipment |
|
(1,624 |
) |
|
|
(3,892 |
) |
|
|
(6,543 |
) |
|
|
(5,465 |
) |
Add: Equity compensation payments |
|
257 |
|
|
|
134 |
|
|
|
425 |
|
|
|
638 |
|
Add: Executive severance |
|
— |
|
|
|
4,050 |
|
|
|
— |
|
|
|
7,969 |
|
Add: Restructuring costs |
|
16,829 |
|
|
|
178 |
|
|
|
43,593 |
|
|
|
753 |
|
Adjusted Free Cash Flows (after-tax)(1) |
$ |
116,504 |
|
|
$ |
61,180 |
|
|
$ |
303,822 |
|
|
$ |
203,952 |
|
Add: Cash paid for interest |
|
38,251 |
|
|
|
30,329 |
|
|
|
147,340 |
|
|
|
84,563 |
|
Adjusted Unlevered Free Cash Flows (after-tax)(1) |
$ |
154,755 |
|
|
$ |
91,509 |
|
|
$ |
451,162 |
|
|
$ |
288,515 |
|
|
|
|
|
|
|
|
|
||||||||
Adjusted Free Cash Flows (after-tax) margin(1) |
|
26 |
% |
|
|
15 |
% |
|
|
19 |
% |
|
|
14 |
% |
Adjusted Unlevered Free Cash Flows (after-tax) margin(1) |
|
35 |
% |
|
|
23 |
% |
|
|
28 |
% |
|
|
19 |
% |
(1) Includes cash tax payments of $8.2 million and $20.0 million for the three months ended December 31, 2023 and 2022, respectively, and cash tax payments of $82.3 million and $92.9 million for the year ended December 31, 2023 and 2022, respectively. |
|||||||||||||||
Key Business Metrics
The following are our key business metrics as of December 31, 2023 and 2022. |
|||||||
|
December 31, |
||||||
|
|
2023 |
|
|
|
2022 |
|
|
(in thousands, except percentages) |
||||||
Cloud Subscription Annual Recurring Revenue |
$ |
616,792 |
|
|
$ |
451,188 |
|
Self-managed Subscription Annual Recurring Revenue |
|
515,874 |
|
|
|
543,035 |
|
Subscription Annual Recurring Revenue |
|
1,132,666 |
|
|
|
994,223 |
|
Maintenance Annual Recurring Revenue on Perpetual Licenses |
|
493,579 |
|
|
|
522,837 |
|
Total Annual Recurring Revenue |
$ |
1,626,245 |
|
|
$ |
1,517,060 |
|
|
|
|
|
||||
Subscription Net Retention Rate (End-user level) |
|
106 |
% |
|
|
111 |
% |
Cloud Subscription Net Retention Rate (End-user level) |
|
119 |
% |
|
|
117 |
% |
Cloud Subscription Net Retention Rate (Global Parent level) |
|
125 |
% |
|
|
123 |
% |
INFORMATICA INC. SUPPLEMENTAL INFORMATION
Additional Business Metrics |
|||||
|
December 31, |
||||
|
2023 |
|
2022 |
||
Maintenance Renewal Rate |
95 |
% |
|
96 |
% |
Subscription Renewal Rate |
92 |
% |
|
94 |
% |
Customers that spend more than $1 million in Subscription Annual Recurring Revenue (1) |
240 |
|
|
206 |
|
Customers that spend more than $100,000 in Subscription Annual Recurring Revenue (2) |
1,988 |
|
|
1,916 |
|
Cloud transactions processed per month in trillions (3) |
86.0 |
|
|
53.0 |
|
(1) Total number of customers that spend more than $1 million in Subscription Annual Recurring Revenue. (2) Total number of customers that spend more than $100,000 in Subscription Annual Recurring Revenue. (3) Total number of cloud transactions processed on our platform per month in trillions, which measures data processed. |
|||||
Disaggregation of Subscription Revenues |
|||||||||||
|
Three Months Ended December 31, |
|
Year Ended December 31, |
||||||||
|
|
2023 |
|
|
2022 |
|
|
2023 |
|
|
2022 |
|
(in thousands) |
|
(in thousands) |
||||||||
Revenues: |
|
|
|
|
|
|
|
||||
Cloud subscription |
$ |
140,319 |
|
$ |
100,645 |
|
$ |
499,922 |
|
$ |
359,380 |
Self-managed subscription license |
|
108,916 |
|
|
86,135 |
|
|
298,048 |
|
|
294,671 |
Self-managed subscription support and other |
|
50,910 |
|
|
51,584 |
|
|
205,514 |
|
|
203,112 |
Subscription revenues |
$ |
300,145 |
|
$ |
238,364 |
|
$ |
1,003,484 |
|
$ |
857,163 |
Net Debt Reconciliation |
|||||||
|
December 31, |
||||||
|
|
2023 |
|
|
|
2022 |
|
|
|
|
|
||||
|
(in millions) |
||||||
Dollar Term Loan |
$ |
1,842 |
|
|
$ |
1,861 |
|
Less: Cash, cash equivalents, and short-term investments |
|
(992 |
) |
|
|
(716 |
) |
Total net debt |
$ |
850 |
|
|
$ |
1,145 |
|
View source version on businesswire.com: https://www.businesswire.com/news/home/20240214165029/en/