LandBridge Company LLC Announces Third Quarter Results and Declares Quarterly Cash Dividend
Delivers revenue growth of 60% year-over-year
Declared initial quarterly cash dividend of $0.10 per share
Initiated FY24 and FY25 outlook
LandBridge Company LLC (NYSE:LB) (the "Company," "LandBridge") today announced its financial and operating results for the third quarter of 2024.
This press release features multimedia. View the full release here: https://www.businesswire.com/news/home/20241106070670/en/
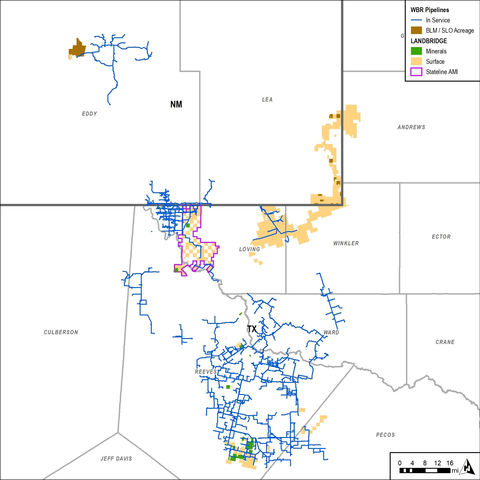
(Graphic: LandBridge)
Third Quarter 2024 Financial Highlights
- Revenues of $28.5 million, up 60% year-over-year
- Net loss of $2.8 million(1)
- Net loss margin of 10%(1)
- Adjusted EBITDA(2) of $25.0 million, up 62% year-over-year
- Adjusted EBITDA Margin(2) of 88%
- Cash flows from operating activities of $7.5 million
- Free Cash Flow(2,3) of $7.1 million
- Operating cash flow margin of 26%
- Free Cash Flow Margin(2,3) of 25%
(1) Net loss and net loss margin include a non-cash expense of $11.6 million attributable to share-based compensation, including $9.8 million attributable to management incentive units issued by LandBridge Holdings LLC ("Incentive Units"). Any actual cash expense associated with such Incentive Units will be borne solely by LandBridge Holdings LLC and not the Company. |
(2) Adjusted EBITDA, Adjusted EBITDA Margin, Free Cash Flow and Free Cash Flow Margin are non-GAAP financial measures. See "Comparison of Non-GAAP Financial Measures" included within the Appendix of this press release for related disclosures and reconciliations to the most directly comparable financial measures calculated and presented in accordance with GAAP. |
(3) Free Cash Flow and Free Cash Flow Margin were impacted by $11.1 million of non-recurring costs related to our recently completed initial public offering ("IPO") and lease termination expense on our legacy Stateline Position. |
Other Recent Events
- Acquired 1,280 surface acres in Winkler County, Texas, and executed a purchase agreement for an additional 5,800 acres in Lea County, New Mexico that will collectively increase the total surface owned by the Company to approximately 227,000 acres
- Entered into a lease development agreement for the development of a data center and related facilities on approximately 2,000 acres of our land in Reeves County, Texas
- Completed an amendment to the Company's debt facilities to fund the acquisitions and enhance the Company's liquidity position
- Announced initial $0.10/share cash dividend, payable on December 19, 2024 to shareholders of record as of December 5, 2024
Jason Long, Chief Executive Officer, stated, "Our active land management strategy continues to deliver strong results with another quarter of double-digit revenue growth year-over-year and industry-leading Adjusted EBITDA margins. We continue to capitalize on activity across the Delaware Basin, and recently expanded our surface acreage position in the heart of the Basin, providing additional opportunities to create value for our shareholders through our diversified revenue streams."
Scott McNeely, Chief Financial Officer of the Company, said, "Given the significant growth opportunities we see ahead, we continue to pursue opportunities to enhance our financial flexibility and liquidity. Our recent debt facility amendment supports our ability to continue to strategically and opportunistically pursue new land acquisitions. We are also pleased to introduce our inaugural quarterly cash dividend, providing another important means to share our success with shareholders."
Third Quarter 2024 Consolidated Financial Information
Revenue for the third quarter of 2024 was $28.5 million as compared to $26.0 million in the second quarter of 2024 and $17.8 million in the third quarter of 2023. The sequential increase was primarily attributable to increases in surface use royalties of $2.9 million, resource sales of $1.1 million and resource royalties of $0.9 million, partially offset by sequential decreases of $0.8 million and $1.6 million in easements and other surface-related revenue and oil and gas royalties, respectively. Net loss for the third quarter of 2024 was $2.8 million as compared to net loss of $57.7 million in the second quarter of 2024 and net income of $16.6 million in the third quarter of 2023. (1)
Adjusted EBITDA was $25.0 million in the third quarter of 2024 as compared to $23.4 million in the second quarter of 2024 and $15.4 million in the third quarter of 2023. (2) Adjusted EBITDA during the third quarter of 2024 reflects $9.8 million of non-cash charges related to Incentive Units, $1.8 million of non-cash charges related to restricted stock units and $0.4 million of transaction-related expenses.
Net loss margin was 10% in the third quarter of 2024 as compared to net income margin of 93% in the third quarter of 2023. (1) Adjusted EBITDA margin was 88% in the third quarter of 2024 as compared to 90% in the second quarter of 2024 and 87% in the third quarter of 2023. (2)
Diversified Revenue Streams
Surface Use Royalties and Revenue: Generated revenues of $16.5 million in the third quarter of 2024 as compared to $14.4 million in the second quarter of 2024 and $5.5 million in the third quarter of 2023. Surface Use Royalties and Revenue increased 14% sequentially, primarily driven by an increase in produced water royalty volumes from 628 MBbls/d to 775 MBbls/d.
Resources Sales and Royalties: Generated revenues of $9.1 million in the third quarter of 2024 as compared to $7.0 million in the second quarter of 2024 and $6.0 million in the third quarter of 2023. Revenue from Resource Sales and Royalties increased 29% sequentially, primarily driven by improved brackish water sales and royalty volumes.
Oil and Gas Royalties: Generated revenues of $2.9 million in the third quarter of 2024 as compared to $4.5 million in the second quarter of 2024 and $6.3 million in the third quarter of 2023. Revenue from Oil and Gas Royalties decreased 35% sequentially, primarily driven by net royalty production decreasing to 895 boe/d at an average realized price of $36.31 per boe.
Free Cash Flow Generation
Cash flow from operations for the third quarter of 2024 was $7.5 million as compared to $16.0 million in the second quarter of 2024 and $16.2 million in the third quarter of 2023. Capital expenditures for the third quarter of 2024 were $0.3 million. Free cash flow during the third quarter of 2024 was $7.1 million,(2) net of $11.1 million of non-recurring costs related to our recently completed IPO and lease termination expense on our legacy Stateline Position.
Net cash used in investing activities during the third quarter of 2024 was $1.1 million.
Net cash used in financing activities during the third quarter of 2024 consists of $16.6 million of net outflows consisting of a $170.9 million post-IPO distribution, an $83.8 million paydown of the term loan and a $35.0 million paydown of the revolving credit facility, partially offset by $273.1 million of IPO proceeds net of offering costs.
Strong Balance Sheet with Ample Liquidity
Total cash and cash equivalents were $14.4 million as of September 30, 2024, as compared to $24.6 million as of June 30, 2024. The Company had $281.3 million of borrowings outstanding under its term loan and revolving credit facility as of September 30, 2024, versus $400.0 million outstanding as of June 30, 2024.
As of September 30, 2024, the Company had approximately $60.0 million of available borrowing capacity under its revolving credit facility.
Total liquidity was $74.4 million as of September 30, 2024.
Subsequent to the quarter, the Company amended its debt facilities to increase availability under its revolving credit facility by $25.0 million to $100.0 million and increase term loan borrowings to $300.0 million, with an additional $75.0 million uncommitted delayed draw term loan, and eliminate the Company's obligation to make term loan amortization payments.
Ongoing Commercial Progress
In November 2024, we acquired 1,280 fee surface acres in Winkler County, Texas adjacent to our existing East Stateline Ranch position and associated supply water assets. This acquisition includes a long-term water supply contract with an active sand mine underpinned by a minimum volume commitment through October 2031.
In November 2024, we entered into a purchase and sale agreement with a third-party private seller to acquire approximately 5,800 fee surface acres in Lea County, New Mexico. This surface position includes existing surface use royalties and revenues and expands our footprint into a new area of the Delaware Basin, providing additional opportunities to grow revenue via our active land management strategy and partnership with WaterBridge.
In November 2024, we executed a lease development agreement for the development of a data center and related facilities on approximately 2,000 acres of our land in Reeves County, Texas. The counterparty to the agreement is a joint venture between a third-party developer and funds affiliated with our financial sponsor, Five Point Energy LLC. The lease development agreement includes, among other things, a non-refundable $8.0 million deposit due in December 2024 for a two-year site selection and pre-development period. The counterparty is obligated to meet certain timing milestones to maintain its lease, to include the commencement of site development within a two-year period and construction of the data center within a subsequent four-year period. Upon initiation of construction of a data center, the counterparty will make escalating annual lease payments along with additional payments based on the net revenue received with respect to the power generation facilities to be located on the leased property. Approval of the lease development agreement and related transactions were referred to an independent Conflicts Committee of the Company's Board of Directors for approval. We can offer no assurance that the counterparty will lease the site, in part or in full, nor can there be any assurance that the counterparty will be successful in its efforts to develop the data center or any power generation facilities.
Outlook
The Company is initiating the following outlook for full-year 2024 and full-year 2025:
For the full-year 2024, the Company expects Adjusted EBITDA to be between $95 million and $100 million, driven by:
- Higher than expected surface use royalties and revenues subsequent to increased development and higher than anticipated produced water volumes on our surface;
- Addition of a lease development agreement payment for the development of a data center on approximately 2,000 acres of our land in the southern Delaware Basin;
- Deferral of marketing a 250MW solar project into 2025 to better align with the execution of the lease development agreement in connection with the data center;
- Lower than anticipated resource sales and royalties; and
- Impact of realized commodity prices on our oil and gas royalties.
For the full-year 2025, the Company expects Adjusted EBITDA to be between $140 million and $160 million, driven by:
- Incremental contribution of our recent acquisitions;
- Initial solar facility contributions to surface use revenues;
- Growth of our surface use royalties through higher produced water volumes on our surface;
- Updates to resources sales and royalties based on current timing and volume expectations; and
- Updates to anticipated commodity pricing based on current regional pricing dynamics
Reconciliations of forward-looking non-GAAP financial measures to comparable GAAP measures are not available due to the challenges and impracticability of estimating certain items, particularly non-recurring gains or losses, unusual or non-recurring items, income tax benefit or expense, or one-time transaction costs and cost of revenue. We are unable to reasonably predict these because they are uncertain and depend on various factors not yet known, which could have a material impact on GAAP results for the guidance period. Because of those challenges, a reconciliation of forward-looking non-GAAP financial measures is not available without unreasonable effort.
Quarterly Report on Form 10-Q
Our financial statements and related footnotes will be available in our Quarterly Report on Form 10-Q for the quarter ended September 30, 2024, which is expected to be filed with the U.S. Securities and Exchange Commission ("SEC") on November 7, 2024.
Conference Call and Webcast Information
The Company will hold a conference call on Thursday, November 7, 2024, at 8:00 a.m. Central Time to discuss third quarter results. A live webcast of the conference call will be available on the Investors section of the Company's website at https://ir.landbridgeco.com/overview/default.aspx. To listen to the live broadcast, go to the site at least 10-15 minutes prior to the scheduled start time to register and install any necessary audio software.
The conference call can also be accessed by dialing (800) 715-9871 (or (646) 307-1963 for international participants) and providing the Conference ID 4907698. The telephone replay can be accessed by dialing (800) 770-2030 and providing the Conference ID 4907698. The telephone replay will be available starting shortly after the call through November 21, 2024.
About LandBridge
LandBridge owns approximately 221,000 surface acres across Texas and New Mexico, located primarily in the heart of the Delaware sub-basin in the Permian Basin, the most active region for oil and natural gas exploration and development in the United States. LandBridge actively manages its land and resources to support and encourage oil and natural gas production and broader industrial development. Since its founding in 2021, LandBridge has served as one of the leading land management businesses within the Delaware Basin. LandBridge was formed by Five Point Energy LLC, a private equity firm with a track record of investing in and developing energy, environmental water management and sustainable infrastructure companies within the Permian Basin.
Cautionary Statement Regarding Forward-Looking Statements
This news release may contain forward-looking statements within the meaning of Section 27A of the Securities Act of 1933, as amended, and Section 21E of the Securities Exchange Act of 1934, as amended, that are based on LandBridge's beliefs, as well as assumptions made by, and information currently available to, LandBridge, and therefore involve risks and uncertainties that are difficult to predict. Generally, future or conditional verbs such as "will," "would," "should," "could," or "may" and the words "believe," "anticipate," "continue," "intend," "expect" and similar expressions identify forward-looking statements. Forward-looking statements include, but are not limited to, strategies, plans, objectives, expectations, intentions, assumptions, future operations and prospects and other statements that are not historical facts, including our estimated future financial performance. You should not place undue reliance on forward-looking statements. Although LandBridge believes that plans, intentions and expectations reflected in or suggested by any forward-looking statements made herein are reasonable, LandBridge may be unable to achieve such plans, intentions or expectations and actual results, and performance or achievements may vary materially and adversely from those envisaged in this news release due to a number of factors including, but not limited to: our customers' demand for and use of our land and resources; the success of our affiliates, WaterBridge, Desert Environmental and the counterparty to the lease development agreement in executing their business strategies, including their ability to construct infrastructure, attract customers and operate successfully on our land; our customers' willingness and ability to develop our land or any potential acquired acreage to accommodate any future surface use developments, such as the site under contract for the lease development agreement for the data center; the domestic and foreign supply of, and demand for, energy sources, including the impact of actions relating to oil price and production controls by the members of the Organization of Petroleum Exporting Countries, Russia and other allied producing countries with respect to oil production levels and announcements of potential changes to such levels; our ability to enter into favorable contracts regarding surface uses, access agreements and fee arrangements, including the prices we are able to charge and the margins we are able to realize; the initiation or outcome of potential litigation; our ability to continue the payment of dividends; our ability to successfully implement our growth plans, including through the future acquisitions of acreage and/or introduction of new revenue streams; and any changes in general economic and/or industry specific conditions. These risks, as well as other risks associated with LandBridge are also more fully discussed in our final prospectus filed with the SEC on June 28, 2024, and any subsequently filed quarterly reports and current reports. You can access LandBridge's filings with the SEC through the SEC's website at http://www.sec.gov. Except as required by applicable law, LandBridge undertakes no obligation to update any forward-looking statements or other statements herein for revisions or changes after this communication is made.
The historical financial information presented below reflects only our historical financial results and the historical financial results of our predecessor, DBR Land Holdings LLC, as applicable and does not give pro forma effect to the East Stateline Acquisition, the Credit Agreement Amendment, the Corporate Reorganization or the Offering. Each of the East Stateline Acquisition, the Credit Amendment, the Corporate Reorganization and the Offering is reflected in the historical financial information solely from and after its respective completion.
THIRD QUARTER 2024 RESULTS
CONSOLIDATED STATEMENTS OF OPERATIONS |
||||||||||||||||
|
|
Three Months Ended
|
|
|
Nine Months Ended
|
|
||||||||||
|
|
2024 |
|
|
2023 |
|
|
2024 |
|
|
2023 |
|
||||
Revenues: |
|
|
|
|
|
|
|
|
|
|
|
|
||||
Surface use royalties |
|
$ |
4,227 |
|
|
$ |
1,693 |
|
|
$ |
9,129 |
|
|
$ |
5,316 |
|
Surface use royalties - Related party |
|
|
5,627 |
|
|
|
1,500 |
|
|
|
11,902 |
|
|
|
3,274 |
|
Easements and other surface-related revenues |
|
|
5,176 |
|
|
|
2,309 |
|
|
|
15,018 |
|
|
|
5,662 |
|
Easements and other surface-related revenues - Related party |
|
|
1,465 |
|
|
|
7 |
|
|
|
4,224 |
|
|
|
3,864 |
|
Resource sales |
|
|
4,874 |
|
|
|
4,190 |
|
|
|
11,908 |
|
|
|
15,907 |
|
Resource sales - Related party |
|
|
57 |
|
|
|
139 |
|
|
|
329 |
|
|
|
1,627 |
|
Oil and gas royalties |
|
|
2,903 |
|
|
|
6,323 |
|
|
|
11,563 |
|
|
|
14,948 |
|
Resource royalties |
|
|
2,686 |
|
|
|
1,638 |
|
|
|
6,803 |
|
|
|
4,810 |
|
Resource royalties - Related party |
|
|
1,472 |
|
|
|
- |
|
|
|
2,579 |
|
|
|
- |
|
Total revenues |
|
|
28,487 |
|
|
|
17,799 |
|
|
|
73,455 |
|
|
|
55,408 |
|
|
|
|
|
|
|
|
|
|
|
|
|
|
||||
Resource sales-related expense |
|
|
423 |
|
|
|
1,003 |
|
|
|
1,739 |
|
|
|
3,081 |
|
Other operating and maintenance expense |
|
|
708 |
|
|
|
701 |
|
|
|
1,837 |
|
|
|
1,956 |
|
General and administrative expense (income) |
|
|
22,131 |
|
|
|
(5,571 |
) |
|
|
98,114 |
|
|
|
(20,610 |
) |
Depreciation, depletion, amortization and accretion |
|
|
2,038 |
|
|
|
2,562 |
|
|
|
6,294 |
|
|
|
6,396 |
|
Operating income (loss) |
|
|
3,187 |
|
|
|
19,104 |
|
|
|
(34,529 |
) |
|
|
64,585 |
|
|
|
|
|
|
|
|
|
|
|
|
|
|
||||
Interest expense, net |
|
|
7,071 |
|
|
|
2,893 |
|
|
|
16,235 |
|
|
|
4,173 |
|
Other income |
|
|
- |
|
|
|
(526 |
) |
|
|
(241 |
) |
|
|
(541 |
) |
(Loss) income from operations before taxes |
|
|
(3,884 |
) |
|
|
16,737 |
|
|
|
(50,523 |
) |
|
|
60,953 |
|
Income tax (benefit) expense |
|
|
(1,128 |
) |
|
|
104 |
|
|
|
(890 |
) |
|
|
303 |
|
Net (loss) income |
|
$ |
(2,756 |
) |
|
$ |
16,633 |
|
|
$ |
(49,633 |
) |
|
$ |
60,650 |
|
Net loss prior to Offering |
|
|
- |
|
|
|
|
|
|
(46,877 |
) |
|
|
|
||
Net loss attributable to noncontrolling interest |
|
|
(5,412 |
) |
|
|
|
|
|
(5,412 |
) |
|
|
|
||
Net income attributable to LandBridge Company LLC |
|
$ |
2,656 |
|
|
|
|
|
$ |
2,656 |
|
|
|
|
||
CONSOLIDATED BALANCE SHEETS |
||||||||
|
|
September 30, |
|
|
December 31, |
|
||
|
|
2024 |
|
|
2023 |
|
||
Current assets: |
|
|
|
|
|
|
||
Cash and cash equivalents |
|
$ |
14,417 |
|
|
$ |
37,823 |
|
Accounts receivable, net |
|
|
12,757 |
|
|
|
12,383 |
|
Related party receivable |
|
|
2,161 |
|
|
|
1,037 |
|
Prepaid expenses and other current assets |
|
|
2,271 |
|
|
|
1,035 |
|
Total current assets |
|
|
31,606 |
|
|
|
52,278 |
|
|
|
|
|
|
|
|
||
Non-current assets: |
|
|
|
|
|
|
||
Property, plant and equipment, net |
|
|
628,087 |
|
|
|
203,018 |
|
Intangible assets, net |
|
|
27,484 |
|
|
|
28,642 |
|
Other assets |
|
|
2,711 |
|
|
|
5,011 |
|
Total non-current assets |
|
|
658,282 |
|
|
|
236,671 |
|
Total assets |
|
$ |
689,888 |
|
|
$ |
288,949 |
|
|
|
|
|
|
|
|
||
Liabilities and equity |
|
|
|
|
|
|
||
Current liabilities: |
|
|
|
|
|
|
||
Accounts payable |
|
$ |
182 |
|
|
$ |
200 |
|
Related party payable |
|
|
504 |
|
|
|
453 |
|
Accrued liabilities |
|
|
6,199 |
|
|
|
4,945 |
|
Current portion of long-term debt |
|
|
35,547 |
|
|
|
20,339 |
|
Other current liabilities |
|
|
826 |
|
|
|
1,163 |
|
Total current liabilities |
|
|
43,258 |
|
|
|
27,100 |
|
|
|
|
|
|
|
|
||
Non-current liabilities: |
|
|
|
|
|
|
||
Long-term debt |
|
|
242,430 |
|
|
|
108,343 |
|
Other long-term liabilities |
|
|
183 |
|
|
|
2,759 |
|
Total non-current liabilities |
|
|
242,613 |
|
|
|
111,102 |
|
Total liabilities |
|
|
285,871 |
|
|
|
138,202 |
|
|
|
|
|
|
|
|
||
Commitments and contingencies |
|
|
|
|
|
|
||
|
|
|
|
|
|
|
||
Member's equity |
|
|
- |
|
|
|
150,747 |
|
Class A shares, unlimited shares authorized and 17,425,000 shares issued
|
|
|
94,553 |
|
|
|
- |
|
Class B shares, unlimited shares authorized and 55,726,603 shares issued
|
|
|
- |
|
|
|
- |
|
Retained earnings |
|
|
2,656 |
|
|
|
- |
|
Total shareholders' equity attributable to LandBridge Company LLC |
|
|
97,209 |
|
|
|
- |
|
Noncontrolling interest |
|
|
306,808 |
|
|
|
- |
|
Total shareholders' and member's equity |
|
|
404,017 |
|
|
|
150,747 |
|
Total liabilities and equity |
|
$ |
689,888 |
|
|
$ |
288,949 |
|
|
|
|
|
|
|
|
||
CONSOLIDATED STATEMENTS OF CASH FLOWS |
|||||||||
|
|
Nine Months Ended
|
|
|
|||||
|
|
2024 |
|
|
2023 |
|
|
||
Cash flows from operating activities |
|
|
|
|
|
|
|
||
Net (loss) income |
|
$ |
(49,633 |
) |
|
$ |
60,650 |
|
|
Adjustments to reconcile net (loss) income to net cash provided by operating activities: |
|
|
|
|
|
|
|
||
Depreciation, depletion, amortization and accretion |
|
|
6,294 |
|
|
|
6,396 |
|
|
Amortization of deferred financing fees |
|
|
302 |
|
|
|
65 |
|
|
Amortization of debt issuance costs |
|
|
875 |
|
|
|
129 |
|
|
Share-based compensation |
|
|
84,196 |
|
|
|
(24,434 |
) |
|
Deferred income tax benefit |
|
|
(1,276 |
) |
|
|
- |
|
|
Other |
|
|
- |
|
|
|
(17 |
) |
|
Changes in operating assets and liabilities: |
|
|
|
|
|
|
|
||
Accounts receivable |
|
|
1,640 |
|
|
|
(2,357 |
) |
|
Related party receivable |
|
|
(1,124 |
) |
|
|
(357 |
) |
|
Prepaid expenses and other assets |
|
|
(341 |
) |
|
|
225 |
|
|
Accounts payable |
|
|
(50 |
) |
|
|
658 |
|
|
Related party payable |
|
|
51 |
|
|
|
(158 |
) |
|
Other current liabilities |
|
|
(226 |
) |
|
|
(241 |
) |
|
Net cash provided by operating activities |
|
|
40,708 |
|
|
|
40,559 |
|
|
|
|
|
|
|
|
|
|
||
Cash flows from investing activities |
|
|
|
|
|
|
|
||
Acquisitions |
|
|
(431,260 |
) |
|
|
- |
|
|
Capital expenditures |
|
|
(761 |
) |
|
|
(2,634 |
) |
|
Proceeds from disposal of assets |
|
|
- |
|
|
|
11 |
|
|
Net cash used in investing activities |
|
|
(432,021 |
) |
|
|
(2,623 |
) |
|
|
|
|
|
|
|
|
|
||
Cash flows from financing activities |
|
|
|
|
|
|
|
||
Proceeds from issuance of Class A shares, net of underwriting discounts and fees |
|
|
278,263 |
|
|
|
- |
|
|
Offering costs |
|
|
(6,997 |
) |
|
|
(116 |
) |
|
Contributions from member |
|
|
120,000 |
|
|
|
- |
|
|
Distributions to member |
|
|
(170,854 |
) |
|
|
(105,165 |
) |
|
Proceeds from term loan |
|
|
265,000 |
|
|
|
100,000 |
|
|
Repayments on term loan |
|
|
(93,750 |
) |
|
|
(62,417 |
) |
|
Proceeds from revolver |
|
|
15,000 |
|
|
|
25,000 |
|
|
Repayments of revolver |
|
|
(35,000 |
) |
|
|
- |
|
|
Debt issuance costs |
|
|
(3,437 |
) |
|
|
(3,104 |
) |
|
Other financing activities, net |
|
|
(318 |
) |
|
|
(193 |
) |
|
Net cash provided by (used in) financing activities |
|
|
367,907 |
|
|
|
(45,995 |
) |
|
Net decrease in cash and cash equivalents |
|
|
(23,406 |
) |
|
|
(8,059 |
) |
|
Cash and cash equivalents - beginning of period |
|
|
37,823 |
|
|
|
25,351 |
|
|
Cash and cash equivalents - end of period |
|
$ |
14,417 |
|
|
$ |
17,292 |
|
|
|
|
|
|
|
|
|
|
||
Comparison of Non-GAAP Financial Measures
Adjusted EBITDA, Adjusted EBITDA Margin, Free Cash Flow and Free Cash Flow Margin are supplemental non-GAAP measures that we use to evaluate current, past and expected future performance. Although these non-GAAP financial measures are important factors in assessing our operating results and cash flows, they should not be considered in isolation or as a substitute for net income or gross margin or any other measures presented under GAAP.
Adjusted EBITDA and Adjusted EBITDA Margin are used to assess the financial performance of our assets over the long term to generate sufficient cash to return capital to equity holders or service indebtedness. We define Adjusted EBITDA as net income (loss) before interest; taxes; depreciation, amortization, depletion and accretion; share-based compensation; non-recurring transaction-related expenses and other non-cash or non-recurring expenses. We define Adjusted EBITDA Margin as Adjusted EBITDA divided by total revenues.
We believe Adjusted EBITDA and Adjusted EBITDA Margin are useful because they allow us to more effectively evaluate our operating performance and compare the results of our operations from period to period, and against our peers, without regard to our financing methods or capital structure. We exclude the items listed above from net income (loss) in arriving at Adjusted EBITDA and Adjusted EBITDA Margin because these amounts can vary substantially from company to company within our industry depending upon accounting methods, book values of assets, capital structures and the method by which the assets were acquired.
The following table sets forth a reconciliation of net income as determined in accordance with GAAP to Adjusted EBITDA and Adjusted EBITDA Margin for the periods indicated.
|
Three Months Ended |
|
|||||||||
|
September 30, 2024 |
|
|
June 30, 2024 |
|
|
September 30, 2023 |
|
|||
|
(In thousands) |
|
|||||||||
Net (loss) income |
$ |
(2,756 |
) |
|
$ |
(57,653 |
) |
|
$ |
16,633 |
|
Adjustments: |
|
|
|
|
|
|
|
|
|||
Depreciation, depletion, amortization and accretion |
|
2,038 |
|
|
|
2,112 |
|
|
|
2,562 |
|
Interest expense, net |
|
7,071 |
|
|
|
6,280 |
|
|
|
2,893 |
|
Income tax (benefit) expense |
|
(1,128 |
) |
|
|
137 |
|
|
|
104 |
|
EBITDA |
|
5,225 |
|
|
|
(49,124 |
) |
|
|
22,192 |
|
Adjustments: |
|
|
|
|
|
|
|
|
|||
Share-based compensation - Incentive Units (1) |
|
9,830 |
|
|
|
71,762 |
|
|
|
(6,933 |
) |
Share-based compensation - RSUs |
|
1,794 |
|
|
|
- |
|
|
|
- |
|
Transaction-related expenses (2) |
|
351 |
|
|
|
774 |
|
|
|
141 |
|
Non-recurring (3) |
|
7,825 |
|
|
|
- |
|
|
|
- |
|
Other |
|
(13 |
) |
|
|
- |
|
|
|
- |
|
Adjusted EBITDA |
$ |
25,012 |
|
|
$ |
23,412 |
|
|
$ |
15,400 |
|
Net (loss) income margin |
|
(10 |
%) |
|
|
(222 |
%) |
|
|
93 |
% |
Adjusted EBITDA Margin |
|
88 |
% |
|
|
90 |
% |
|
|
87 |
% |
(1) Share-based compensation – Incentive Units for the three months ended September 30, 2024, consists of $9.8 million related to the Incentive Units. Share-based compensation – Incentive Units for the three months ended June 30, 2024, consists of $71.8 million related to the incentive units of WaterBridge NDB LLC (the parent entity of the Company prior to the Division) ("NDB Incentive Units"). Share-based compensation – Incentive Units for the three months ended September 30, 2023, consists only of the NDB Incentive Units. NDB Incentive Units were liability awards resulting in periodic fair value remeasurement prior to the Division. Subsequent to the Offering, any actual cash expense associated with such Incentive Units is borne solely by LandBridge Holdings LLC and not the Company. Distributions attributable to Incentive Units are based on returns received by investors of LandBridge Holdings LLC once certain return thresholds have been met and are neither an obligation of the Company nor taken into consideration for distributions to investors in the Company. |
|||||||||||
| (2) Transaction-related expenses consist of non-capitalizable transaction costs associated with both completed or attempted acquisitions, debt amendments and entity structuring charges. | |||||||||||
(3) Non-recurring expenses consist primarily of $5.0 million in Offering-related employee bonuses and $2.6 million related to lease termination expense. |
|||||||||||
Free Cash Flow and Free Cash Flow Margin are used to assess our ability to repay our indebtedness, return capital to our shareholders and fund potential acquisitions without access to external sources of financing for such purposes. We define Free Cash Flow as cash flow from operating activities less investment in capital expenditures. We define Free Cash Flow Margin as Free Cash Flow divided by total revenues.
We believe Free Cash Flow and Free Cash Flow Margin are useful because they allow for an effective evaluation of both our operating and financial performance, as well as the capital intensity of our business, and subsequently the ability of our operations to generate cash flow that is available to distribute to our shareholders, reduce leverage or support acquisition activities.
The following table sets forth a reconciliation of cash flows from operating activities determined in accordance with GAAP to Free Cash Flow and Free Cash Flow Margin, respectively, for the periods indicated.
|
Three Months Ended |
|
|||||||||
|
September 30, 2024 |
|
|
June 30, 2024 |
|
|
September 30, 2023 |
|
|||
|
(In thousands) |
|
|||||||||
Net cash provided by operating activities |
$ |
7,450 |
|
|
$ |
16,043 |
|
|
$ |
16,209 |
|
Net cash used in investing activities |
|
(1,053 |
) |
|
|
(375,807 |
) |
|
|
(234 |
) |
Cash provided by (used in) operating and investing activities |
|
6,397 |
|
|
|
(359,764 |
) |
|
|
15,975 |
|
Adjustments: |
|
|
|
|
|
|
|
|
|||
Acquisitions |
|
750 |
|
|
|
375,438 |
|
|
|
- |
|
Proceeds from disposal of assets |
|
- |
|
|
|
- |
|
|
|
- |
|
Free Cash Flow |
$ |
7,147 |
|
|
$ |
15,674 |
|
|
$ |
15,975 |
|
Operating cash flow margin (1) |
|
26 |
% |
|
|
62 |
% |
|
|
91 |
% |
Free Cash Flow Margin |
|
25 |
% |
|
|
60 |
% |
|
|
90 |
% |
(1) Operating cash flow data is calculated by dividing net cash provided by operating activities by total revenue. |
|||||||||||
View source version on businesswire.com: https://www.businesswire.com/news/home/20241106070670/en/