Market Momentum: Your Weekly Financial Forecast
What to expect for July 8 - July 12, 2024
Originally posted at https://volumeleaders.substack.com
Weekly Wrap-Up
In the week of July 1 through July 5, 2024, the U.S. financial markets experienced significant developments across various sectors. The major indices, including the S&P 500 and Nasdaq, reached new all-time highs. The Nasdaq's 3.5% increase marked its tenth positive week out of the past eleven, while the S&P 500 posted a weekly return of 2.0%. The Dow Jones Industrial Average also saw gains, though more modest at 0.7%. The Russell 2000 Index, which tracks small-cap stocks, fell by 1.0%, extending its year-to-date underperformance.
Economic data released during the week presented a mixed picture. The June jobs report exceeded expectations with a gain of 206,000 jobs, higher than the forecasted 190,000. However, the unemployment rate rose to 4.1%, the highest level since November 2021. Moreover, job growth figures for April and May were revised downward by a total of 111,000, indicating a slowdown in employment growth. Wage growth was steady, with average hourly earnings rising by 0.3% for the month and 3.9% year-over-year, slightly down from May's 4.1%.
Bond yields declined over the week, reinforcing expectations of a potential rate cut by the Federal Reserve later in the year. The yield on the 10-year U.S. Treasury fell to 4.28% from 4.37% the previous week. This decline in yields was observed across various maturities, with the yields of 2- and 30-year notes also decreasing. Lower yields generally make equities more attractive relative to bonds, contributing to the overall market gains.
Oil prices climbed for the fourth consecutive week, reaching their highest level in over two months. U.S. crude traded above $83 per barrel, supported by a report showing a decline in U.S. oil inventories, which analysts expect to remain tight throughout the summer. The rise in oil prices reflected broader market optimism and expectations of sustained demand.
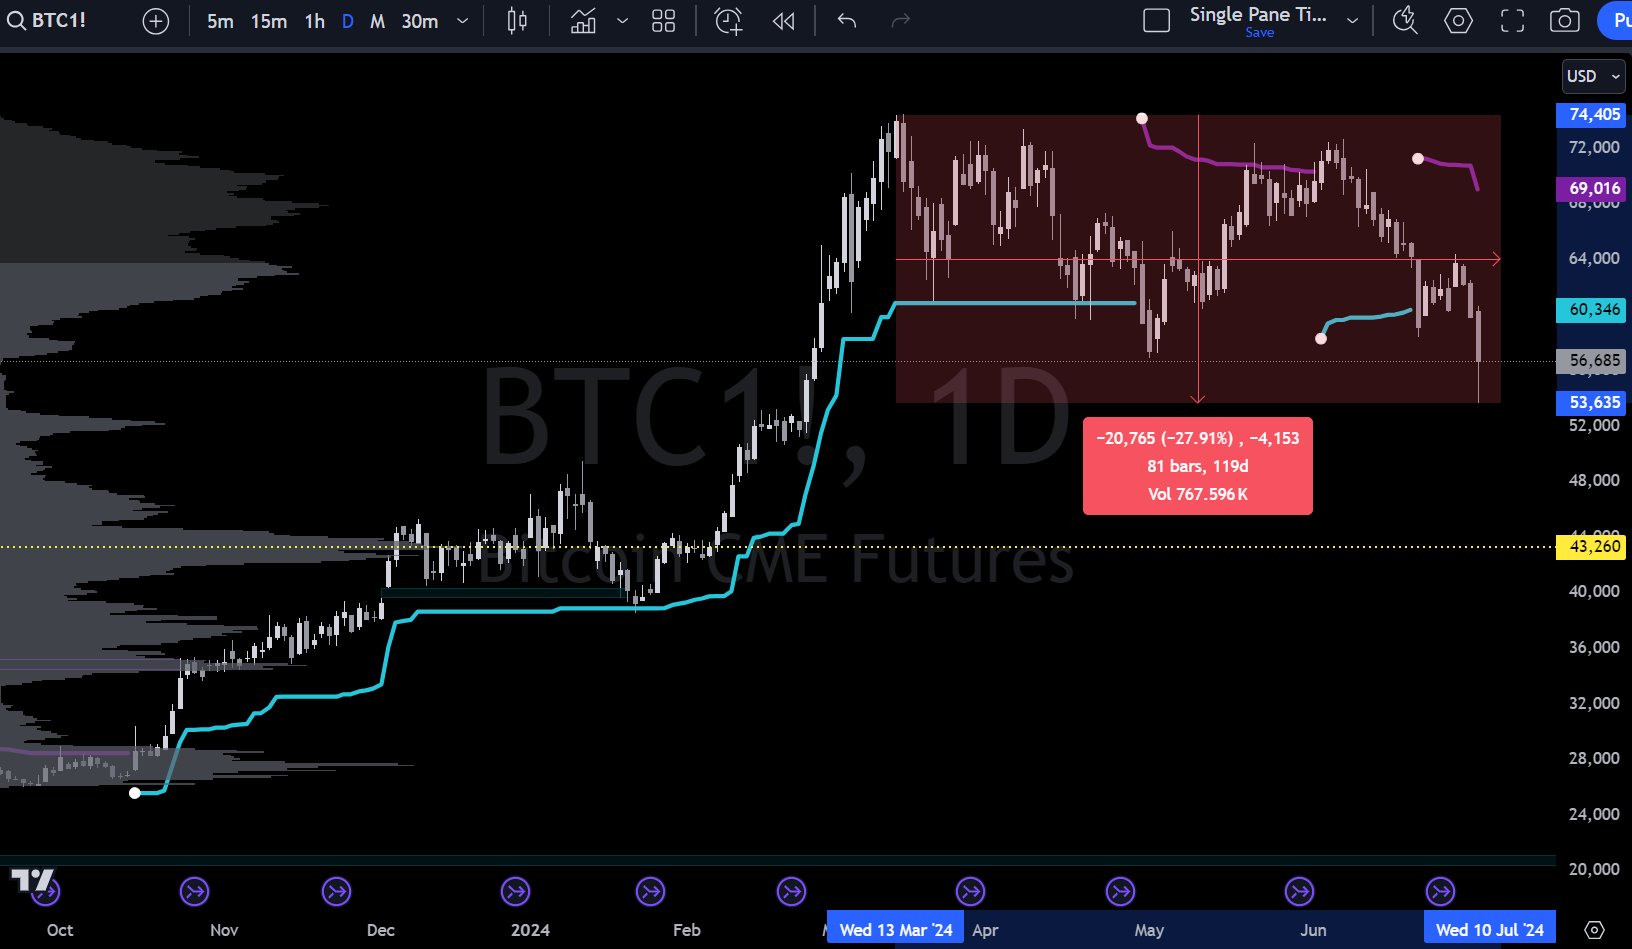
In the cryptocurrency market, Bitcoin experienced a significant drop, falling below $54,000 at one point on Friday, down ~27%, the lowest level in more than four months. The price partially recovered to around $56,500 by afternoon trading, down from over $71,000 as recently as June 5. This volatility in the cryptocurrency market was attributed to a combination of regulatory concerns and profit-taking by investors.
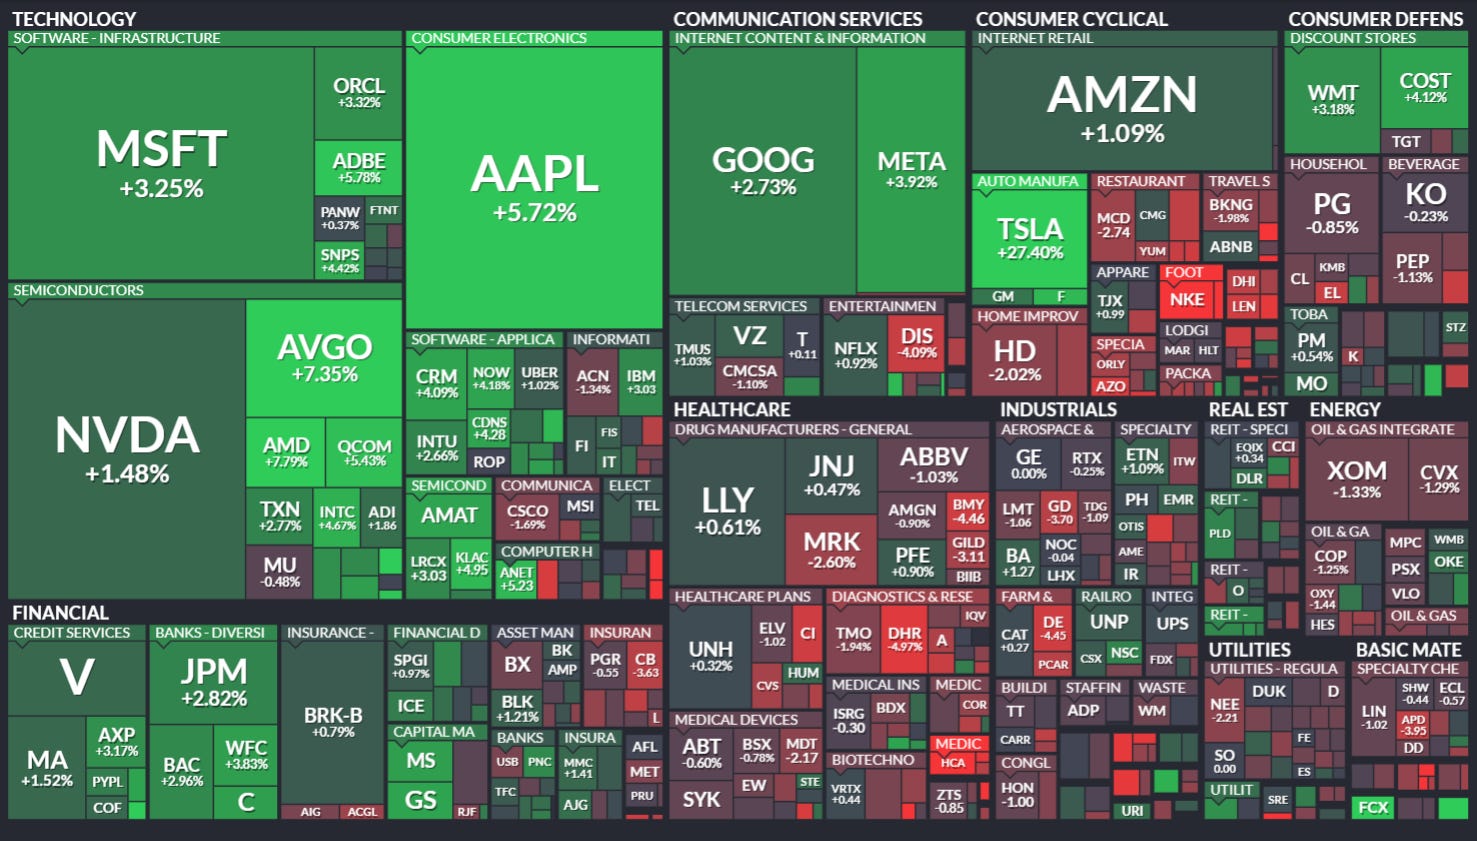
The technology sector, especially semiconductor stocks, continued to drive market performance. Nvidia's significant market value rise underscored the dominance and investor enthusiasm for tech companies, particularly those with strong AI components. Other major tech and communications services sector stocks also topped the leader board, with Meta Platforms advancing more than 5% despite a lack of specific stock-related news. Tesla saw a 2% increase, benefiting from higher-than-expected quarterly deliveries and strong sales in China.

Defensive sectors such as utilities and staples also performed well, supported by the decline in Treasury yields. However, financials, industrials, and energy sectors saw declines, reflecting investor concerns about a faltering economy and its impact on cyclical stocks.
Dividend payments by S&P 500 companies saw a modest increase in the second quarter, with total payouts rising to $153.4 billion from $151.6 billion in the first quarter. This increase was partly due to several large-cap stocks initiating dividend payments for the first time, providing additional income for investors.
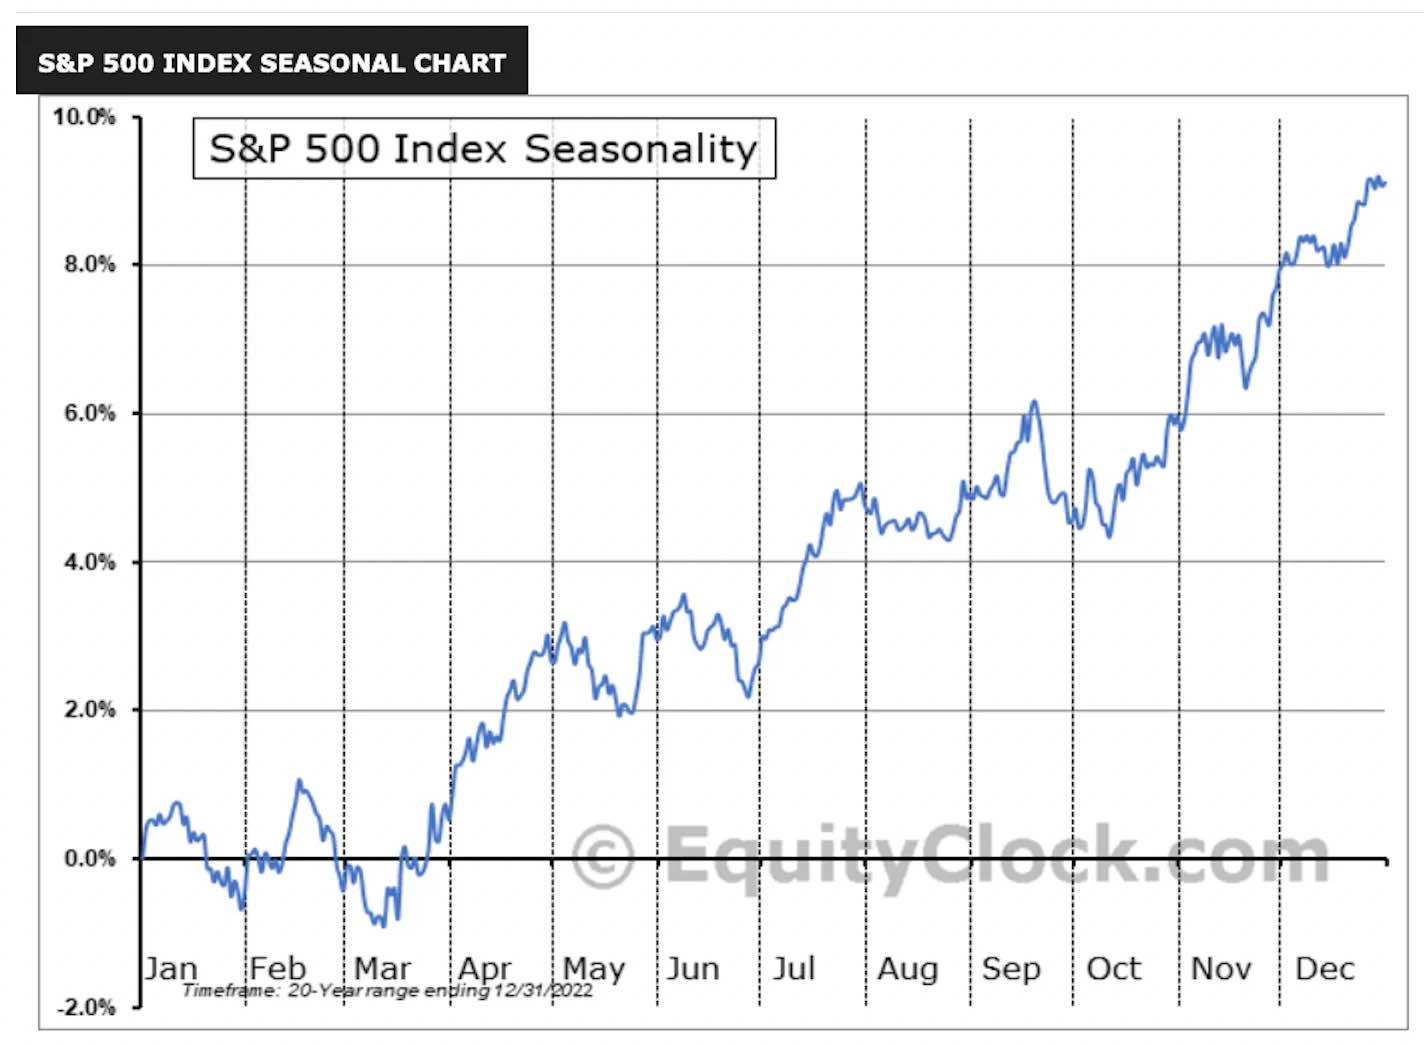
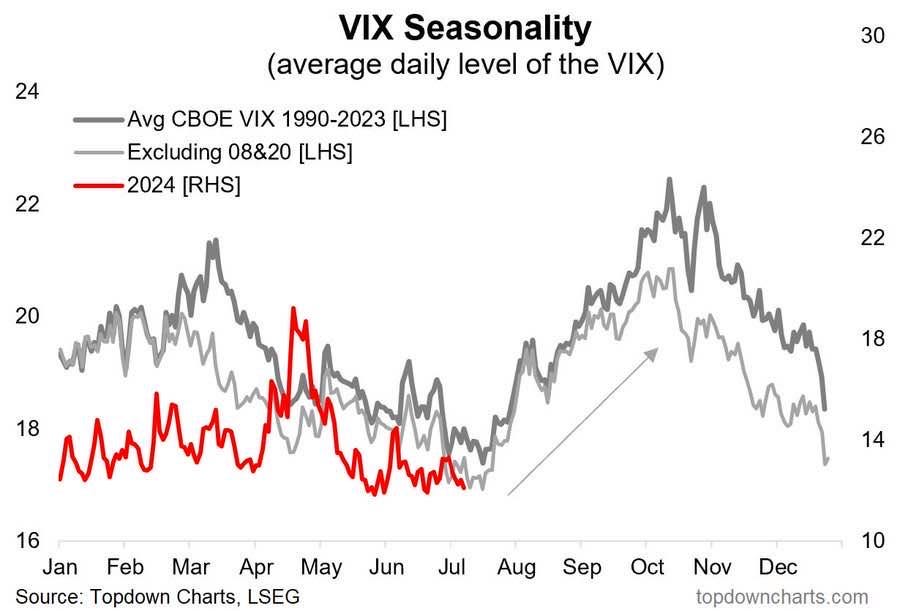
Looking ahead, the markets will be looking at the upcoming Consumer Price Index (CPI) report, which is expected to indicate whether the stable inflation seen in May extended into June. The May CPI report had shown an annual inflation rate of 3.3%, slightly better than the forecasted 3.4% but unchanged from April's figure. A cooler reading in the next CPI report could further support investor hopes for a September rate cut by the Federal Reserve. Will historical seasonality in the VIX repeat in 2024 or will this year’s market dynamics continue to defy and confuse?
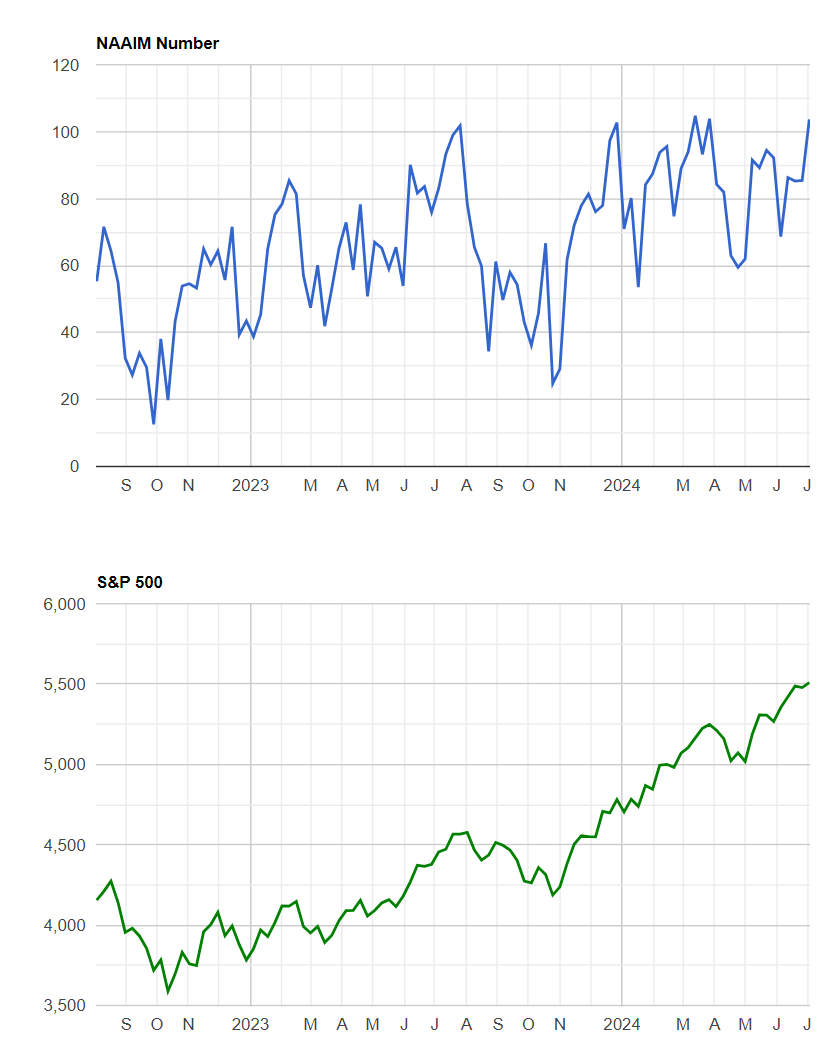
Overall, the week of July 1 through July 5, 2024, was characterized by record highs in major indices, driven by strong performances in the tech, energy, and real estate sectors. Economic indicators presented a mixed but overall positive outlook, with retail sales growth slowing but industrial production showing resilience. Investor optimism was fueled by expectations of potential interest rate cuts by the Federal Reserve, contributing to a broadly bullish market sentiment. NAAIM Exposure Index is at 103.66 confirms that, on average, most are at least fully long with some exposure to leveraged longs (NAAIM vs S&P given below for comparison).
The cryptocurrency market experienced significant volatility, while oil prices continued their upward trend. Defensive sectors performed well amid declining bond yields, and dividend payments by S&P 500 companies saw a modest increase. Investors remained focused on potential monetary policy adjustments and upcoming economic indicators that could provide further insights into the health of the U.S. economy.
Institutional Dollar Index For Major Indices
The Institutional Dollar Index (IDI) expresses institutional volume as a percent of total daily volume by day. High values mean large institutional involvement and may suggest a directional commitment by larger players; low values mean low institutional involvement and suggest a continuation of current conditions. Like all institutional flow we look at, the direction can’t be known by this data itself; what is most important is the subsequent reaction to liquidity when it shows relatively high readings.
Major Indices Inst. S/R Levels
I’m trying a new format for the stack this week that is simpler and more to the point. I’m also providing you with exact institutional positioning for medium-time-frames so that we hopefully have some actionable levels all week long until the next stack; institutional positioning for day traders and swing/position-traders is in the VL platform with exact prices for every single ticker for you to nail entries and ride positions longer.
If I’ve covered something in the past that you liked, let me know in the comments. I try to communicate as much as I can about what I see in the charts without getting into the weeds on a lot of technical things that may not resonate with the vast majority of readers, so please let me know how I can best support you!
SPDR S&P 500 (NYSE:SPY)
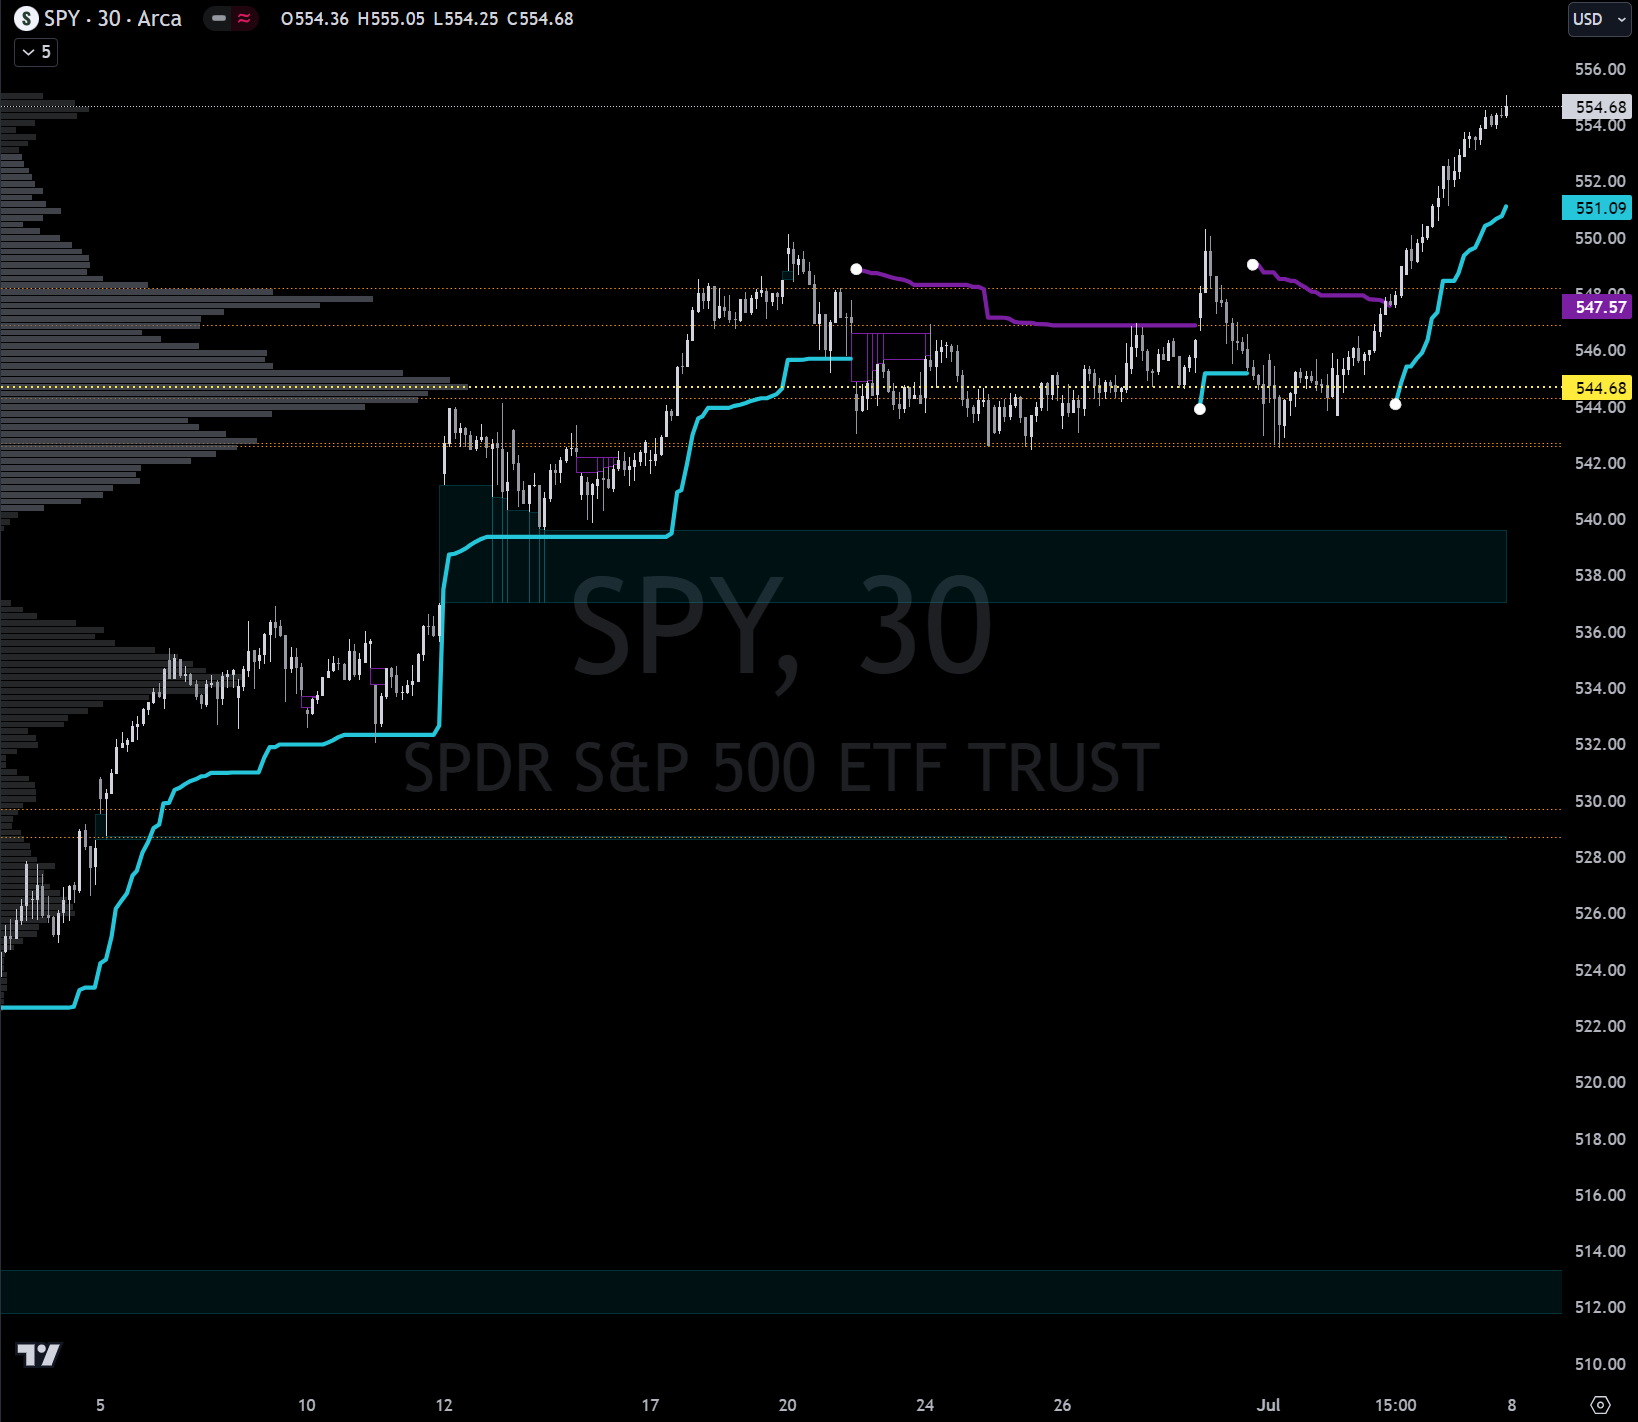
Last week I sought balance and we saw the bottom of bal where there is institutional positioning offering support that was, as expected, responsive; that was your one chance to buy the dip because we then traversed the balance area where I mistakenly fought the tape on the topside breakout. All upside price extensions called for in last week’s stack have been met. We are potentially looking at a new place to auction here. Upper-bound of this new auction would be $558 where rips could be sold and the lower-bound would be $550 where, if all things remain the same, I would expect dips to be bought. Keep an eye on VolumeLeaders.com to see if institutions setup the guardrails near these expected targets. There is the possibility that we skip this auction and continue to go topside in a longer imbalance move. The bottom-line right now is to avoid top-picking; let structure develop and institutions reveal positions to align your trades with. All institutional levels (orange dotted lines) for this timeframe are currently under price: $546.90, $542.70, $529.70, $528.70, $548.20, $542.60, $544.30 which is a very bullish development. Mark these on your charts if they aren’t already there; keep an eye on the VL platform for new developments throughout the week.
Invesco QQQ Trust, Series 1 (NASDAQ:QQQ)
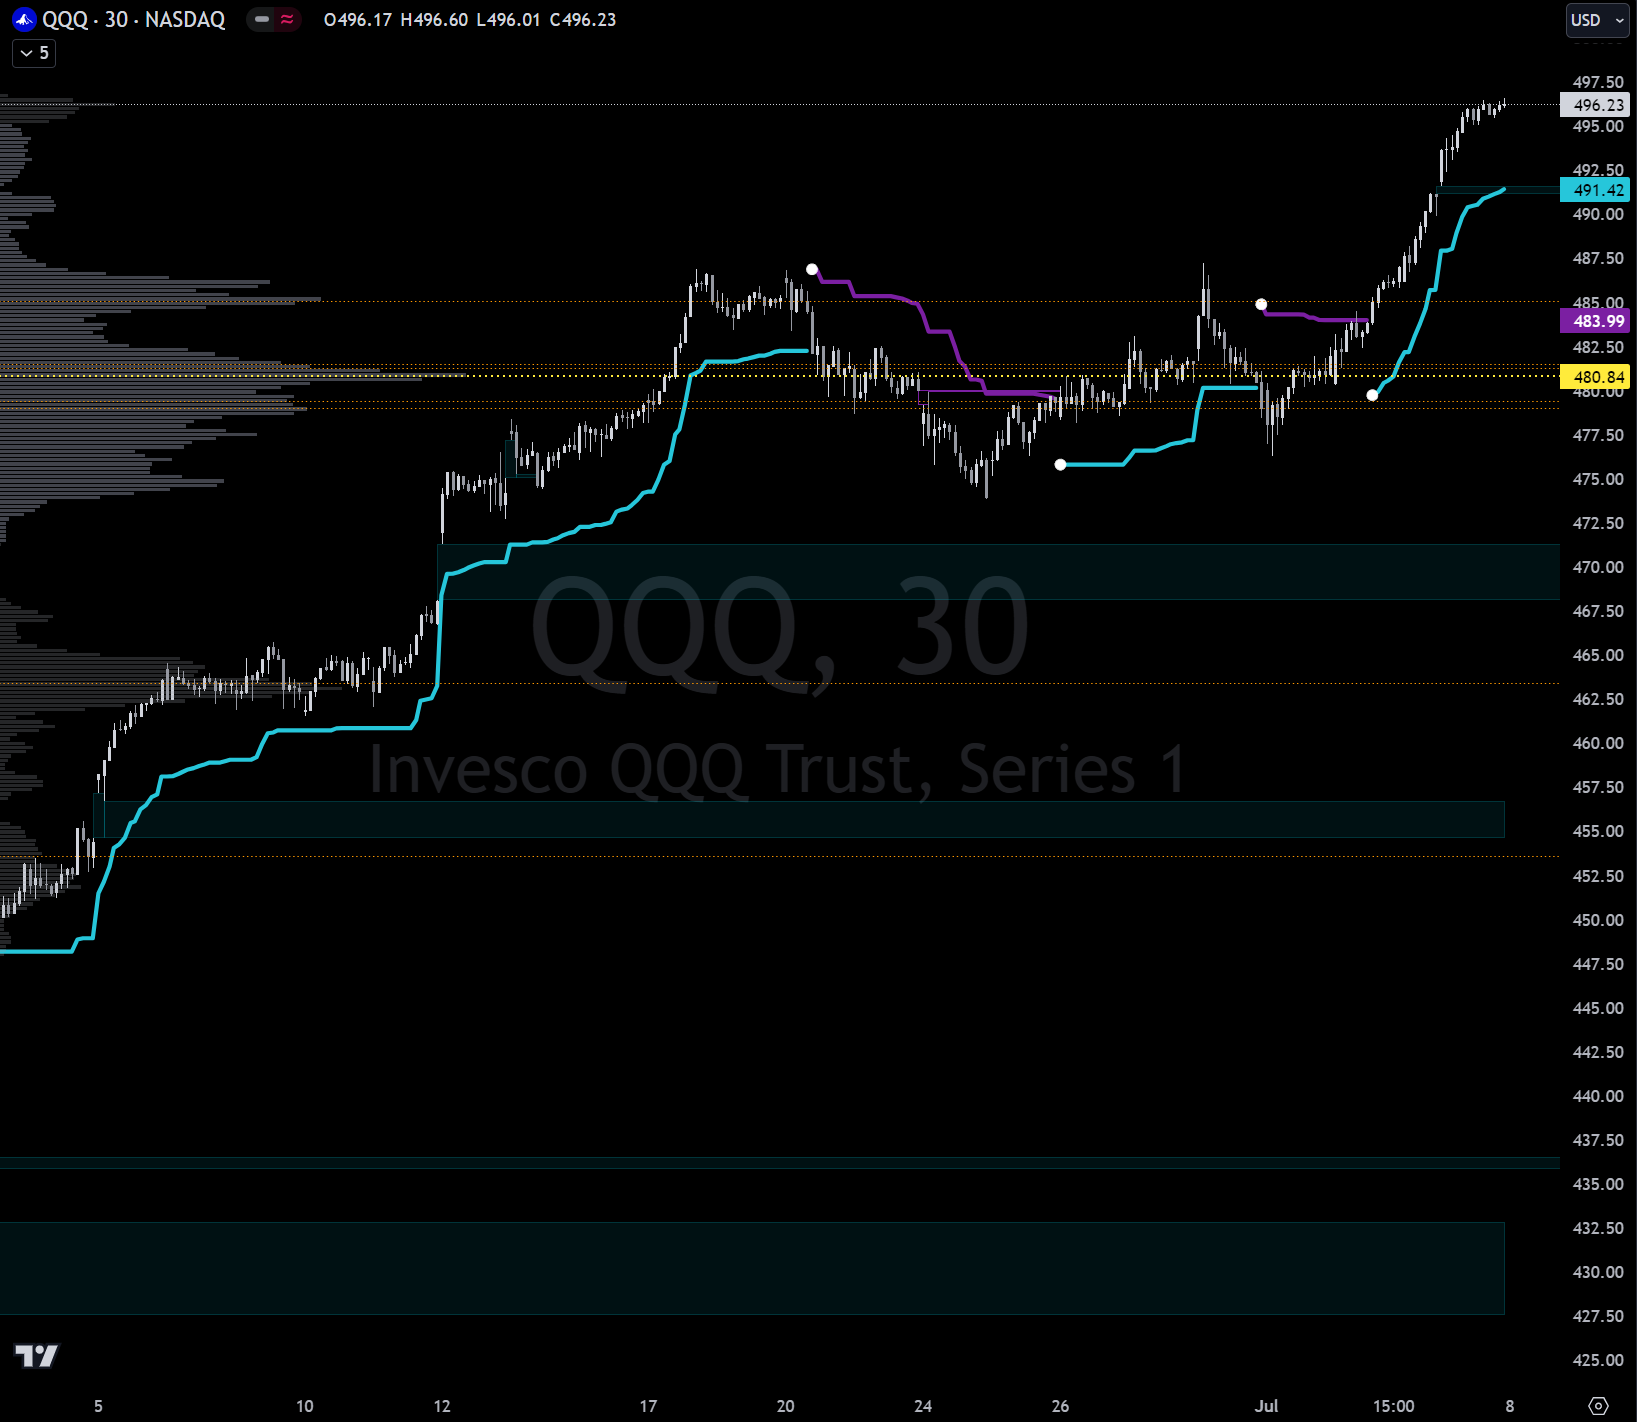
The Q’s are also at their price extension from $480. If we balance here in a new auction, price should box itself in between $488 on the bottom-side and $504 on the top-side. Large-cap tech last week caught an unexpected bid after we saw what we thought was a decent start to some rotation. Balance leads to imbalance which is where we find ourselves now, once again trending higher. I urge all traders with short-itch that needs scratching to exercise restraint and let someone else show you where the top is before you try your hand; let structure develop first and then plan your moves accordingly. Here again, we find all current institutional support and resistance levels under us: $481.50, $481.30, $485.10, $453.60, $479.40, $463.40, $479.00. Mark ‘em up and let’s see what clues institutions drop for us as the week develops.
IShares Russell 2000 ETF(NYSE:IWM)
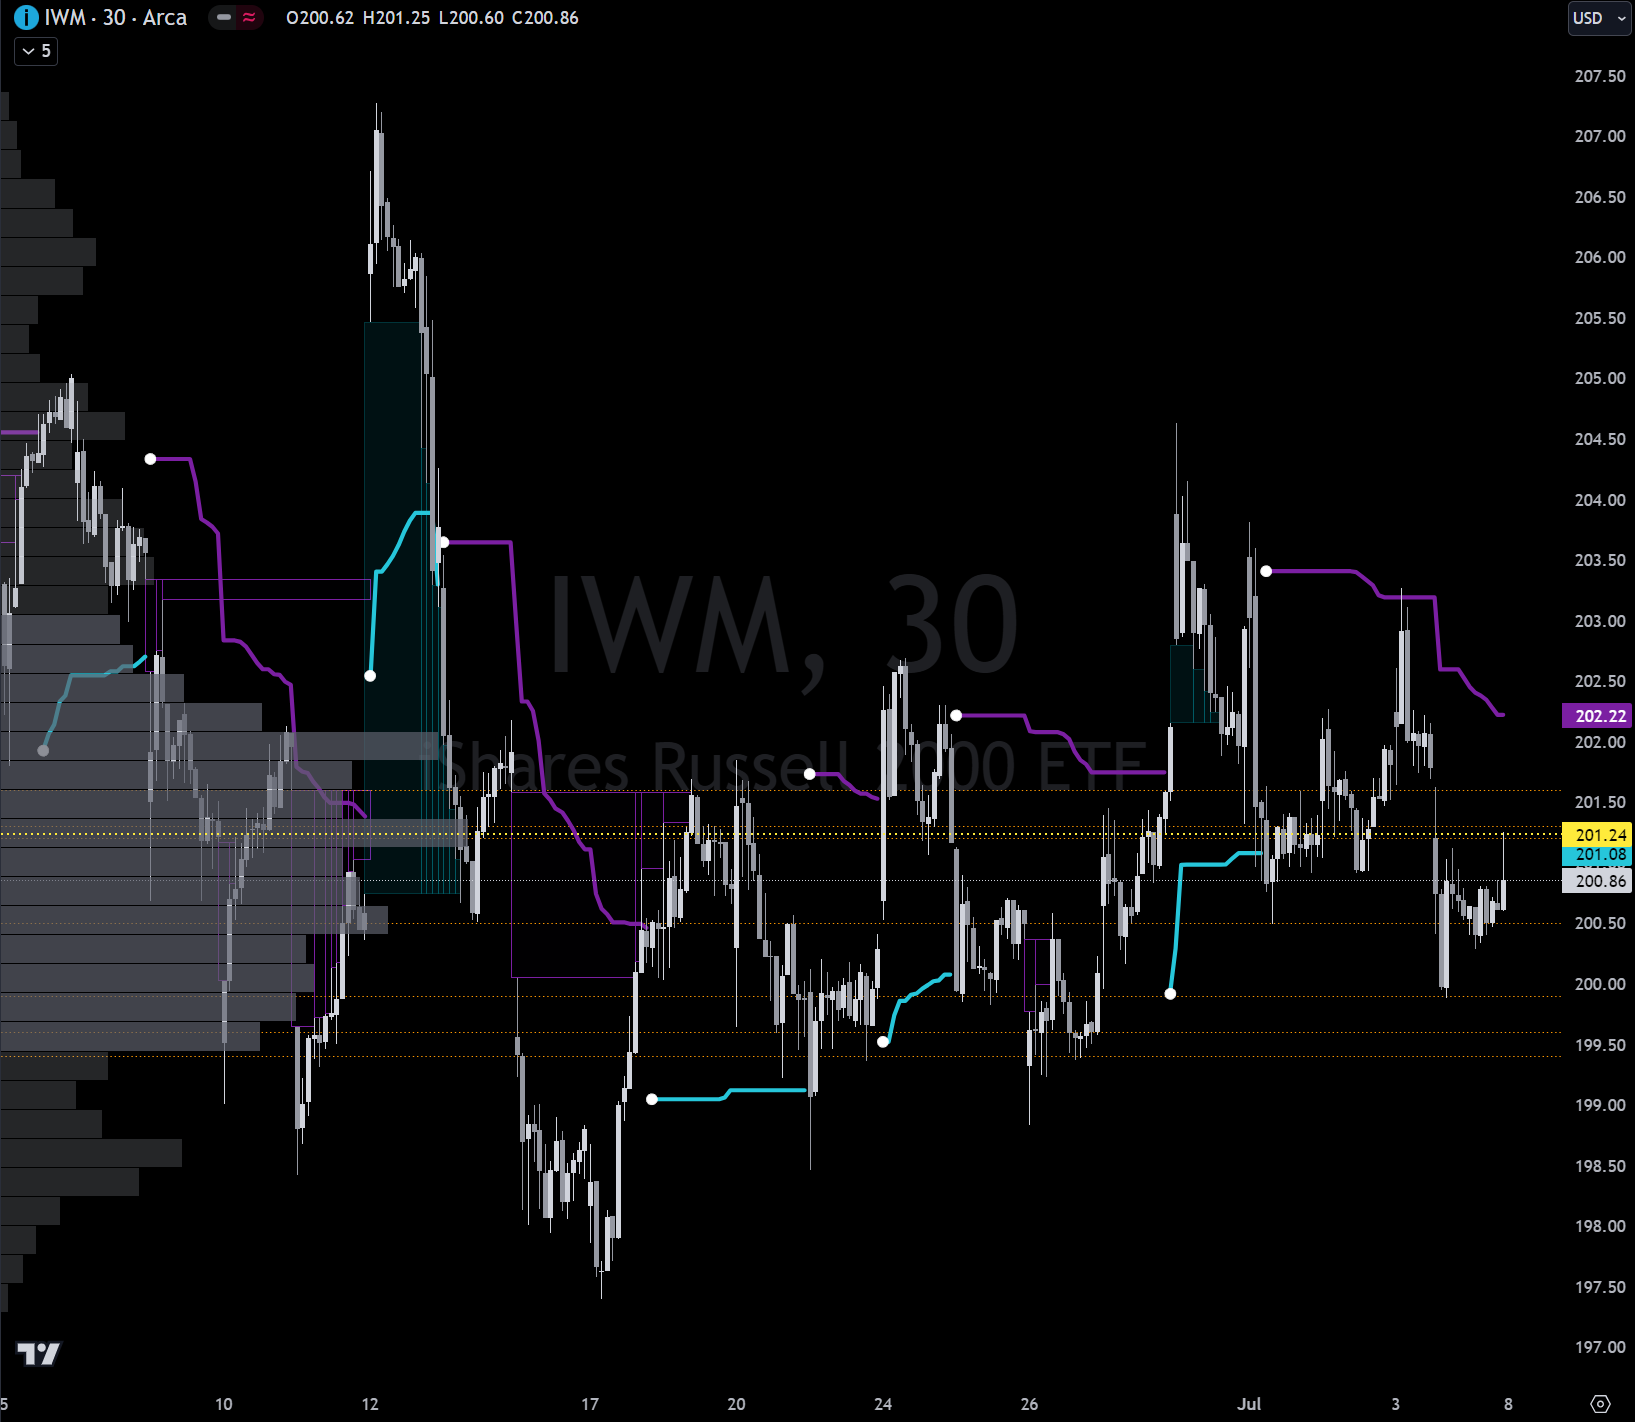
Consolidation continues as price keeps coiling in this laggard. See past stacks for my higher time frame analysis. Institutions are piling in here for the move. I am personally favoring longs as indicated in the last stack but in full-disclosure have no position right now. This is clearly a rates-play which itself is a story that has unfolded in unpredictable ways this year; all eyes are on the elusive cut and whether it manages to manifest. Ultimately, we can’t know which way price will break, but when something has been consolidating this hard for so long, you don’t want to fight the tape when it goes. Current S/R levels to mark-up are: $201.30, $201.60, $199.40, $200.50, $199.60, $199.90, $201.20.
SPDR Dow Jones Industrial Average ETF(NYSE:DIA)
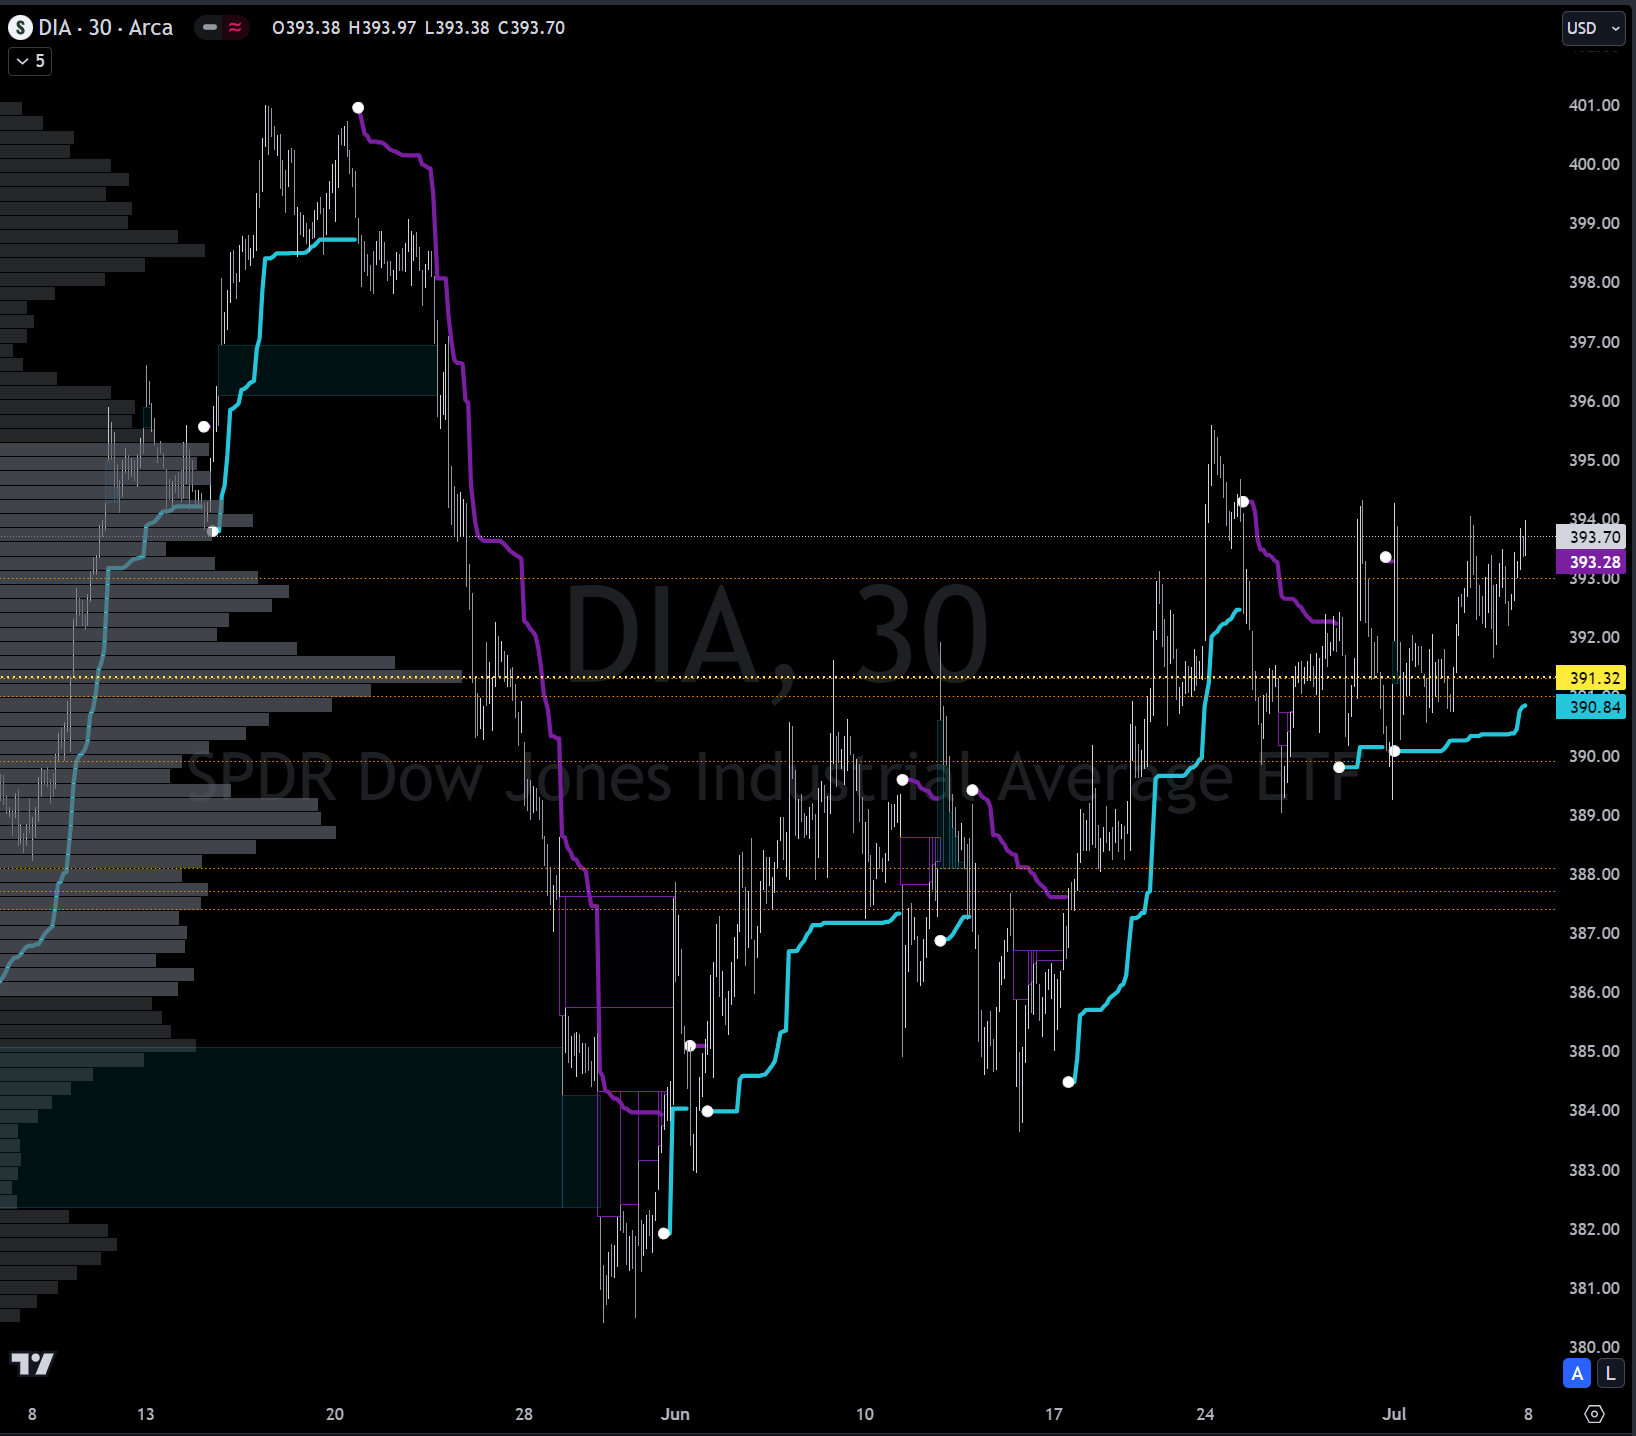
Like IWM, we see consolidation but of a slightly different nature. IWM keeps putting in lower-highs and higher-lows; DIA keeps putting in higher-lows and facing rejection at POC (yellow line) and a few institutional prints above price right now. This also look quite bullish and inventory looks ready to move higher, perhaps suggesting a move to $403-ish if we do get the break-up. In the event of a break-down, we’ve got prints below that have buoyed price. Mark these up on your charts: $387.40, $387.70, $391.30, $391.00, $393.00, $389.90, $388.10.
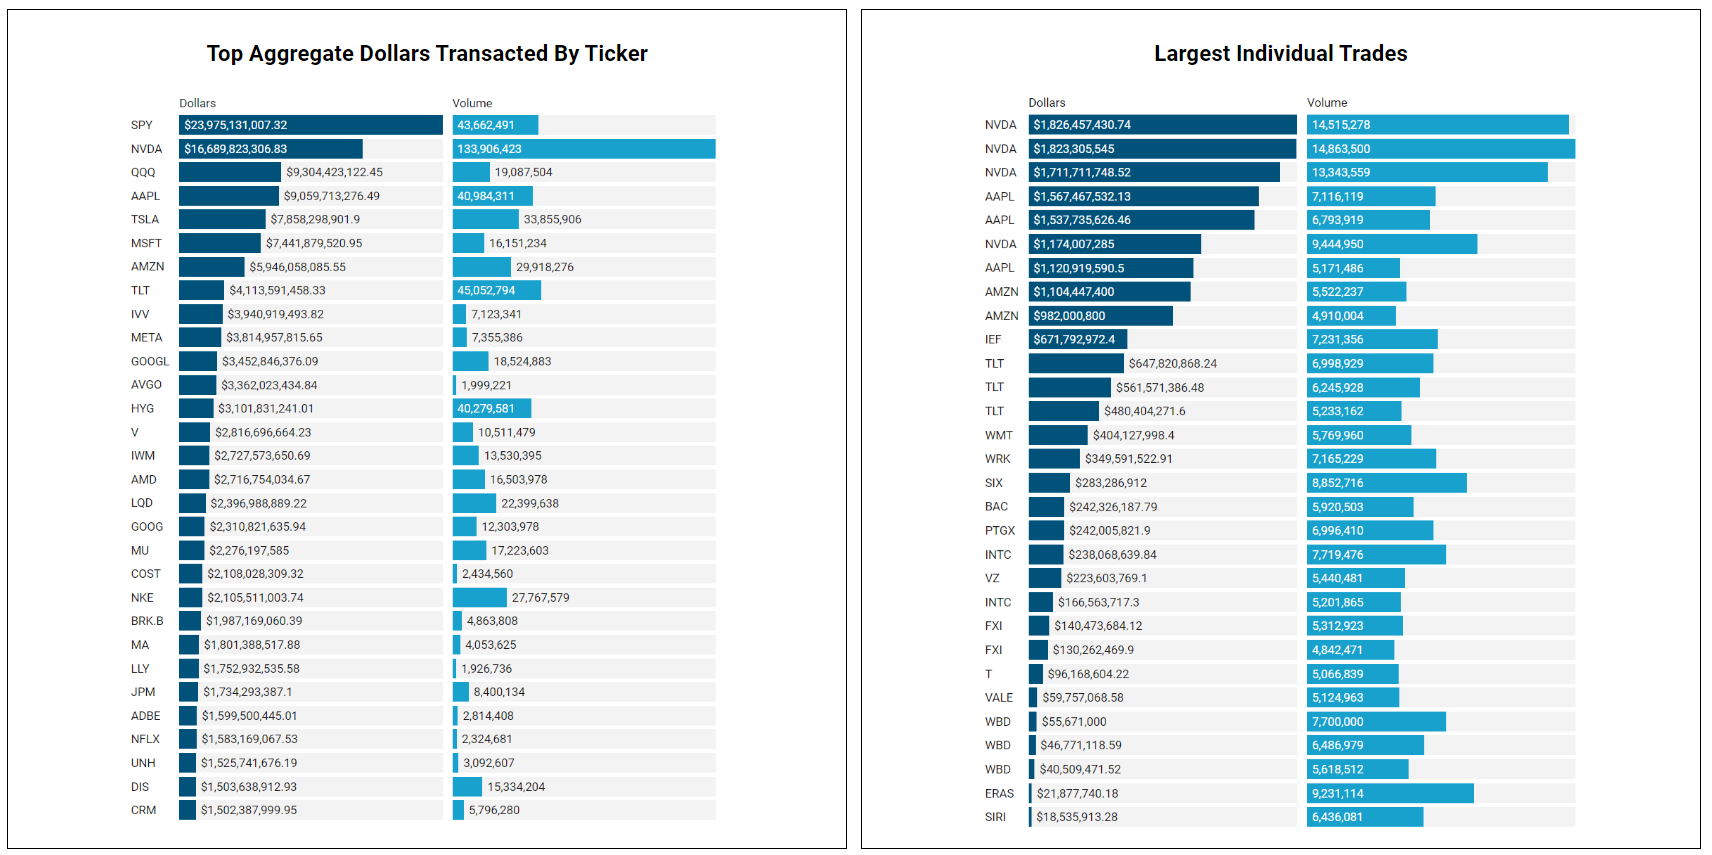
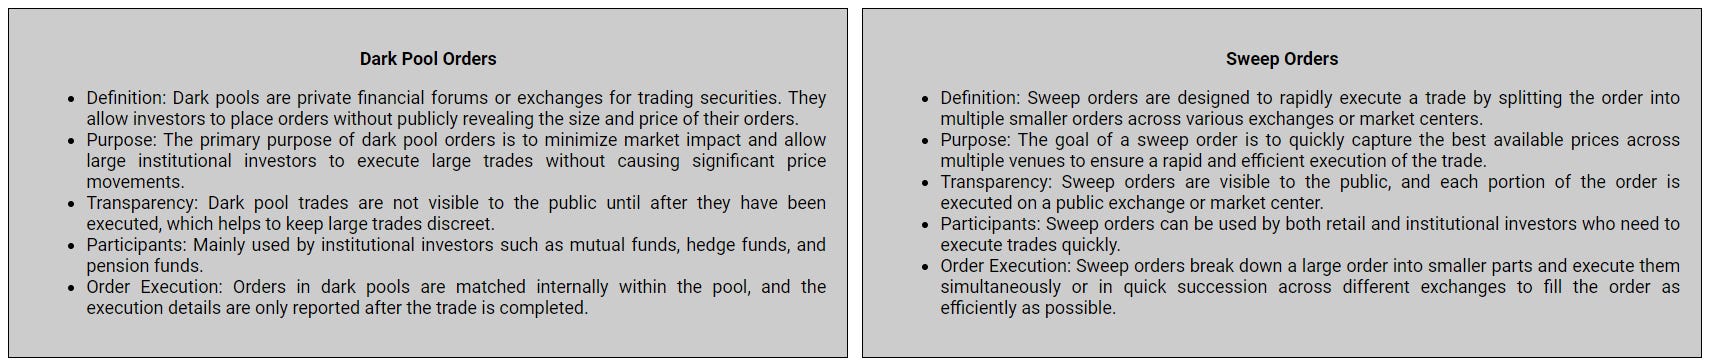
Top Institutional Order Flow
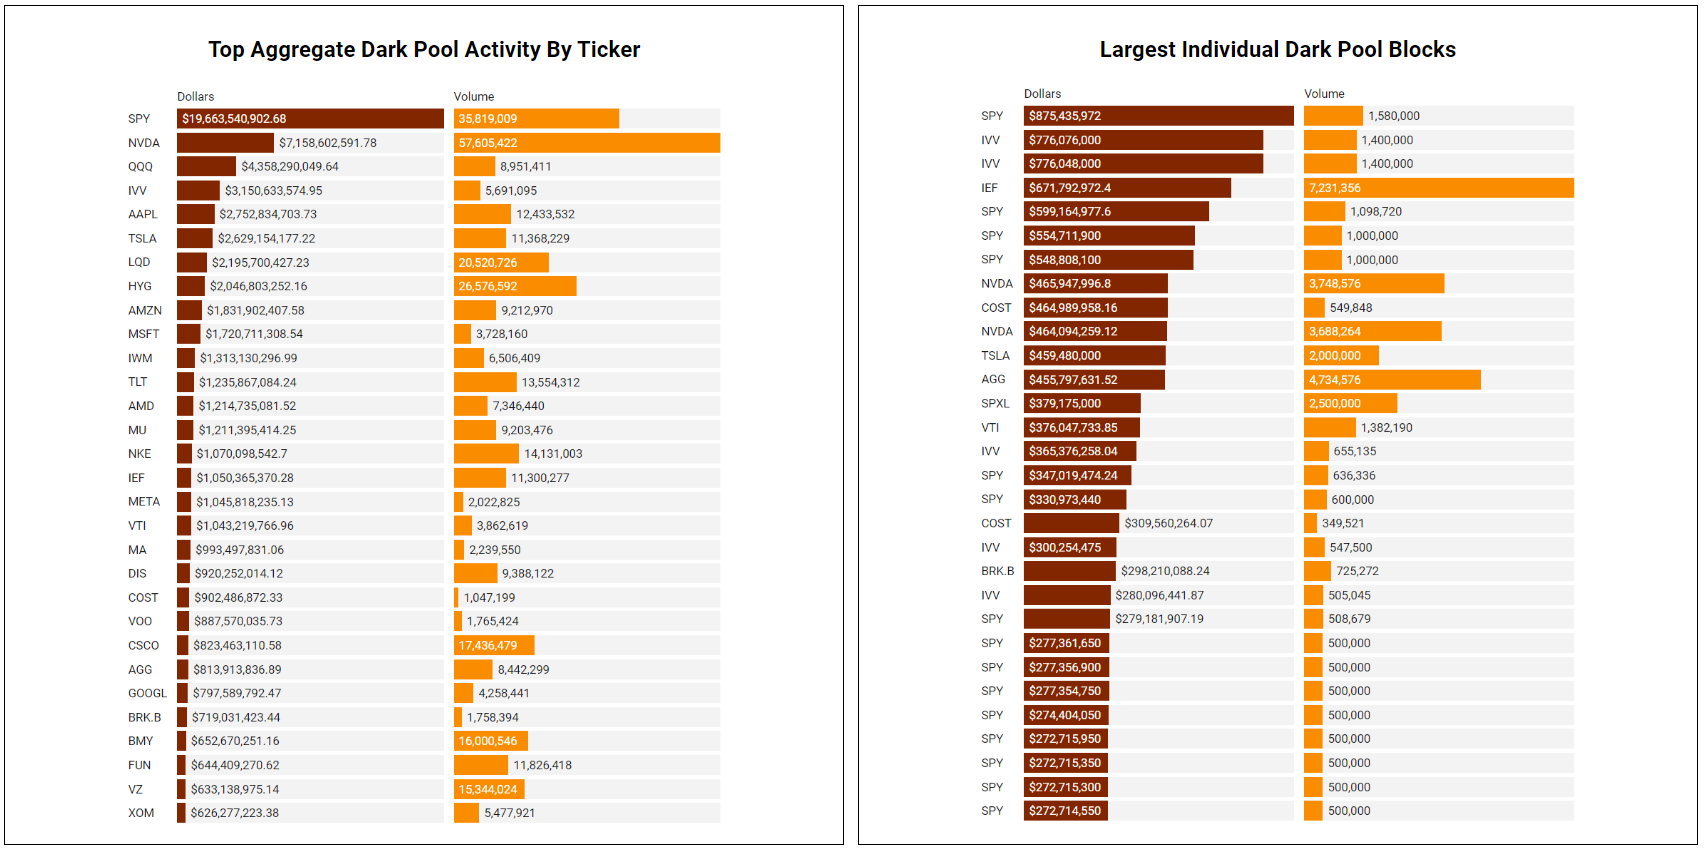
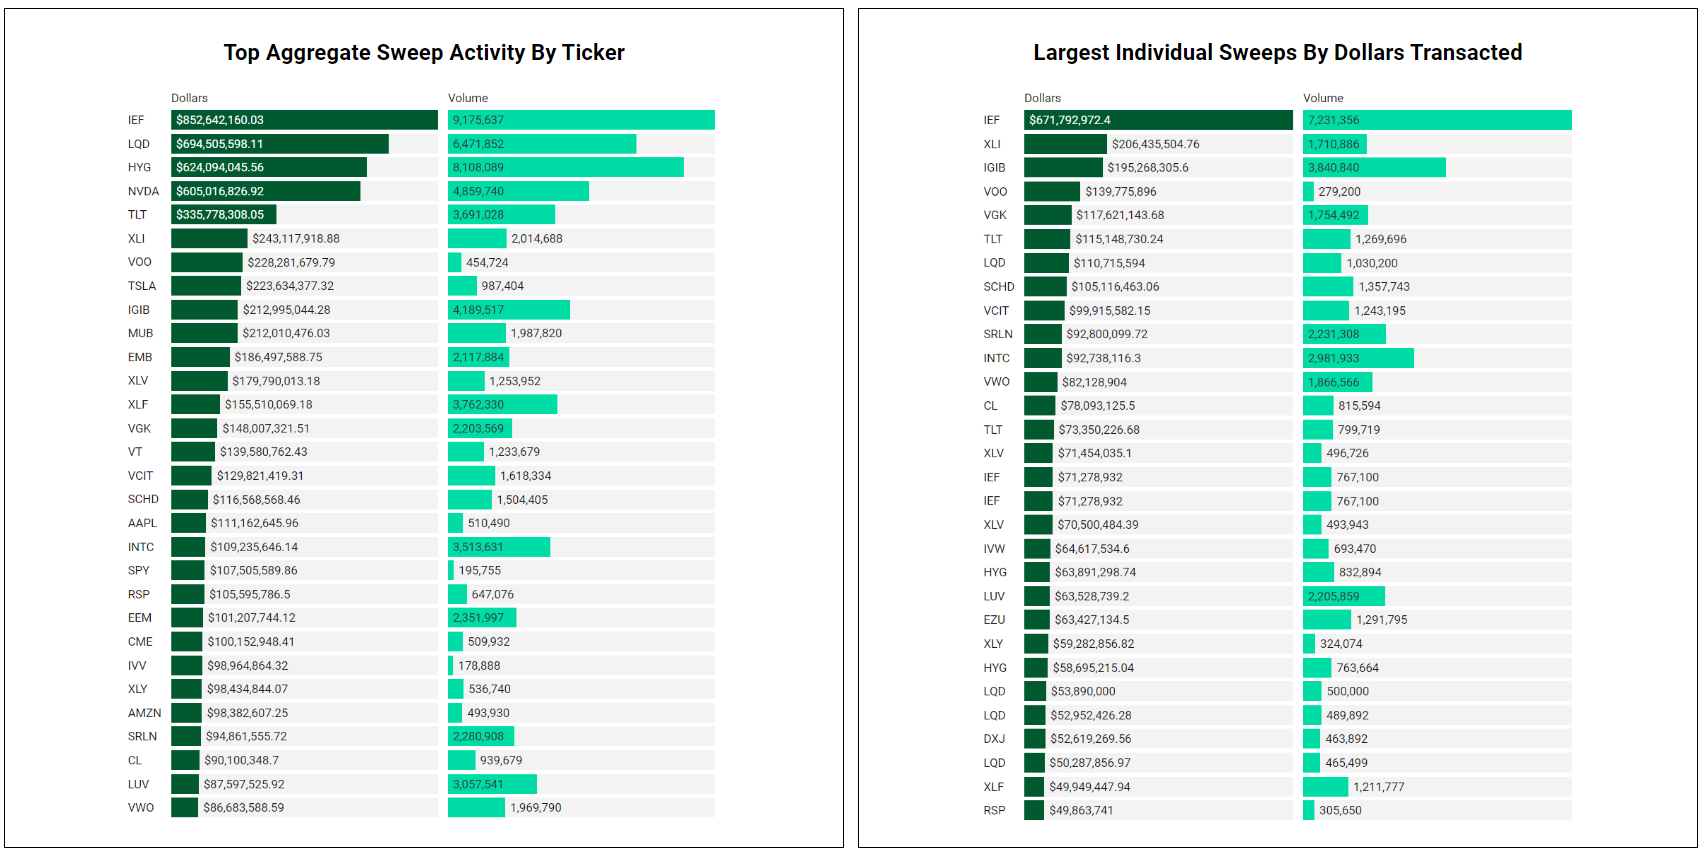
There are often great trades ideas or sources for inspiration in these prints. Only the top 30 of each group are shown but the full results are available in VL for you to browse at your leisure. Don’t forget to setup real-time alerts inside the platform so you never miss institutional order flow that piques your interest. Blue charts include all trade types including blocks on lit exchanges; red/orange charts are dark pool only trades; green charts are sweeps only.
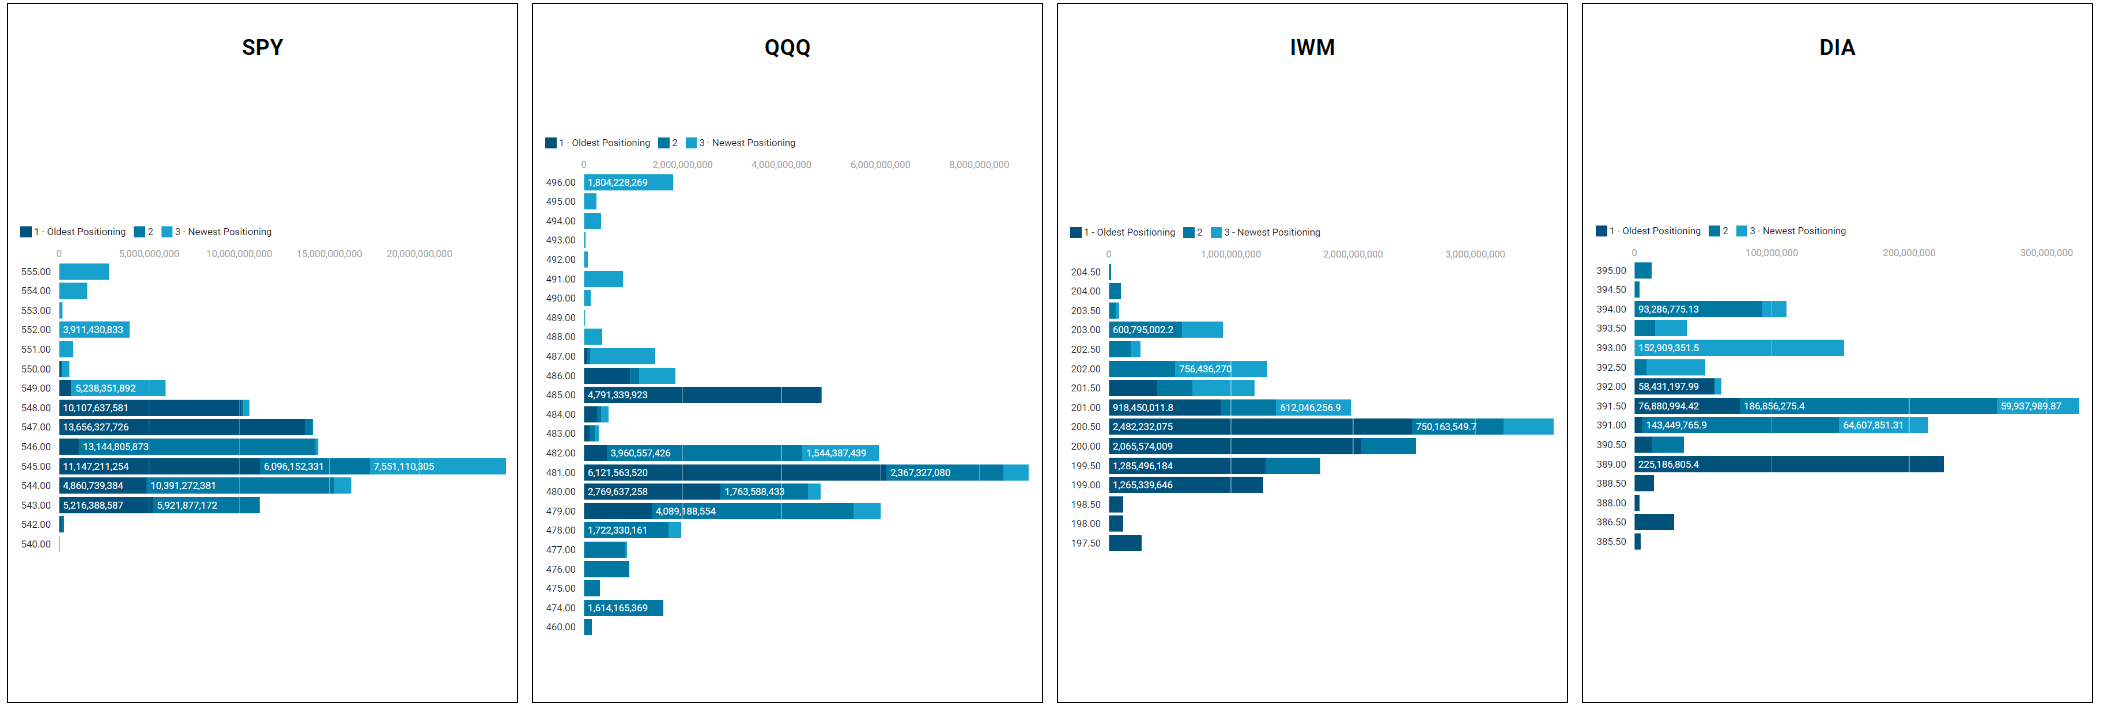
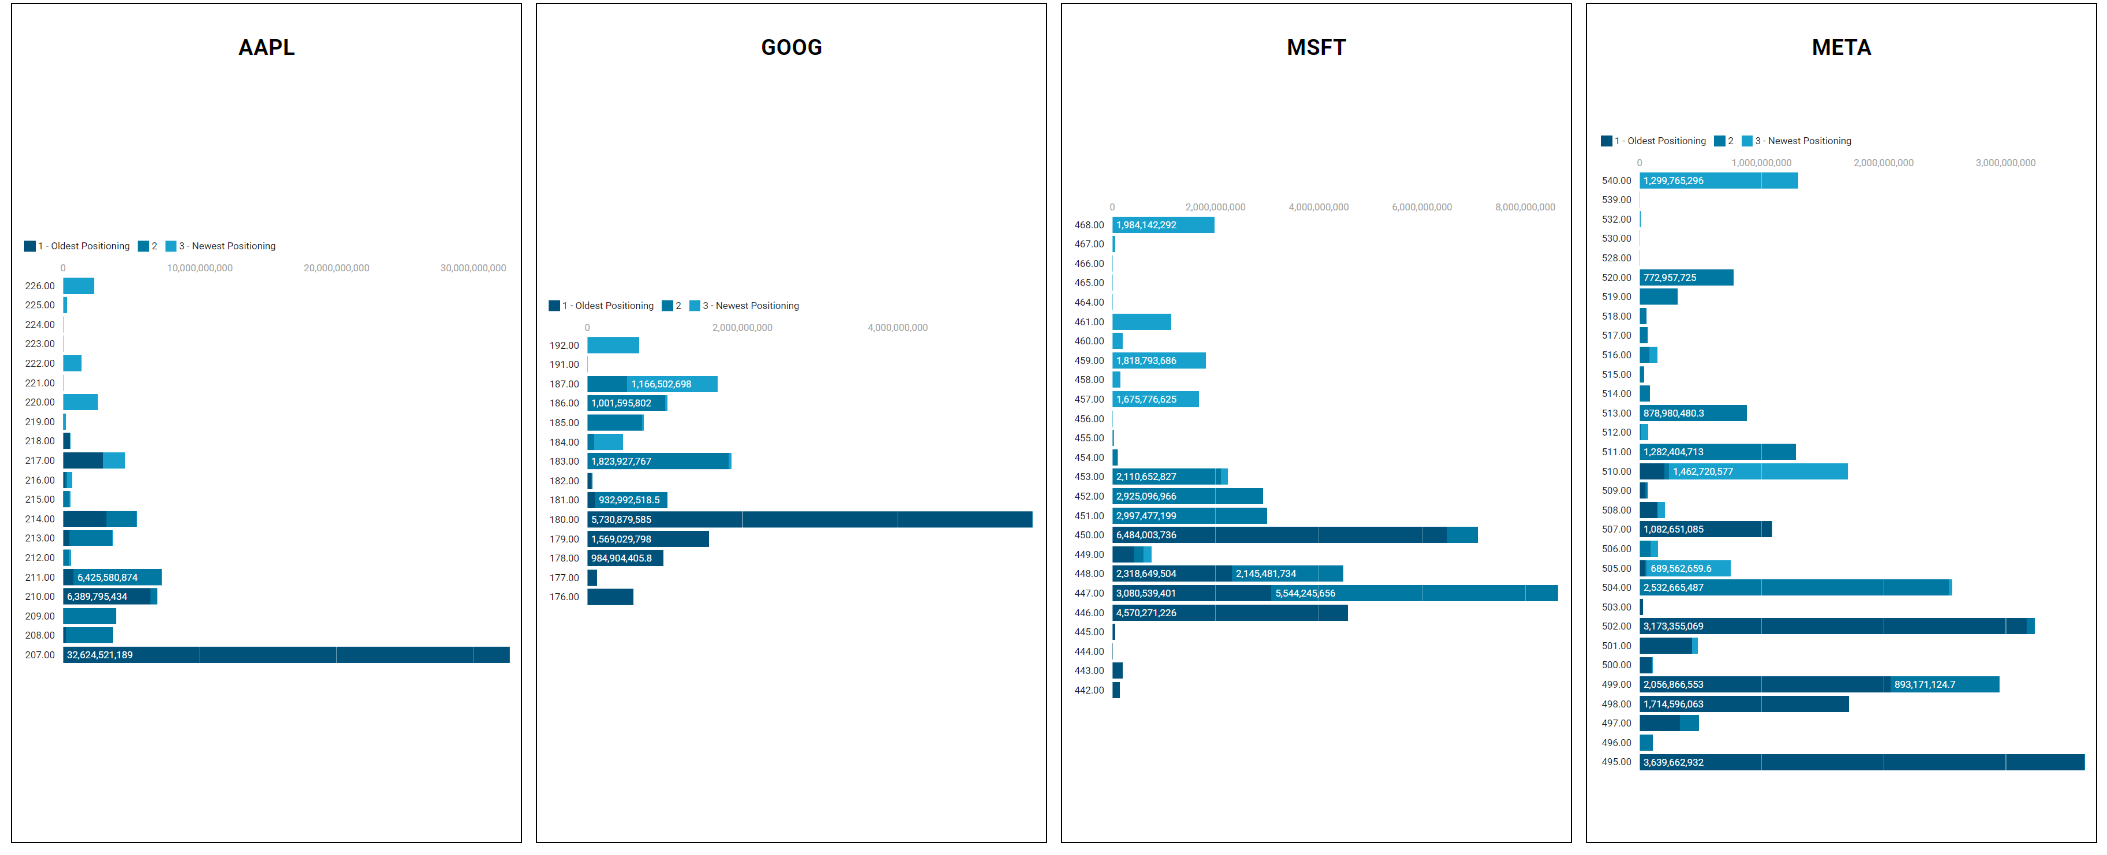
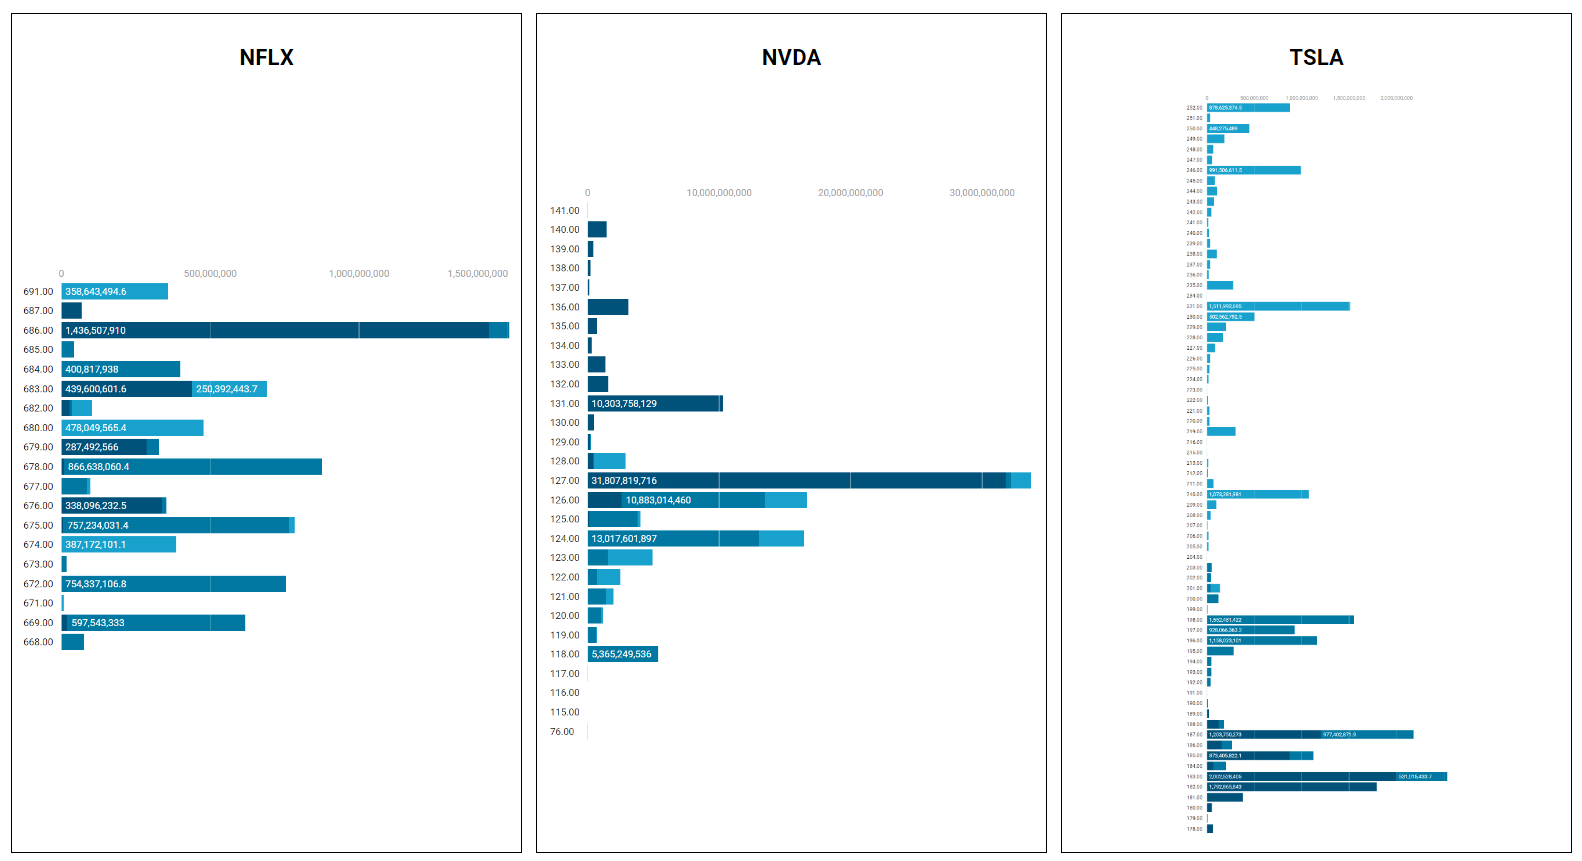
MoneyFlow Charts
When we look at moneyflow charts, we’re visualizing the aggregate institutional activity by price for a given period. The benefit of moneyflow charts is that you have an apples-to-apples comparison of institutional involvement across the entire market because everything is measured by the same yardstick: dollars. If you are familiar with auction mechanics and volume profiling, you can apply the same principles here; wide bars/nodes are magnets and show areas where business is being done and you can expect positioning to be tested and defended, sometimes multiple times; narrow bars represent little interest or less-success in doing business at that price and work as pass/fail levels to define buyer or seller success. A final note: the color gradients represent the age of positioning; the darkest colors are roughly 3 weeks old and the lightest are the most recent week.
Indices
Mag7
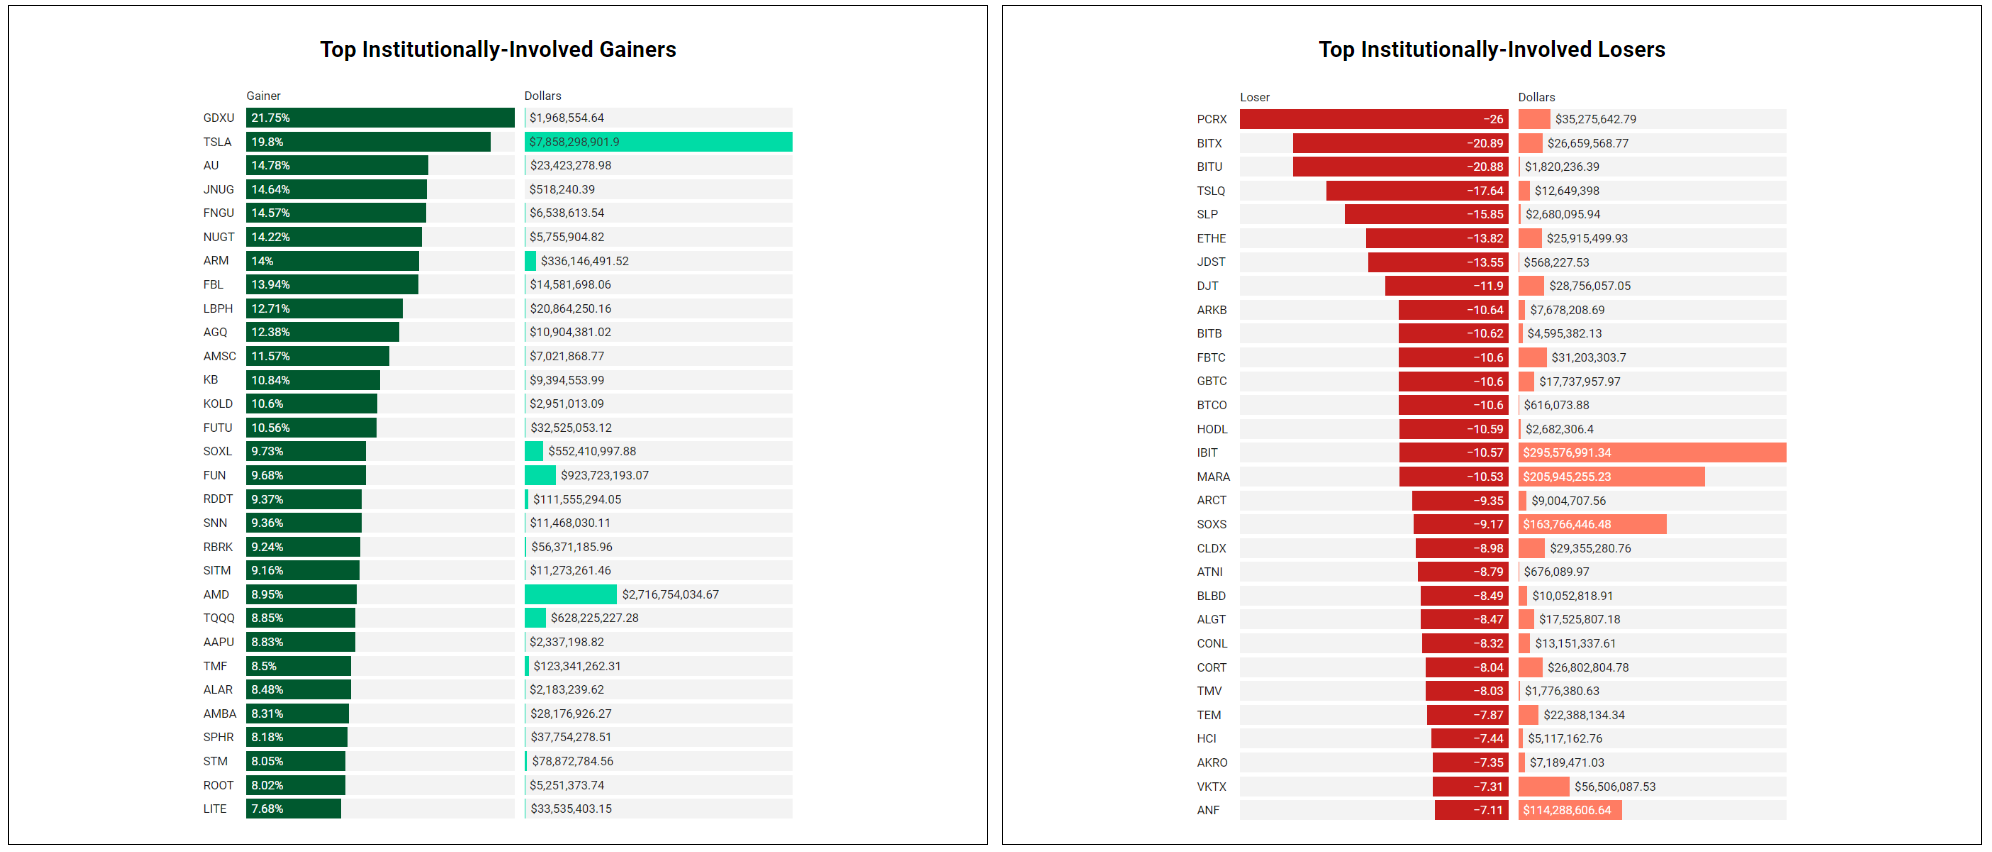
Institutionally-Backed Winners & Losers
If you’re going to bet on a horse, consider one that is officially endorsed by an institution! These are the top percent gainers (green) and and percent losers (red) from this week’s open-to-close that had a trade price greater than $20 and institutional involvement. Continue watching tickers from prior stacks as these frequently turn into larger momentum plays where the winners stay winning and the losers keep losing.
Summary Of Thematic Performance
VL provides a lot of pre-built filters for thematics so that you can quickly dive into specific areas of the market. These performance overviews are provided here only for inspiration. Consider targeting leaders and/or laggards in the best and worst sectors, for example.
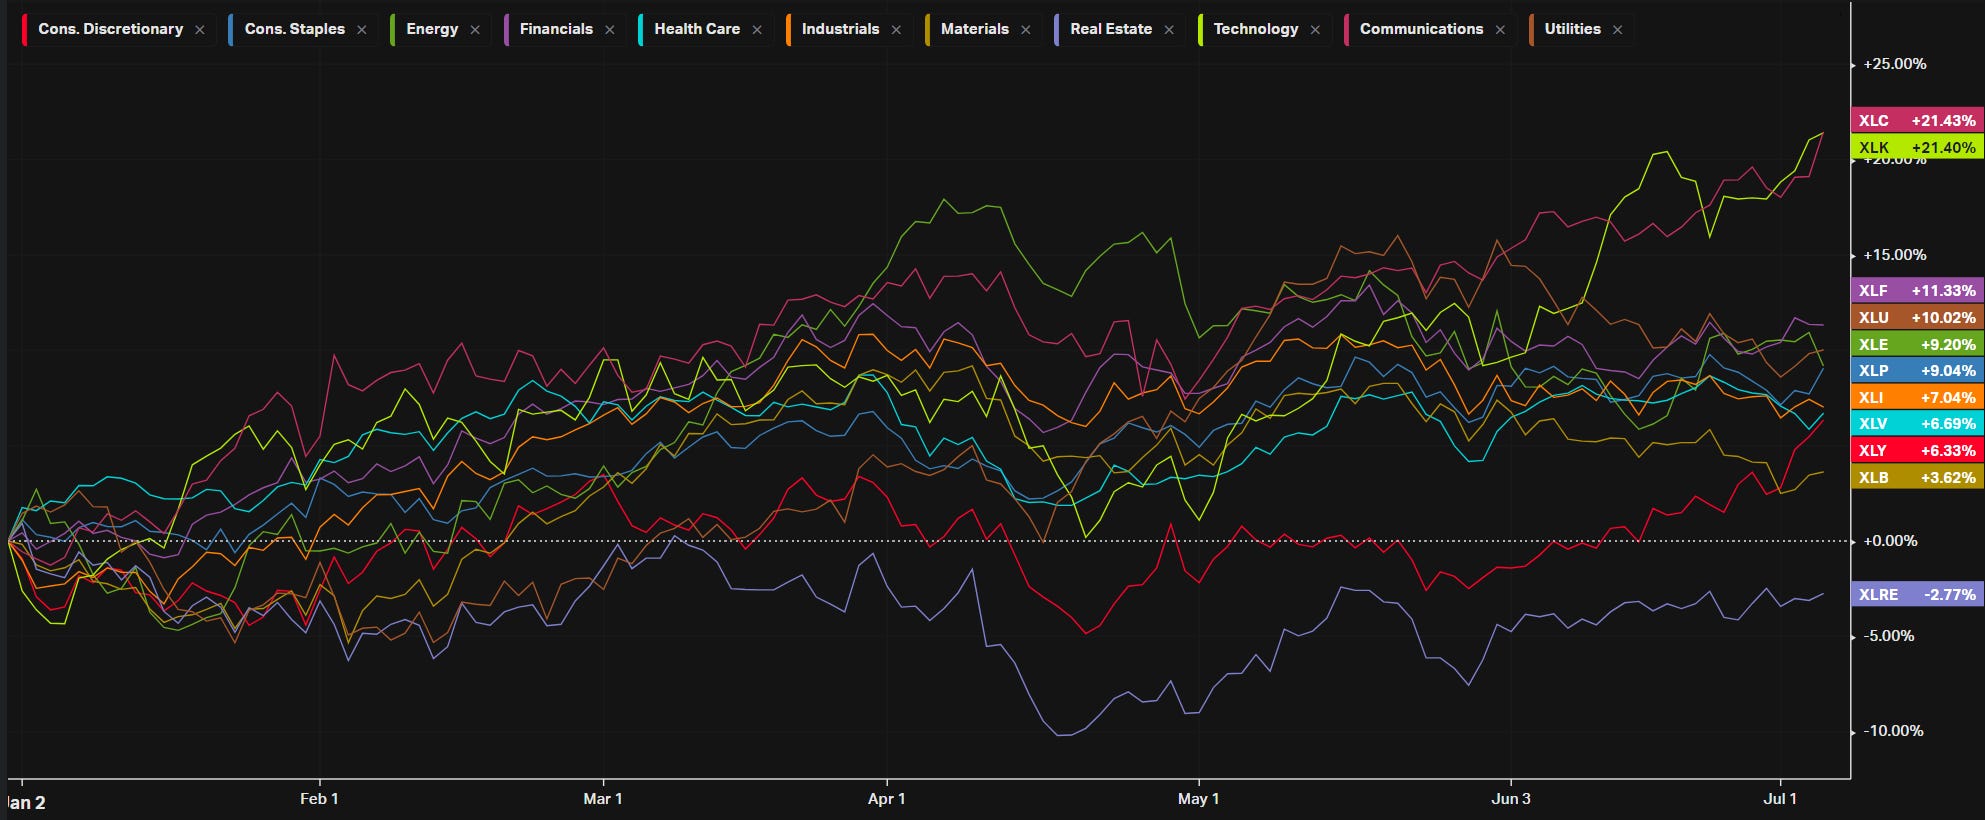
YTD S&P Sector Performance
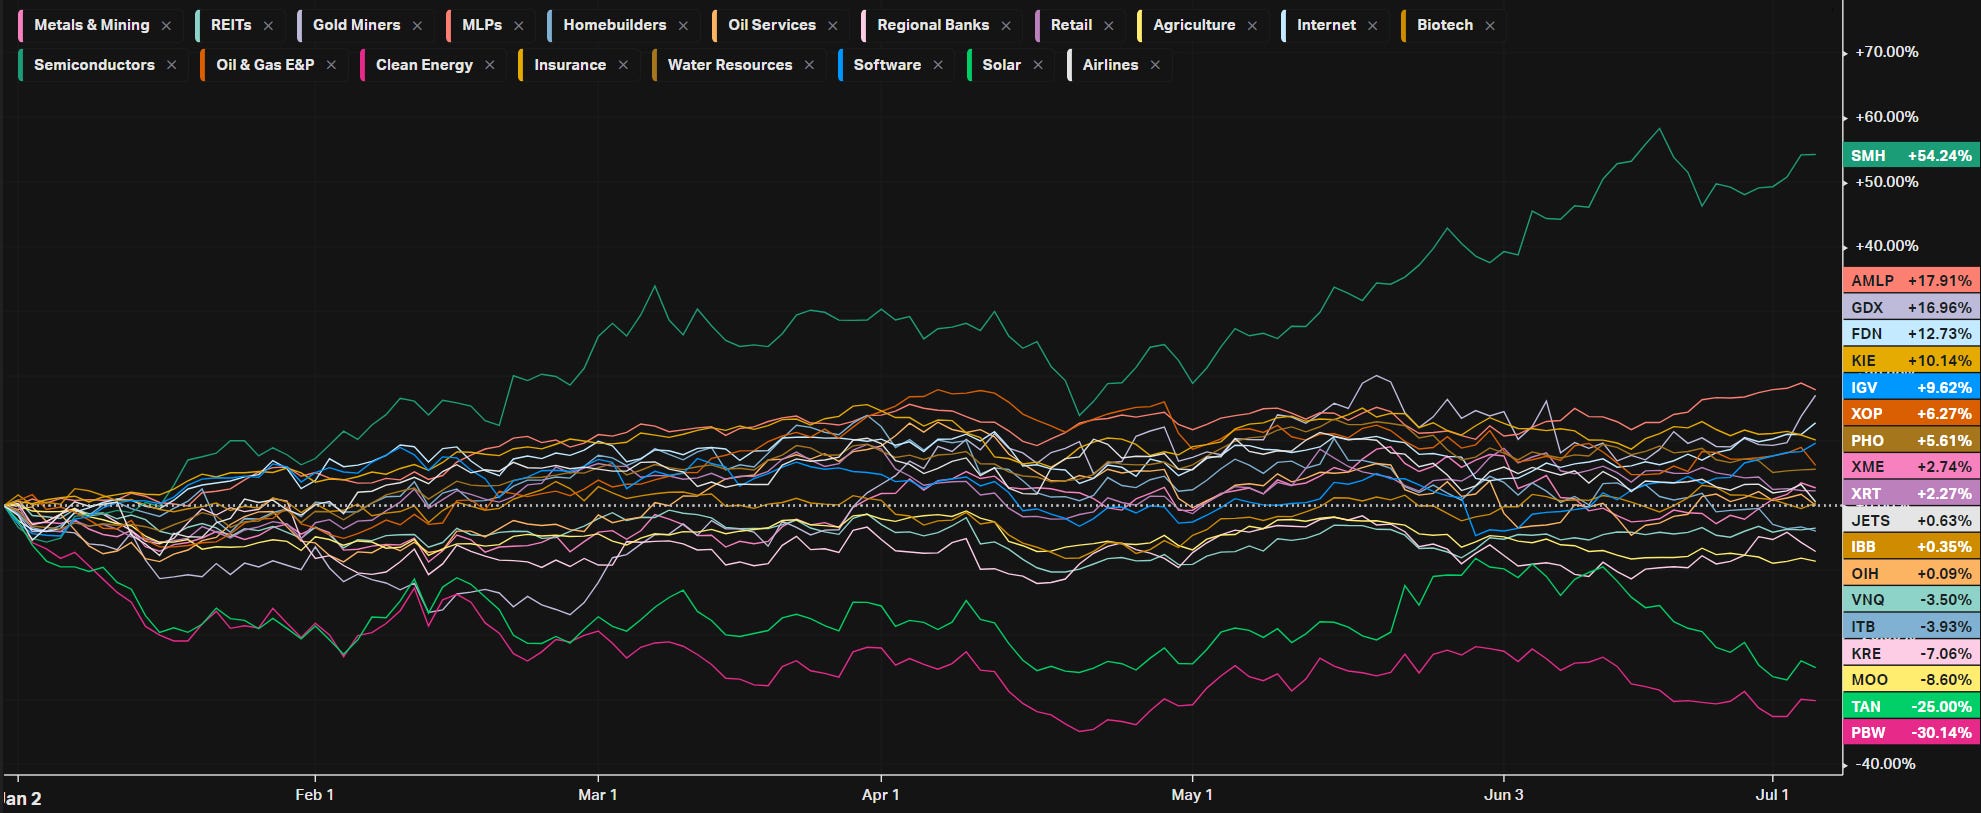
YTD S&P Industry Performance
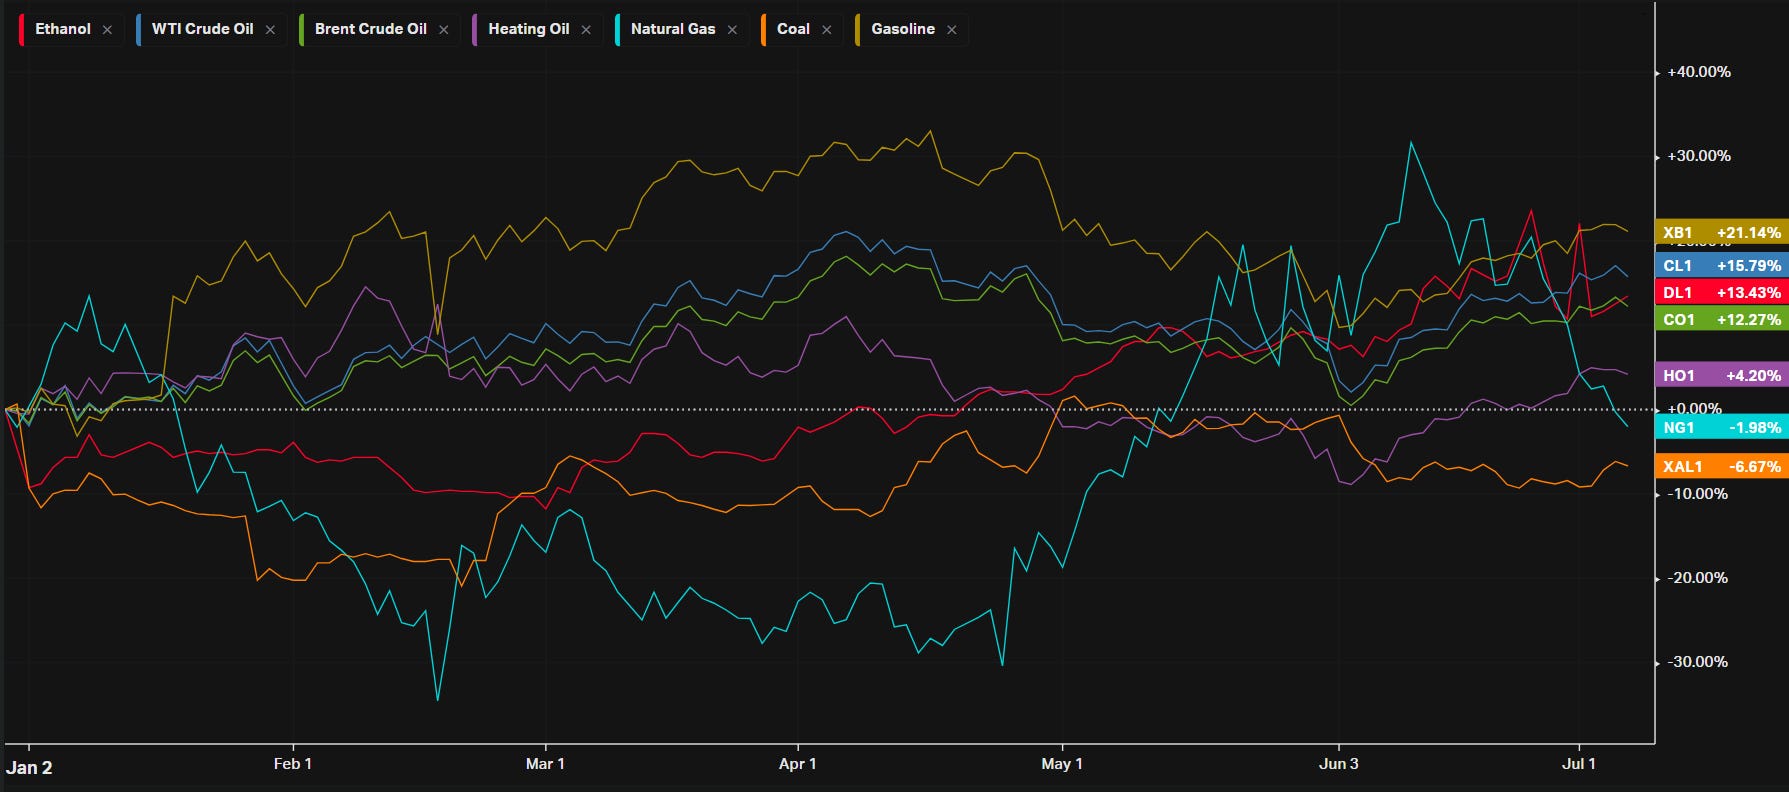
YTD Performance: Energy
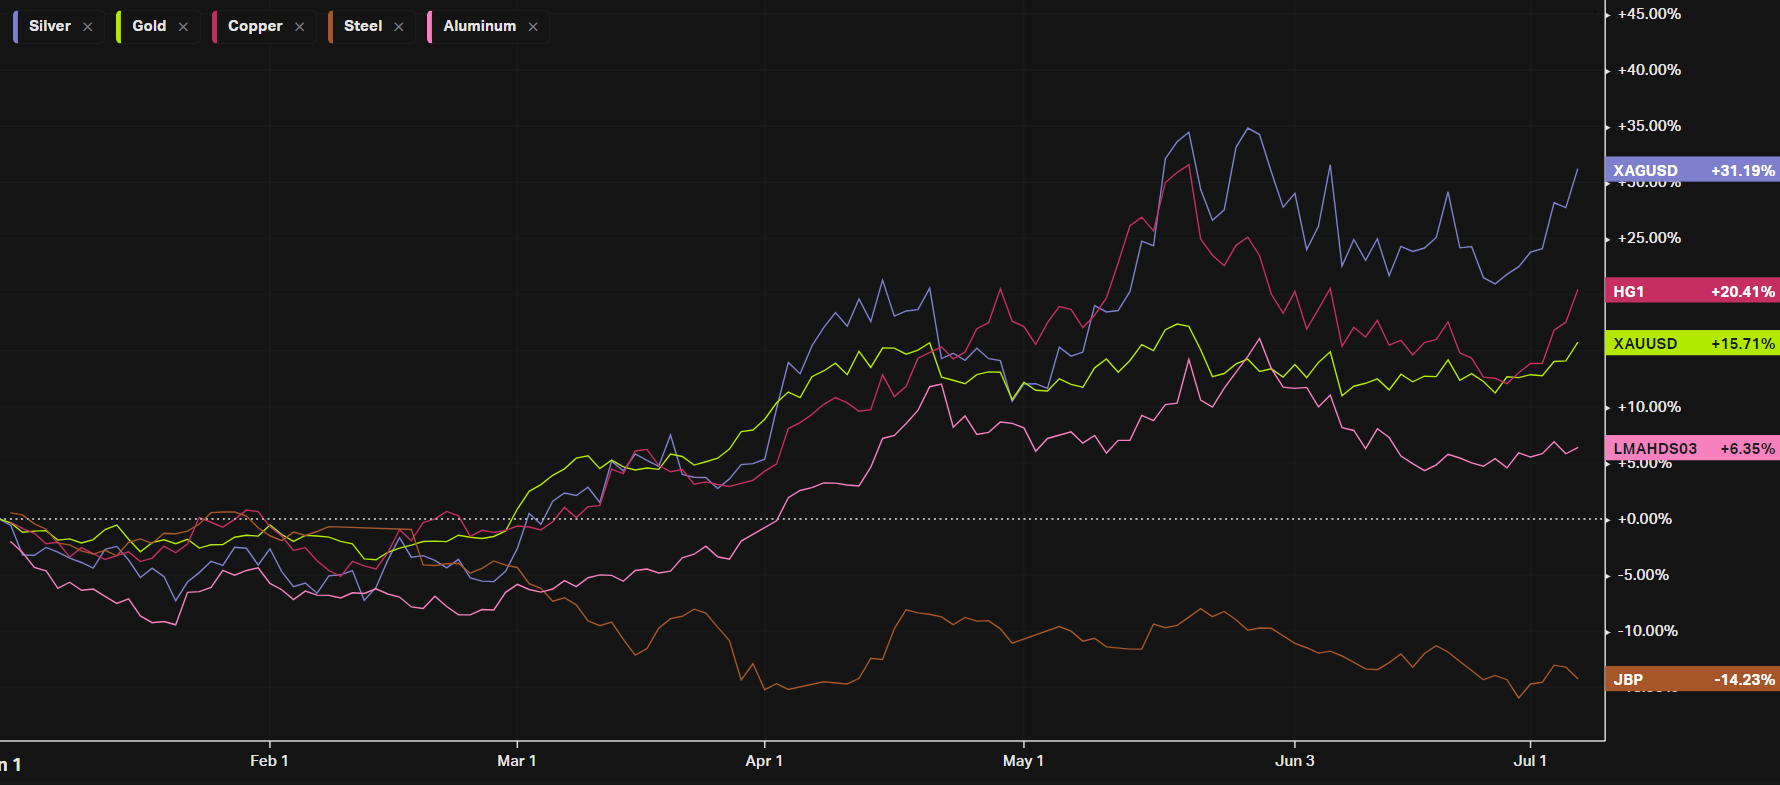
YTD Performance: Metals
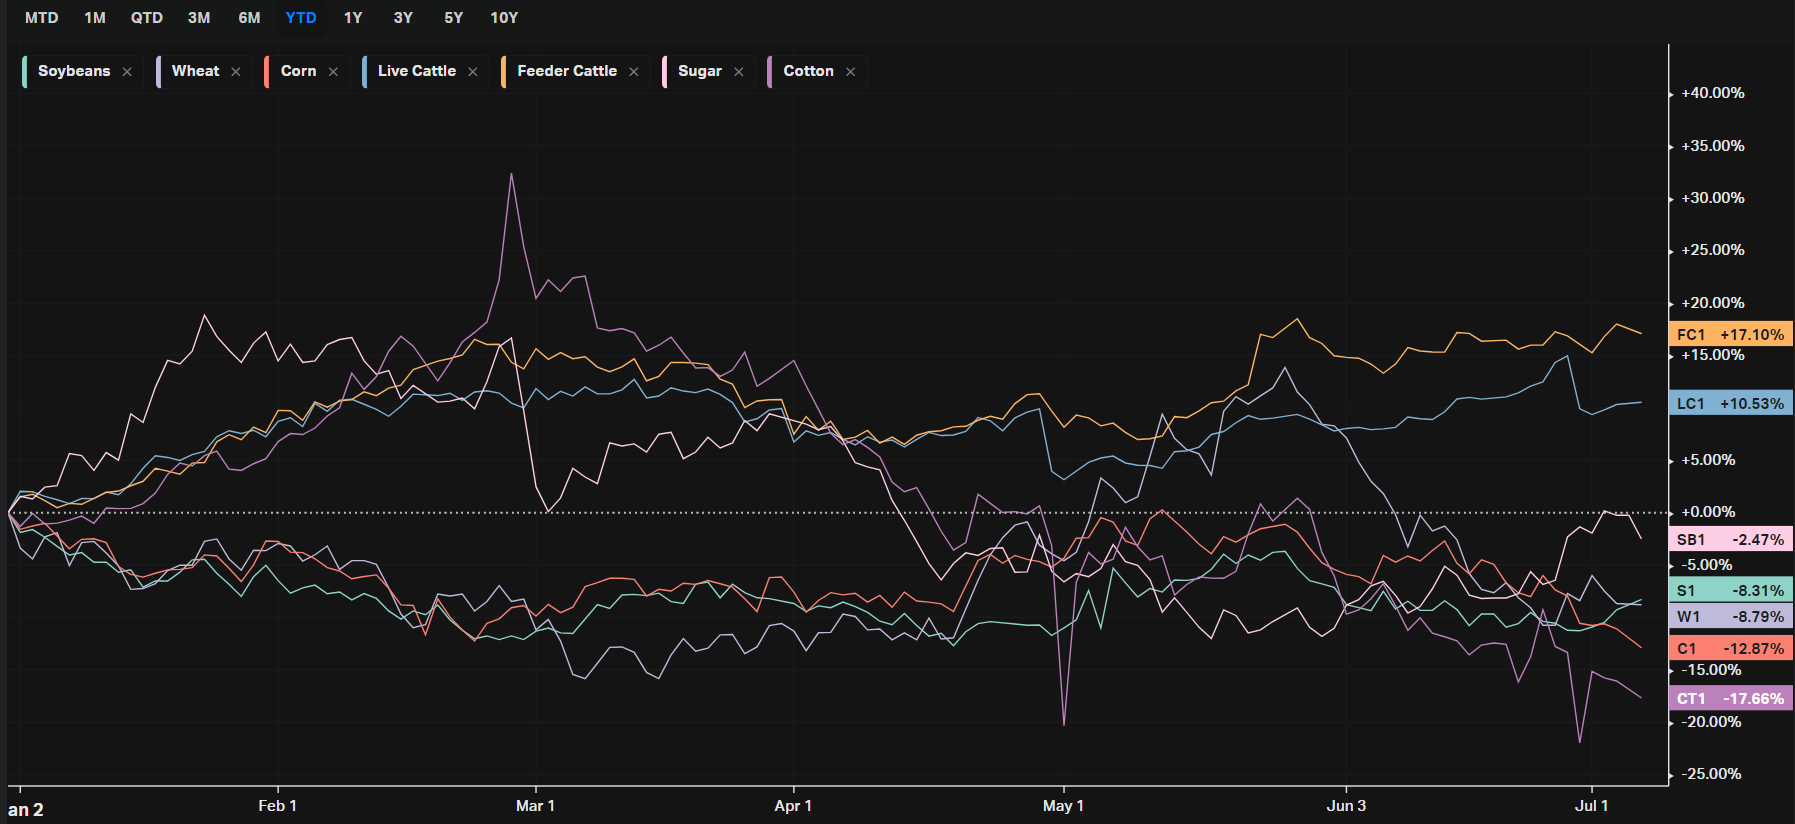
YTD Performance: Agriculture
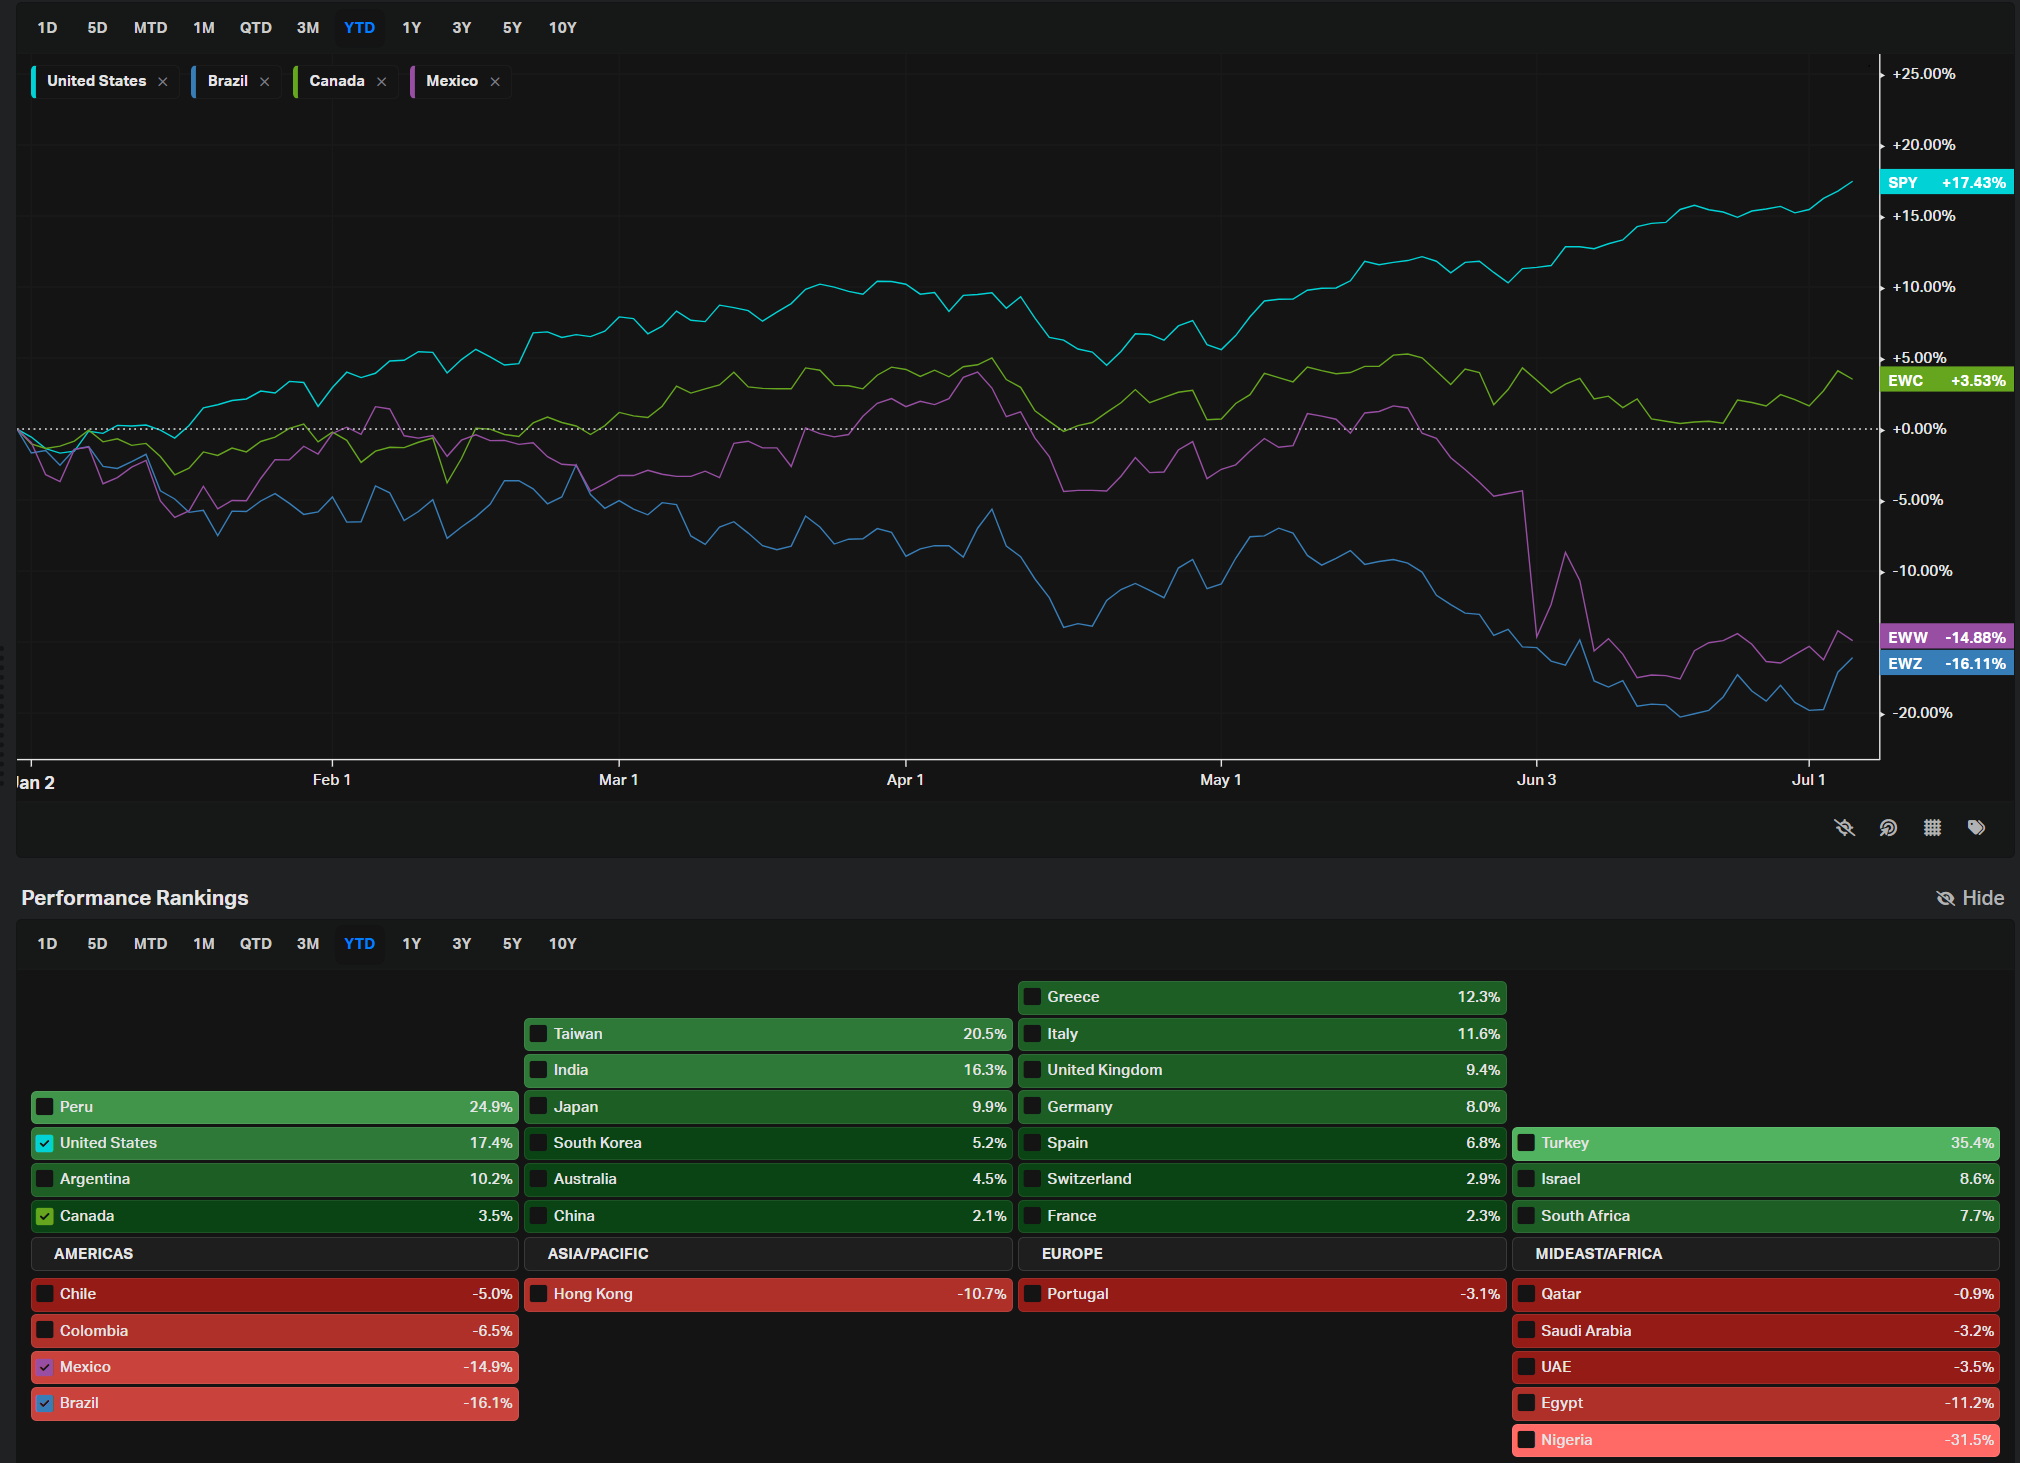
YTD Performance: Country ETFs
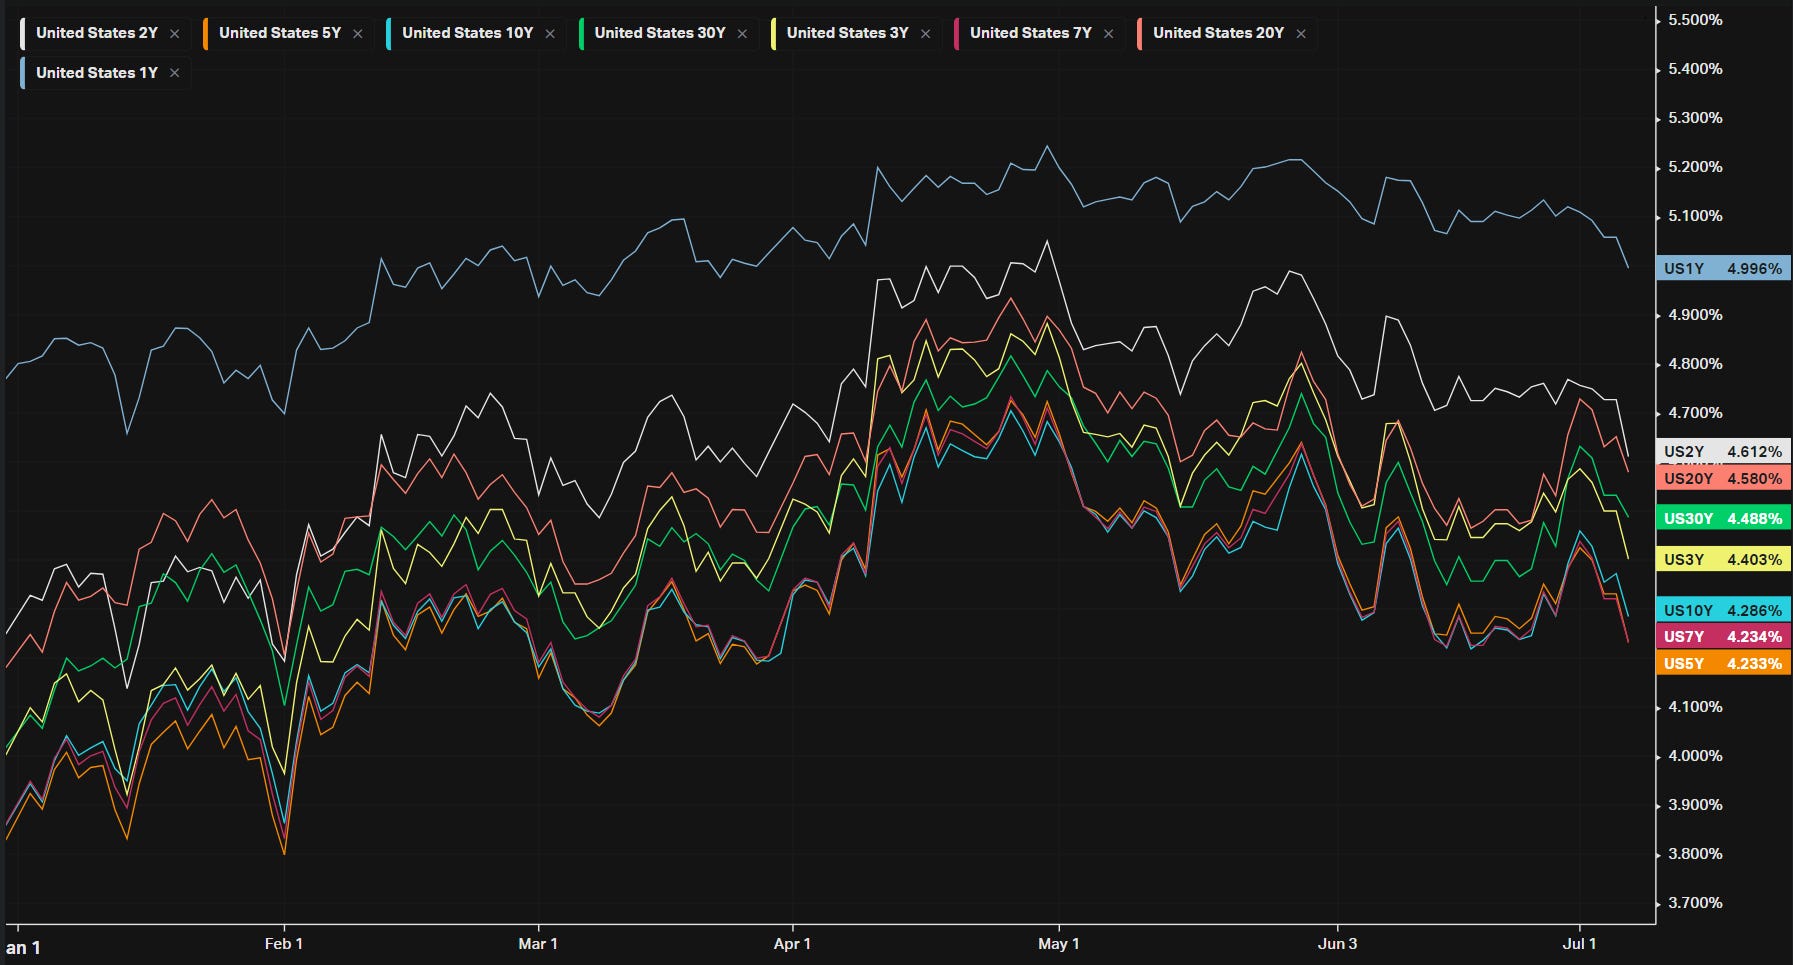
YTD Performance: Yields
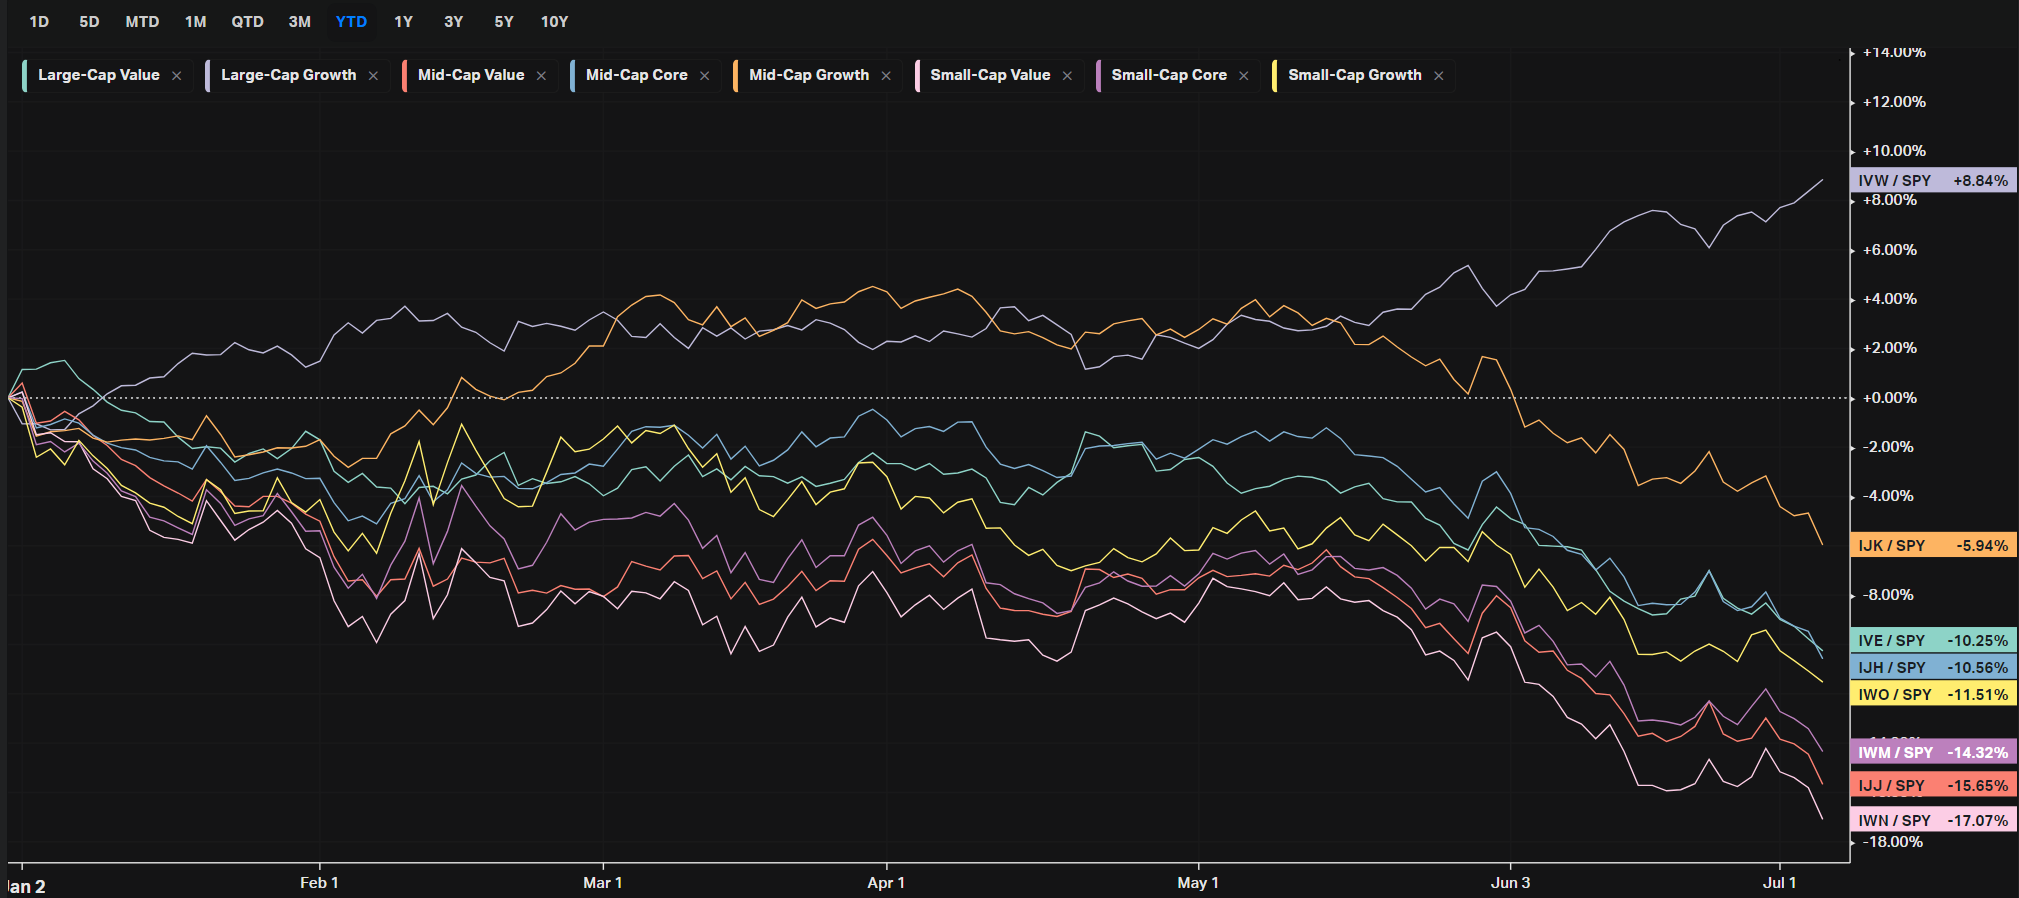
YTD Performance: Size vs Value
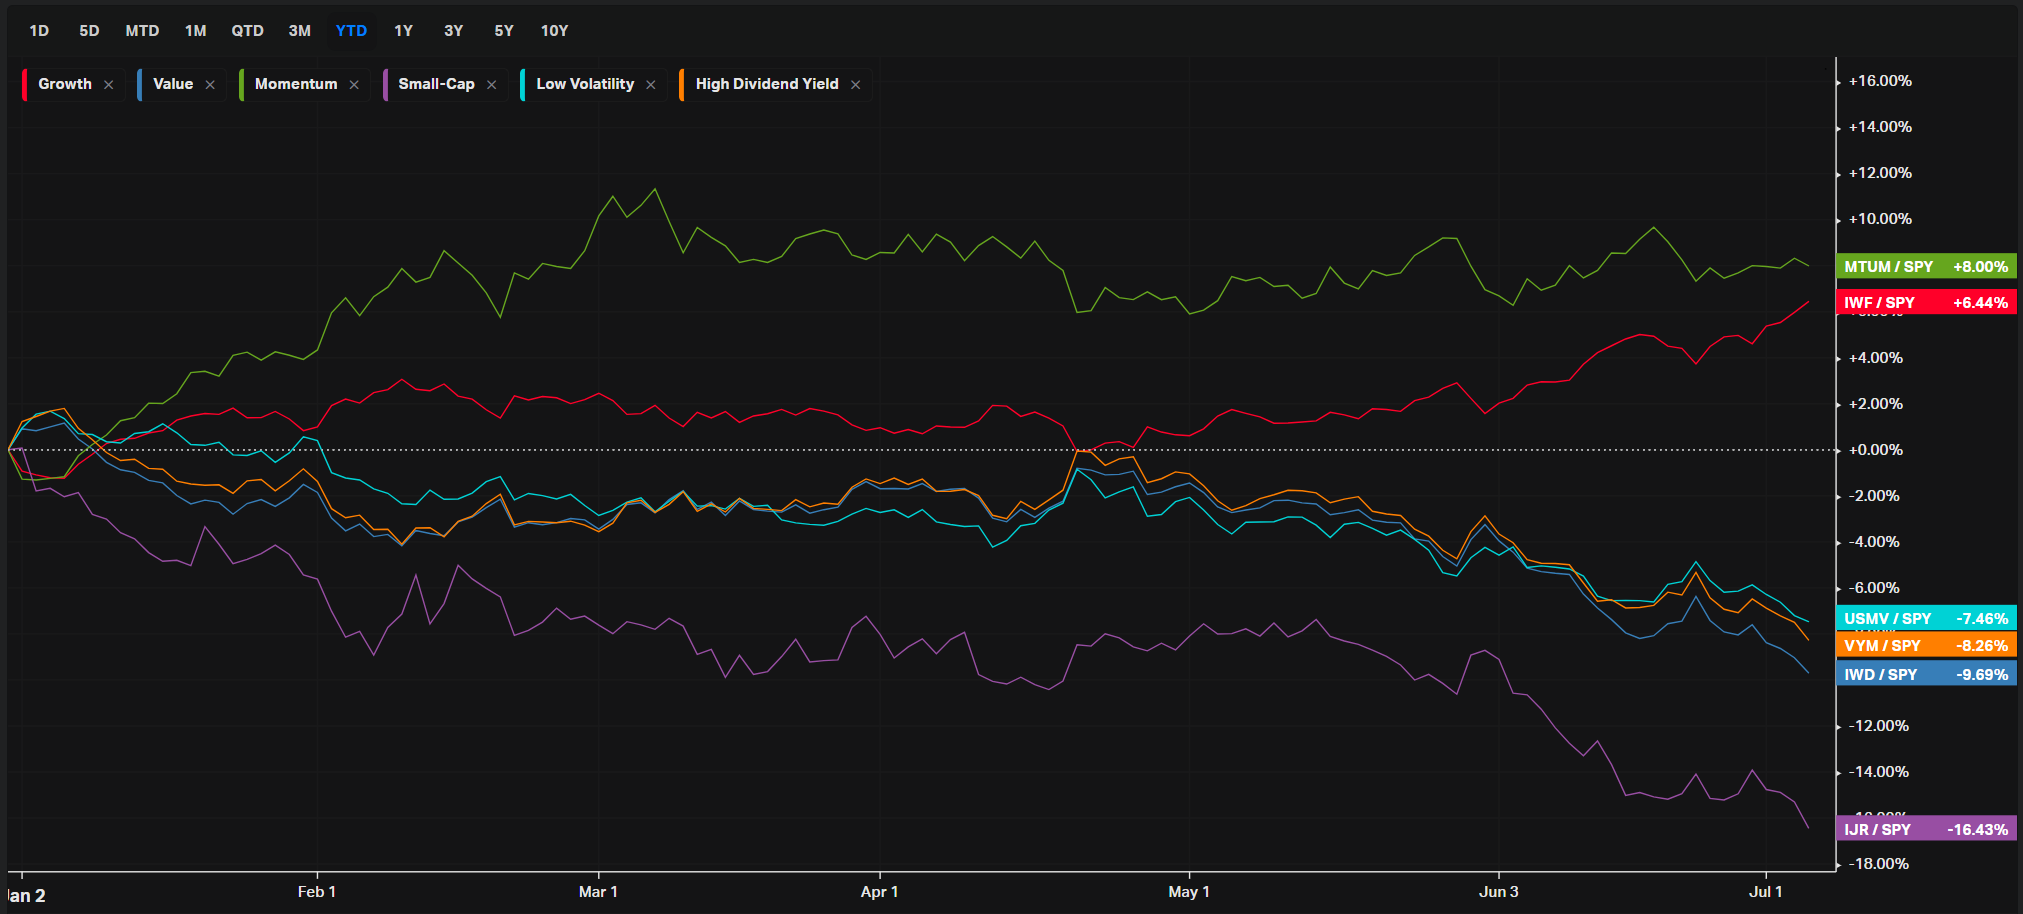
YTD Performance: Style
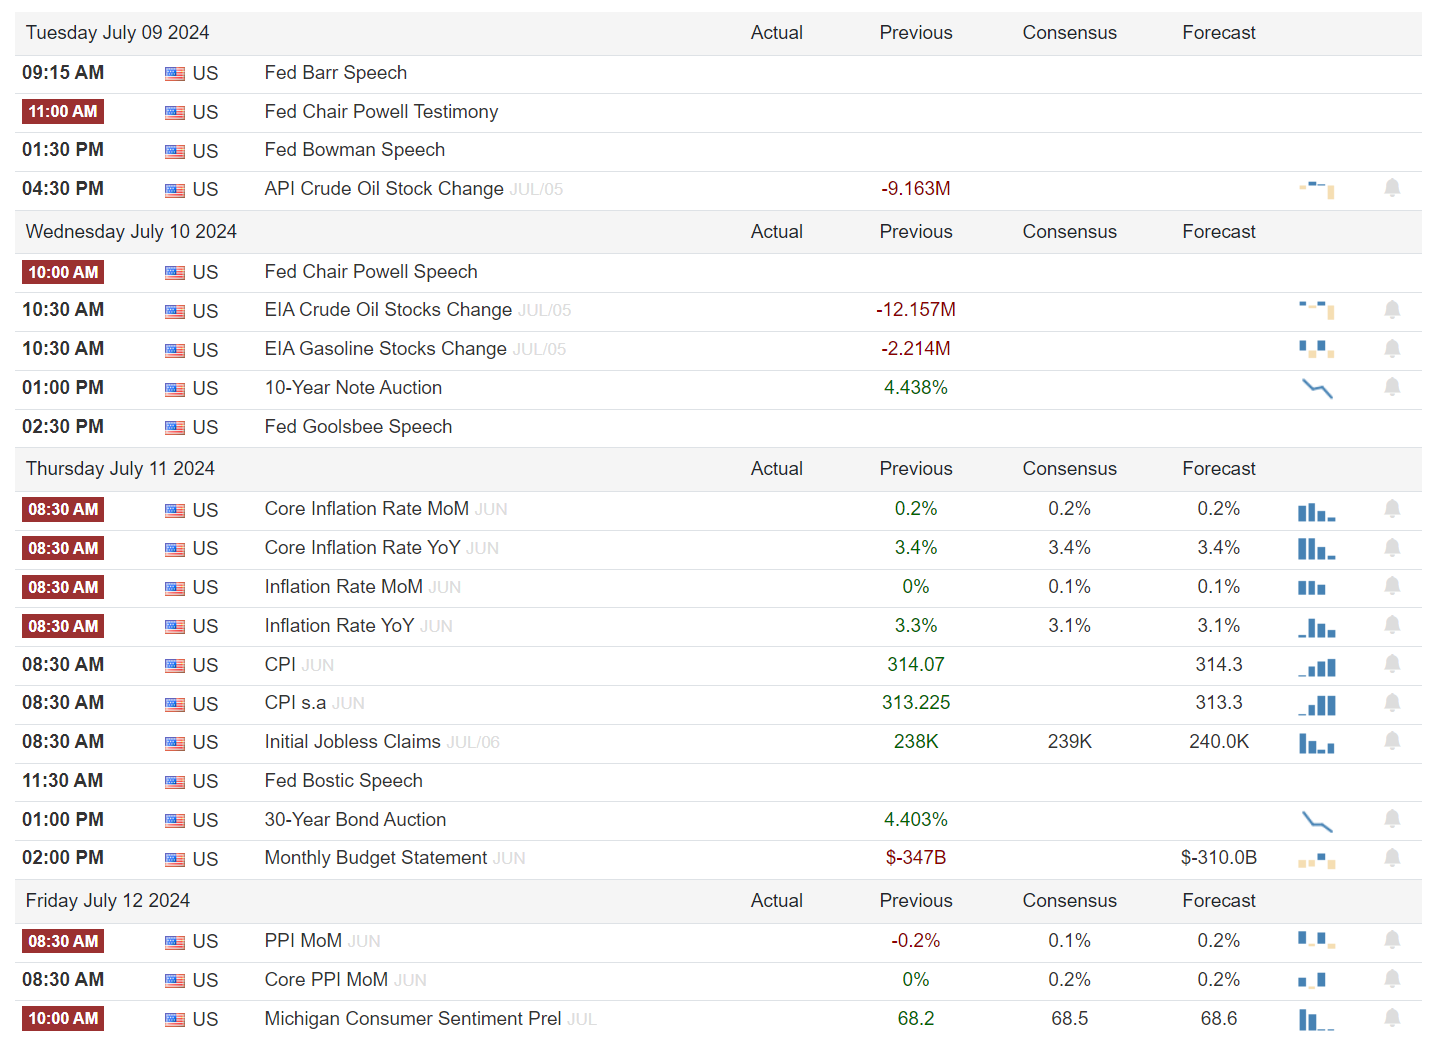
Econ Events On Deck This Week
Here are key economic events happening this week that have the potential to cause outsized moves in the market or heightened short-term volatility.
A Final Word
I’m providing a good deal of my time and a wealth of data from my proprietary platform to bring you actionable information every week at absolutely no cost to you. If you found even an ounce of useful information in here, I could really use your help: please share my stack with a friend, in your Discord or in a Tweet. It’s an insanely good deal that I hope to continue providing to you. Please checkout VolumeLeaders.com for your own free trial of the platform that brings you the data powering this stack. Wishing you all a green week filled with many bags.
This article is from an unpaid external contributor. It does not represent Benzinga's reporting and has not been edited for content or accuracy.