UNITED STATES
SECURITIES AND EXCHANGE COMMISSION
Washington, D.C. 20549
FORM 10-Q
| QUARTERLY REPORT PURSUANT TO SECTION 13 OR 15 (d) OF THE SECURITIES EXCHANGE ACT OF 1934 | |||||
For the quarterly period ended December 31, 2023
OR
| TRANSITION REPORT PURSUANT TO SECTION 13 OR 15 (d) OF THE EXCHANGE ACT OF 1934 | |||||
For the transition period from _________ to _________
Commission file number 001-33365

_______________________________________________________________
(Exact name of registrant as specified in its charter)
| (State or other jurisdiction of incorporation or organization) | (I.R.S. Employer Identification No.) | |||||||
| (Address of principal executive offices) | (Zip Code) | ||||||||||||||||
(610 ) 989-0340
_______________________________________________________________
(Registrant’s telephone number, including area code)
Securities registered pursuant to Section 12(b) of the Act:
| Title of Each Class | Trading Symbol | Name Of Each Exchange On Which Registered | ||||||
Indicate by check mark whether the registrant (1) has filed all reports required to be filed by Section 13 or 15(d) of the Securities Exchange Act of 1934 during the preceding 12 months (or for such shorter period that the registrant was required to file such reports), and (2) has been subject to such filing requirements for the past 90 days. Yes ☑ No ☐
Indicate by check mark whether the registrant has submitted electronically every Interactive Data File required to be submitted pursuant to Rule 405 of Regulation S-T (§232.405 of this chapter) during the preceding 12 months (or for such shorter period that the registrant was required to submit such files). Yes ☑ No ☐
Indicate by check mark whether the registrant is a large accelerated filer, an accelerated filer, a non-accelerated filer, smaller reporting company, or an emerging growth company. See the definitions of “large accelerated filer”, “accelerated filer”, “smaller reporting company,” and “emerging growth company” in Rule 12b-2 of the Exchange Act.
| Large accelerated filer | ☐ | ☑ | |||||||||
| Non-accelerated filer | ☐ | Smaller reporting company | |||||||||
| Emerging growth company | |||||||||||
If an emerging growth company, indicate by check mark if the registrant has elected not to use the extended transition period for complying with any new or revised financial accounting standards provided pursuant to Section 13(a) of the Exchange Act. ☐
Indicate by check mark whether the registrant is a shell company (as defined in Rule 12b-2 of the Act). Yes ☐ No ☑
As of February 5, 2024, there were72,797,023 outstanding shares of Common Stock, no par value.
As of February 5, 2024, there were
Cantaloupe, Inc.
TABLE OF CONTENTS
Item 6. | Exhibits | |||||||
Part I. Financial Information
Item 1. Condensed Consolidated Financial Statements
Cantaloupe, Inc.
Condensed Consolidated Balance Sheets
| ($ in thousands, except share data) | December 31, 2023 (Unaudited) | June 30, 2023 | ||||||||||||
| Assets | ||||||||||||||
| Current assets: | ||||||||||||||
| Cash and cash equivalents | $ | $ | ||||||||||||
| Accounts receivable, net | ||||||||||||||
| Finance receivables, net | ||||||||||||||
| Inventory, net | ||||||||||||||
| Prepaid expenses and other current assets | ||||||||||||||
| Total current assets | ||||||||||||||
| Non-current assets: | ||||||||||||||
| Finance receivables due after one year, net | ||||||||||||||
| Property and equipment, net | ||||||||||||||
| Operating lease right-of-use assets | ||||||||||||||
| Intangibles, net | ||||||||||||||
| Goodwill | ||||||||||||||
| Other assets | ||||||||||||||
| Total non-current assets | ||||||||||||||
| Total assets | $ | $ | ||||||||||||
| Liabilities, convertible preferred stock, and shareholders’ equity | ||||||||||||||
| Current liabilities: | ||||||||||||||
| Accounts payable | $ | $ | ||||||||||||
| Accrued expenses | ||||||||||||||
| Current obligations under long-term debt | ||||||||||||||
| Deferred revenue | ||||||||||||||
| Total current liabilities | ||||||||||||||
| Long-term liabilities: | ||||||||||||||
| Deferred income taxes | ||||||||||||||
| Long-term debt, less current portion | ||||||||||||||
| Operating lease liabilities, non-current | ||||||||||||||
| Total long-term liabilities | ||||||||||||||
| Total liabilities | ||||||||||||||
Commitments and contingencies (Note 15) | ||||||||||||||
| Convertible preferred stock: | ||||||||||||||
Series A convertible preferred stock, | ||||||||||||||
| Shareholders’ equity: | ||||||||||||||
Common stock, no par value, | ||||||||||||||
| Accumulated deficit | ( | ( | ||||||||||||
| Accumulated other comprehensive loss | ( | |||||||||||||
| Total shareholders’ equity | ||||||||||||||
| Total liabilities, convertible preferred stock, and shareholders’ equity | $ | $ | ||||||||||||
See accompanying notes to condensed consolidated financial statements.
3
Cantaloupe, Inc.
Condensed Consolidated Statements of Operations
(Unaudited)
| Three months ended | Six months ended | |||||||||||||||||||||||||
| December 31, | December 31, | |||||||||||||||||||||||||
| ($ in thousands, except share and per share data) | 2023 | 2022 | 2023 | 2022 | ||||||||||||||||||||||
| Revenues: | ||||||||||||||||||||||||||
| Subscription and transaction fees | $ | $ | $ | $ | ||||||||||||||||||||||
| Equipment sales | ||||||||||||||||||||||||||
| Total revenues | ||||||||||||||||||||||||||
Costs of sales: | ||||||||||||||||||||||||||
| Cost of subscription and transaction fees | ||||||||||||||||||||||||||
| Cost of equipment sales | ||||||||||||||||||||||||||
| Total costs of sales | ||||||||||||||||||||||||||
| Gross profit | ||||||||||||||||||||||||||
| Operating expenses: | ||||||||||||||||||||||||||
| Sales and marketing | ||||||||||||||||||||||||||
| Technology and product development | ||||||||||||||||||||||||||
| General and administrative | ||||||||||||||||||||||||||
| Investigation, proxy solicitation and restatement expenses, net of insurance recoveries | ||||||||||||||||||||||||||
| Integration and acquisition expenses | ||||||||||||||||||||||||||
| Depreciation and amortization | ||||||||||||||||||||||||||
| Total operating expenses | ||||||||||||||||||||||||||
| Operating income (loss) | ( | ( | ||||||||||||||||||||||||
| Other income (expense): | ||||||||||||||||||||||||||
| Interest income from leases | ||||||||||||||||||||||||||
| Interest expense | ( | ( | ( | ( | ||||||||||||||||||||||
| Other income (expense), net | ( | |||||||||||||||||||||||||
| Total other (expense) income | ( | ( | ||||||||||||||||||||||||
| Income (loss) before income taxes | ( | ( | ||||||||||||||||||||||||
| Provision for income taxes | ( | ( | ( | ( | ||||||||||||||||||||||
| Net income (loss) | ( | ( | ||||||||||||||||||||||||
| Preferred dividends | ( | ( | ||||||||||||||||||||||||
| Net income (loss) applicable to common shares | $ | $ | ( | $ | $ | ( | ||||||||||||||||||||
| Net earnings (loss) per common share | ||||||||||||||||||||||||||
| Basic | $ | $ | ( | $ | $ | ( | ||||||||||||||||||||
| Diluted | ( | ( | ||||||||||||||||||||||||
| Weighted average number of common shares outstanding used to compute net earnings (loss) per share applicable to common shares | ||||||||||||||||||||||||||
| Basic | ||||||||||||||||||||||||||
| Diluted | ||||||||||||||||||||||||||
See accompanying notes to condensed consolidated financial statements.
4
Cantaloupe, Inc.
Condensed Consolidated Statements of Comprehensive Income (Loss)
(Unaudited)
| Three months ended | Six months ended | |||||||||||||||||||||||||
| December 31, | December 31, | |||||||||||||||||||||||||
| ($ in thousands) | 2023 | 2022 | 2023 | 2022 | ||||||||||||||||||||||
| Net income (loss) | $ | $ | ( | $ | $ | ( | ||||||||||||||||||||
| Foreign currency translation adjustments | ( | ( | ||||||||||||||||||||||||
Other comprehensive loss, net of income tax | ( | ( | ||||||||||||||||||||||||
| Total comprehensive income (loss) | $ | $ | ( | $ | $ | ( | ||||||||||||||||||||
5
Cantaloupe, Inc.
Condensed Consolidated Statements of Convertible Preferred Stock and Shareholders’ Equity
(Unaudited)
Three and Six Months Ended December 31, 2023
| Convertible Preferred Stock | Common Stock | Accumulated Deficit | Accumulated Other Comprehensive Loss | Total Shareholders' Equity | ||||||||||||||||||||||||||||||||||||||||
| ($ in thousands, except share data) | Shares | Amount | Shares | Amount | ||||||||||||||||||||||||||||||||||||||||
| Balance, June 30, 2023 | $ | $ | $ | ( | $ | $ | ||||||||||||||||||||||||||||||||||||||
| Stock-based compensation | — | — | — | — | ||||||||||||||||||||||||||||||||||||||||
| Exercise of stock options | — | — | — | — | ||||||||||||||||||||||||||||||||||||||||
| Net income | — | — | — | — | — | |||||||||||||||||||||||||||||||||||||||
| Balance, September 30, 2023 | $ | ( | ||||||||||||||||||||||||||||||||||||||||||
| Stock-based compensation | — | — | — | — | ||||||||||||||||||||||||||||||||||||||||
| Other comprehensive loss | — | — | — | — | — | ( | ( | |||||||||||||||||||||||||||||||||||||
| Net income | — | — | — | — | — | |||||||||||||||||||||||||||||||||||||||
| Balance, December 31, 2023 | $ | $ | $ | ( | $ | ( | $ | |||||||||||||||||||||||||||||||||||||
Three and Six Months Ended December 31, 2022
| Convertible Preferred Stock | Common Stock | Accumulated Deficit | Accumulated Other Comprehensive Loss | Total Shareholders' Equity | ||||||||||||||||||||||||||||||||||||||||
| ($ in thousands, except share data) | Shares | Amount | Shares | Amount | ||||||||||||||||||||||||||||||||||||||||
| Balance, June 30, 2022 | $ | $ | $ | ( | $ | $ | ||||||||||||||||||||||||||||||||||||||
| Stock-based compensation | — | — | — | — | ||||||||||||||||||||||||||||||||||||||||
| Repurchase of Series A convertible preferred stock | ( | ( | — | ( | — | — | ( | |||||||||||||||||||||||||||||||||||||
| Net loss | — | — | — | — | ( | — | ( | |||||||||||||||||||||||||||||||||||||
| Balance, September 30, 2022 | ( | |||||||||||||||||||||||||||||||||||||||||||
| Stock-based compensation | — | — | — | — | ||||||||||||||||||||||||||||||||||||||||
| Common stock issued for acquisition | — | — | — | — | ||||||||||||||||||||||||||||||||||||||||
| Net loss | — | — | — | — | ( | — | ( | |||||||||||||||||||||||||||||||||||||
| Balance, December 31, 2022 | $ | $ | $ | ( | $ | $ | ||||||||||||||||||||||||||||||||||||||
See accompanying notes to condensed consolidated financial statements.
6
Cantaloupe, Inc.
Condensed Consolidated Statements of Cash Flows
(Unaudited)
| Six months ended | ||||||||||||||
| December 31, | ||||||||||||||
| ($ in thousands) | 2023 | 2022 | ||||||||||||
| Cash flows from operating activities: | ||||||||||||||
| Net income (loss) | $ | $ | ( | |||||||||||
| Adjustments to reconcile net income (loss) to net cash used in operating activities: | ||||||||||||||
| Stock based compensation | ||||||||||||||
| Amortization of debt issuance costs and discounts | ||||||||||||||
| Provision for expected losses | ||||||||||||||
| Provision for inventory reserve | ||||||||||||||
| Depreciation and amortization included in operating expenses | ||||||||||||||
Depreciation included in cost of subscription and transaction fees for rental equipment | ||||||||||||||
| Other | ||||||||||||||
| Changes in operating assets and liabilities: | ||||||||||||||
| Accounts receivable | ( | ( | ||||||||||||
| Finance receivables | ( | |||||||||||||
| Inventory | ( | ( | ||||||||||||
| Prepaid expenses and other assets | ( | |||||||||||||
| Accounts payable and accrued expenses | ( | ( | ||||||||||||
| Operating lease liabilities | ( | ( | ||||||||||||
| Deferred revenue | ||||||||||||||
| Net cash used in operating activities | ( | ( | ||||||||||||
| Cash flows from investing activities: | ||||||||||||||
| Acquisition of business, net of cash acquired | ( | |||||||||||||
| Capital expenditures | ( | ( | ||||||||||||
| Net cash used in investing activities | ( | ( | ||||||||||||
| Cash flows from financing activities: | ||||||||||||||
| Proceeds from long-term debt | ||||||||||||||
| Repayment of long-term debt | ( | ( | ||||||||||||
| Contingent consideration paid for acquisition | ( | |||||||||||||
| Proceeds from exercise of common stock options | ||||||||||||||
| Repurchase of Series A Convertible Preferred Stock | ( | |||||||||||||
| Net cash (used in) provided by financing activities | ( | |||||||||||||
| Effect of currency exchange rate changes on cash and cash equivalents | ||||||||||||||
| Net decrease in cash and cash equivalents | ( | ( | ||||||||||||
| Cash and cash equivalents at beginning of year | ||||||||||||||
| Cash and cash equivalents at end of period | $ | $ | ||||||||||||
Supplemental disclosures of cash flow information: | ||||||||||||||
| Interest paid in cash | $ | $ | ||||||||||||
| Income taxes paid in cash | $ | $ | ||||||||||||
| Common stock issued in business combination | $ | $ | ||||||||||||
See accompanying notes to condensed consolidated financial statements.
7
Cantaloupe, Inc.
Notes to Condensed Consolidated Financial Statements
(Unaudited)
1. BUSINESS
Cantaloupe, Inc., is organized under the laws of the Commonwealth of Pennsylvania. We are a digital payments and software services company that provides end-to-end technology solutions for self-service commerce. We offer a single platform for self-service commerce which includes integrated payments processing and software solutions that handle inventory management, pre-kitting, route logistics, warehouse and back-office management. Our enterprise-wide platform is designed to increase consumer engagement and sales revenue through digital payments, digital advertising and customer loyalty programs, while providing retailers with control and visibility over their operations and inventory. Our customers range from vending machine companies to operators of micro-markets and smart retail, laundromats, metered parking terminals, amusement and entertainment venues, IoT services and more.
Cantaloupe, Inc. and its consolidated subsidiaries are referred to herein collectively as "Cantaloupe," the "Company," "we," "our" or "us," unless the context requires otherwise.
2. SUMMARY OF SIGNIFICANT ACCOUNTING POLICIES
Basis of Presentation and Preparation
The accompanying unaudited condensed consolidated financial statements of the Company have been prepared in accordance with U.S. generally accepted accounting principles for interim financial information and with the instructions to Form 10-Q. Accordingly, they do not include all of the information and footnotes required by U.S. generally accepted accounting principles for complete financial statements and therefore should be read in conjunction with the Company’s June 30, 2023 Annual Report on Form 10-K.
All intercompany transactions and balances have been eliminated in consolidation. In the opinion of management, all adjustments considered necessary for a fair presentation, consisting of normal recurring adjustments, have been included. Operating results for the interim periods presented are not necessarily indicative of the results that may be expected for the entire fiscal year.
The Company operates as one operating segment because its chief operating decision maker, who is the Chief Executive Officer, reviews its financial information on a consolidated basis for purposes of making decisions regarding allocating resources and assessing performance.
Reclassification
Beginning with the fourth quarter of fiscal year 2023, the Company presented Convertible Preferred Stock on its Consolidated Statements of Shareholders’ Equity and changed the name of the statement to Consolidated Statements of Convertible Preferred Stock and Shareholders’ Equity accordingly. Prior period amounts have been reclassified to conform to the current period presentation.
Recently Issued Accounting Pronouncements
ASU 2023-09, Income Taxes (Topic 740): Improvements to Income Tax Disclosures
In December 2023, the FASB issued ASU 2023-09, which expands income tax disclosure requirements to include additional information related to the rate reconciliation of effective tax rates to statutory rates as well as additional disaggregation of taxes paid. The amendments in the ASU also remove disclosures related to certain unrecognized tax benefits and deferred taxes. ASU 2023-09 is effective for fiscal years beginning after December 15, 2024, which is the Company's fiscal year 2026 annual
8
reporting period. The amendments may be applied prospectively or retrospectively, and early adoption is permitted. We are currently assessing the impact of the requirements on our consolidated financial statements and disclosures.
ASU 2023-07 Segment Reporting (Topic 280): Improvements to Reportable Segment Disclosures
In November 2023, the FASB issued ASU 2023-07, which expands reportable segment disclosure requirements, primarily through enhanced disclosures about significant segment expenses. The amendments in the ASU require that a public entity disclose, on an annual and interim basis, significant segment expenses that are regularly provided to an entity's chief operating decision maker (“CODM”), a description of other segment items by reportable segment, and any additional measures of a segment's profit or loss used by the CODM when deciding how to allocate resources. Annual disclosures are required for fiscal years beginning after December 15, 2023, which is the Company's fiscal year 2025 annual reporting period. Interim disclosures are required for periods within fiscal years beginning after December 15, 2024, which is the Company's fiscal year 2026 interim reporting periods. Retrospective application is required for all prior periods presented, and early adoption is permitted. We are currently assessing the impact of the requirements on our consolidated financial statements and disclosures.
3. ACCOUNTS RECEIVABLE
Accounts receivable includes amounts due to the Company for sales of equipment and subscription fees, settlement receivables for amounts due from third-party payment processors, receivables from contract manufacturers and unbilled amounts due from customers, net of the allowance for credit losses. Accounts receivable, net of the allowance for uncollectible accounts were $40.2 million as of December 31, 2023 and $30.2 million as of June 30, 2023.
Concentrations
As of December 31, 2023 and June 30, 2023, no customer represented more than 10% of the Company's accounts receivable, net of allowance.
Allowance for credit losses
The Company maintains an allowance for credit losses resulting from the inability of its customers to make required payments, including from a shortfall in the customer transaction fund flow from which the Company would normally collect amounts due. The allowance is calculated under an expected loss model. We estimate our allowance using an aging analysis (days past due status) of the receivables balances, primarily based on historical loss experience. Additionally, current conditions are analyzed to determine if the allowance calculation needs to be adjusted further for any qualitative factors impacting a customer’s ability to meet its financial obligations that is not already reflected through the historical loss analysis. The Company writes off receivable balances against the allowance for credit losses when management determines the balance is uncollectible and the Company ceases collection efforts.
The following table represents a rollforward of the allowance for credit losses for the six months ended December 31, 2023 and 2022:
| Six months ended December 31, | ||||||||||||||
| ($ in thousands) | 2023 | 2022 | ||||||||||||
| Beginning balance of allowance as of June 30 | $ | $ | ||||||||||||
| Provision for expected losses | ||||||||||||||
| Write-offs | ( | ( | ||||||||||||
| Balance at September 30, | $ | $ | ||||||||||||
| Provision for expected losses | ||||||||||||||
| Write-offs | ( | ( | ||||||||||||
| Balance at December 31 | $ | $ | ||||||||||||
9
4. FINANCE RECEIVABLES
The Company's finance receivables consist of financed devices under its financing program and devices contractually associated with the Seed platform. Predominately all of the Company’s finance receivables agreements are classified as non-cancellable sixty-month sales-type leases. As of December 31, 2023 and June 30, 2023, finance receivables consist of the following:
| ($ in thousands) | December 31, 2023 | June 30, 2023 | ||||||||||||
| Current finance receivables, net | $ | $ | ||||||||||||
| Finance receivables due after one year, net | ||||||||||||||
Total finance receivables, net of allowance of $ | $ | $ | ||||||||||||
We collect lease payments from customers primarily as part of the flow of funds from our transaction processing service. Balances are considered past due if customers do not have sufficient transaction revenue to cover the monthly lease payment by
the end of the monthly billing period.
Credit risk for finance receivables is continuously monitored by management and reflected within the allowance for finance receivables. As our finance receivables generally have similar risk characteristics, our key credit quality indicator is the aging (days past due status) of our aggregated finance receivables balances. Specifically, we estimate our allowance by using an aging analysis of the aggregated finance receivables balances, primarily based on historical loss experience. Additionally, current conditions are analyzed to determine if the allowance calculation needs to be adjusted further for any qualitative factors impacting a customer’s ability to meet its financial obligations that is not already reflected through the historical loss analysis. The Company writes off finance receivable balances against the allowance for credit losses when management determines the balance is uncollectible and the Company ceases collection efforts.
At December 31, 2023, the gross lease receivable by current payment performance on a contractual basis and year of origination consisted of the following:
| Leases by Origination | ||||||||||||||||||||||||||||||||||||||||||||
| ($ in thousands) | Up to 1 Year Ago | Between 1 and 2 Years Ago | Between 2 and 3 Years Ago | Between 3 and 4 Years Ago | Between 4 and 5 Years Ago | More than 5 Years Ago | Total | |||||||||||||||||||||||||||||||||||||
| Current | $ | $ | $ | $ | $ | $ | $ | |||||||||||||||||||||||||||||||||||||
| 30 days and under | ||||||||||||||||||||||||||||||||||||||||||||
| 31-60 days | ||||||||||||||||||||||||||||||||||||||||||||
| 61-90 days | ||||||||||||||||||||||||||||||||||||||||||||
| Greater than 90 days | ||||||||||||||||||||||||||||||||||||||||||||
| Total finance receivables | $ | $ | $ | $ | $ | $ | $ | |||||||||||||||||||||||||||||||||||||
At June 30, 2023, the gross lease receivable by current payment performance on a contractual basis and year of origination consisted of the following:
10
| Leases by Origination | ||||||||||||||||||||||||||||||||||||||||||||
| ($ in thousands) | Up to 1 Year Ago | Between 1 and 2 Years Ago | Between 2 and 3 Years Ago | Between 3 and 4 Years Ago | Between 4 and 5 Years Ago | More than 5 Years Ago | Total | |||||||||||||||||||||||||||||||||||||
| Current | $ | $ | $ | $ | $ | $ | $ | |||||||||||||||||||||||||||||||||||||
| 30 days and under | ||||||||||||||||||||||||||||||||||||||||||||
| 31-60 days | ||||||||||||||||||||||||||||||||||||||||||||
| 61-90 days | ||||||||||||||||||||||||||||||||||||||||||||
| Greater than 90 days | ||||||||||||||||||||||||||||||||||||||||||||
| Total finance receivables | $ | $ | $ | $ | $ | $ | $ | |||||||||||||||||||||||||||||||||||||
The following table represents a rollforward of the allowance for finance receivables for the six months ended December 31, 2023 and 2022:
| Six months ended December 31, | ||||||||||||||
| ($ in thousands) | 2023 | 2022 | ||||||||||||
| Balance at June 30 | $ | $ | ||||||||||||
| Provision for expected losses | ||||||||||||||
| Write-offs | ||||||||||||||
| Balance at September 30 | $ | $ | ||||||||||||
| Provision for expected losses | ||||||||||||||
| Write-offs | ( | |||||||||||||
| Balance at December 31 | $ | $ | ||||||||||||
Cash to be collected on our performing finance receivables due for each of the fiscal years is as follows:
| ($ in thousands) | |||||
| 2024 | $ | ||||
| 2025 | |||||
| 2026 | |||||
| 2027 | |||||
| 2028 | |||||
| Thereafter | |||||
| Total amounts to be collected | |||||
| Less: interest | ( | ||||
| Less: allowance for uncollectible receivables | ( | ||||
| Total finance receivables | $ | ||||
5. LEASES
Lessee Accounting
We have operating leases which are primarily real estate leases used for corporate functions, product development, sales, and other purposes. The following table provides supplemental balance sheet information related to the Company's operating leases:
11
| ($ in thousands) | Balance Sheet Classification | As of December 31, 2023 | As of June 30, 2023 | |||||||||||||||||
| Assets: | Operating lease right-of-use assets | $ | $ | |||||||||||||||||
| Liabilities: | ||||||||||||||||||||
| Current | $ | $ | ||||||||||||||||||
| Long-term | Operating lease liabilities, non-current | |||||||||||||||||||
| Total lease liabilities | $ | $ | ||||||||||||||||||
Supplemental cash flow information and non-cash activity related to our leases are as follows:
| ($ in thousands) | Six months ended December 31, 2023 | Six months ended December 31, 2022 | |||||||||
| Supplemental cash flow information: | |||||||||||
| Cash paid for amounts included in the measurement of operating lease liabilities | $ | $ | |||||||||
| Non-cash activity: | |||||||||||
| Lease assets obtained in exchange for new operating lease liabilities | $ | $ | |||||||||
Maturities of lease liabilities by fiscal year for our leases as of December 31, 2023 are as follows:
| ($ in thousands) | Operating Leases | ||||
| Remainder of 2024 | $ | ||||
| 2025 | |||||
| 2026 | |||||
| 2027 | |||||
| 2028 | |||||
| Thereafter | $ | ||||
| Total lease payments | $ | ||||
| Less: Imputed interest | ( | ||||
| Present value of lease liabilities | $ | ||||
In February 2023, the Company extended the lease for its existing Atlanta, Georgia office for an additional 73-months period including rent-free periods. The lease commenced on July 1, 2023 and we recognized right-of-use operating lease assets of $1.8 million in exchange for operating lease liabilities.
In May 2023, the Company signed a new lease for its office in Malvern, Pennsylvania. The new lease has a 133-months term from the move-in date which is expected to be March 2024. The Company determined the lease commenced on November 1, 2023 when the lessor granted early access to the Company. As a result, we recognized right-of-use operating lease assets of $4.9 million in exchange for operating lease liabilities.
Lessor Accounting
Property and equipment used for the operating lease rental program consisted of the following:
| ($ in thousands) | December 31, 2023 | June 30, 2023 | ||||||||||||
| Cost | $ | |||||||||||||
| Accumulated depreciation | ( | ( | ||||||||||||
| Net | $ | $ | ||||||||||||
12
For the three months ended December 31, 2023 and 2022, the Company recognized $2.0 million and $1.9 million of revenue from its device rental program, respectively, included in the Subscription and Transaction fees on its Condensed Consolidated Statements of Operations.
For the Six months ended December 31, 2023 and 2022, the Company recognized $4.0 million and $3.7 million of revenue from its device rental program, respectively, included in the Subscription and Transaction fees on its Condensed Consolidated Statements of Operations.
The Company’s net investment in sales-type leases (carrying value of lease receivables) and the future minimum amounts to be collected on these lease receivables as of December 31, 2023 are disclosed within Note 4 - Finance Receivables.
6. DEBT AND OTHER FINANCING ARRANGEMENTS
The Company's debt and other financing arrangements as of December 31, 2023 and June 30, 2023 consisted of the following:
| As of December 31, | As of June 30, | |||||||||||||
| ($ in thousands) | 2023 | 2023 | ||||||||||||
| JPMorgan Credit Facility* | ||||||||||||||
| Other obligations | ||||||||||||||
| Less: unamortized issuance costs and debt discount | ( | ( | ||||||||||||
| Total | ||||||||||||||
| Less: debt and other financing arrangements, current | ( | ( | ||||||||||||
| Debt and other financing arrangements, noncurrent | $ | $ | ||||||||||||
* See discussion below on amendment to the JPMorgan Credit Facility.
Details of interest expense presented on the Condensed Consolidated Statements of Operations are as follows:
| Three months ended | Six months ended | |||||||||||||||||||||||||
| December 31, | December 31, | |||||||||||||||||||||||||
| ($ in thousands) | 2023 | 2022 | 2023 | 2022 | ||||||||||||||||||||||
| JPMorgan Credit Facility* | ||||||||||||||||||||||||||
| Other interest expense | ||||||||||||||||||||||||||
| Total interest expense | $ | $ | $ | $ | ||||||||||||||||||||||
JPMorgan Chase Bank Credit Agreement
On March 17, 2022, the Company entered into an amended and restated credit agreement with JPMorgan Chase Bank, N.A. which provides for a $15 million secured revolving credit facility (the “Amended Revolving Facility”) and a $25 million secured term facility (the “Amended Secured Term Facility” and together with the Amended Revolving Facility, the “Amended JPMorgan Credit Facility”), and fully replaces our previous 2021 JPMorgan Credit Facility. The Amended Secured Term Facility includes a $10 million increase from the 2021 JPMorgan Secured Term Facility which is available for a period of up to twelve months following the Closing Date.
On December 1, 2022, the Company entered into a first amendment (the “2022 Amendment”) to its Amended and Restated Credit Agreement, dated as of March 17, 2022, which, among other things, amended the definition of the Company’s EBITDA under the Credit Agreement. On December 1, 2022, the Company borrowed an additional $25 million under the Amended JPMorgan Credit Facility, including $15 million from the revolving credit facility and $10 million from the term facility, to partially fund the cash consideration of the 32M acquisition as referenced in Note 9 - Acquisition. No issuance costs were capitalized in connection with this amendment.
The proceeds of the Amended JPMorgan Credit Facility may be used to refinance certain existing indebtedness of the Company and its subsidiaries, to finance the working capital needs, and for general corporate purposes (including permitted acquisitions), of the Company and its subsidiaries.
13
The Amended JPMorgan Credit Facility has a four-year maturity. Interest on the Amended JPMorgan Credit Facility will be based, at the Company’s option, on a base rate or SOFR plus an applicable margin tied to the Company’s total leverage ratio and having ranges of between 2.50 % and 3.00 % for base rate loans and between 3.50 % and 4.00 % for SOFR loans. Subject to the occurrence of a material acquisition and the Company’s total leverage ratio exceeding 3.00 to 1.00, the interest rate on the loans may increase by 0.25 %. In an event of default, the interest rate may be increased by 2.00 %. The Amended JPMorgan Credit Facility will also carry a commitment fee of 0.50 % per annum on the unused portion. As of December 31, 2023, the weighted-average interest rate for the Amended JPMorgan Credit Facility is approximately 8.9 %.
The Amended JPMorgan Credit Facility includes customary representations, warranties and covenants, and acceleration, indemnity and events of default provisions, including, among other things, two financial covenants. One financial covenant requires the Company to maintain, at all times, a total leverage ratio of not more than 3.00 to 1.00 on the last day of any fiscal quarter. The other financial covenant is conditional on a material acquisition occurring: if a material acquisition occurs, the Company is required to maintain a total leverage ratio not greater than 4.00 to 1.00 for the next four fiscal quarters following the material acquisition.
The Company’s obligations under its long-term debt agreements are carried at amortized cost, which approximates their fair value as of December 31, 2023, as the debt facility was recently amended in December 2022 and the interest rates applicable are variable in nature.
The Company was in compliance with its financial covenants for the Amended JPMorgan Credit Facility as of December 31, 2023.
The expected maturities associated with the Company’s outstanding debt and other financing arrangements as of December 31, 2023, were as follows:
| 2024 | $ | ||||
| 2025 | |||||
| 2026 | |||||
| 2027 | |||||
| Principal amounts payable | |||||
| Unamortized issuance costs | ( | ||||
| Total outstanding debt | $ | ||||
7. ACCRUED EXPENSES
Accrued expenses consisted of the following as of December 31, 2023 and June 30, 2023:
| As of December 31, | As of June 30, | |||||||||||||
| ($ in thousands) | 2023 | 2023 | ||||||||||||
| Sales tax reserve | $ | |||||||||||||
| Accrued compensation and related sales commissions | ||||||||||||||
| Operating lease liabilities, current | ||||||||||||||
| Accrued professional fees | ||||||||||||||
| Accrued taxes and filing fees payable | ||||||||||||||
| Other accrued expenses | ||||||||||||||
| Consideration withheld in escrow for the 32M acquisition* | ||||||||||||||
| Total accrued expenses | $ | $ | ||||||||||||
* See Note 9 - Acquisition for description of the arrangement.
8. GOODWILL AND INTANGIBLES
Intangible asset balances and goodwill consisted of the following:
14
| As of December 31, 2023 | ||||||||||||||||||||||||||
| ($ in thousands) | Gross | Accumulated Amortization | Net | Amortization Period | ||||||||||||||||||||||
| Intangible assets: | ||||||||||||||||||||||||||
| Brand and tradenames | $ | $ | ( | $ | ||||||||||||||||||||||
| Developed technology | ( | |||||||||||||||||||||||||
| Customer relationships | ( | |||||||||||||||||||||||||
| Total intangible assets | $ | $ | ( | $ | ||||||||||||||||||||||
| Goodwill | — | Indefinite | ||||||||||||||||||||||||
| As of June 30, 2023 | ||||||||||||||||||||||||||
| ($ in thousands) | Gross | Accumulated Amortization | Net | Amortization Period | ||||||||||||||||||||||
| Intangible assets: | ||||||||||||||||||||||||||
| Brand and tradenames | ( | |||||||||||||||||||||||||
| Developed technology | ( | |||||||||||||||||||||||||
| Customer relationships | ( | |||||||||||||||||||||||||
| Total intangible assets | $ | $ | ( | $ | ||||||||||||||||||||||
| Goodwill | — | Indefinite | ||||||||||||||||||||||||
During the three and six months ended December 31, 2023, the Company recognized $1.4 million and $3.0 million, respectively, in amortization expense related to intangible assets.
During the three and six months ended December 31, 2022, there was $0.8 million and $1.6 million for each respective period in amortization related to intangible assets that was recognized.
9. ACQUISITIONS
Three Square Market
On December 1, 2022, the Company acquired all of the equity interests of Three Square Market, Inc., a Wisconsin corporation, and Three Square Market Limited, a UK private limited company (collectively "32M") pursuant to an Equity Purchase Agreement. 32M is a leading provider of software and self-service kiosk-based point of sale and payment solutions to the micro market industry and the acquisition expanded the Company's presence in that industry. In addition to new technology and services, due to 32M’s existing customer base, the acquisition expanded the Company’s footprint into new global markets.
The acquisition of 32M was accounted for as a business combination using the acquisition method of accounting. The purchase price of the acquired company was allocated between tangible and intangible assets acquired and liabilities assumed from the acquired business based on their estimated fair values using primarily Level 3 inputs under ASC Topic 820, Fair Value Measurement, with the residual of the purchase price recorded as goodwill.
The Company paid an aggregate purchase price consideration of $41.1 million, which consisted of $36.6 million in cash and 1,240,920 shares of the Company's common stock (the "Stock Consideration") with an aggregate fair value of $4.5 million for the acquisition of 32M. The aggregate cash consideration includes $0.5 million of cash paid into an escrow account for net working capital and other post-closing adjustments. Additionally, the Stock Consideration of 1,240,920 shares ("Escrowed Shares") referred to above were placed into an escrow account to resolve indemnification claims for breach of certain representations and warranties. 50 % of the Escrowed Shares were released as of the first anniversary of the acquisition date and the remaining 50 % will be released on the second anniversary of the acquisition date, less any shares that may be returned to the
15
Company on account of any indemnity claims. The Escrowed Shares are considered to be issued and outstanding shares of the Company as of the acquisition date.
The company funded the cash consideration of the acquisition by borrowing $25 million of debt from the JPMorgan Credit Facility and the remaining consideration utilizing existing cash on hand.
The estimated fair value of the purchase price consideration consisted of the following:
| ($ in thousands) | |||||
| Closing cash consideration | $ | ||||
| Stock consideration | |||||
| Fair value of total consideration transferred | $ | ||||
The following table summarizes the adjusted fair value assigned to the assets acquired and liabilities assumed as of December 1, 2023.
| ($ in thousands) | Amount | ||||
| Cash and cash equivalents | $ | ||||
| Accounts receivable | |||||
| Inventories | |||||
| Intangible assets | |||||
| Other assets | |||||
| Total identifiable assets acquired | |||||
| Accounts payable | ( | ||||
| Tax liabilities | ( | ||||
| Total liabilities assumed | ( | ||||
| Total identifiable net assets | |||||
| Goodwill | |||||
| Fair value of total consideration transferred | $ | ||||
The Company determined the fair value of the identifiable intangible assets acquired with the assistance of third-party valuation consultants. Amounts allocated to identifiable intangible assets included $7.5 million related to developed technology, $7.5 million related to customer relationships, and $0.5 million related to trade names. The fair value of the acquired developed technology was determined using a multi-period excess earnings method. The fair value of the acquired customer relationships was determined using the with-and-without method which estimates the value using the cash flow impact in a scenario where the customer relationships are not in place. The significant unobservable inputs used in the valuation of the customer relationship asset and acquired developed technology asset are the revenue growth rates used in the development of the projected financial information used as an input to calculate those values and the discount rate applied. The recognized intangible assets will be amortized on a straight-line basis over the estimated useful lives of the respective assets. The estimated useful lives for developed technology, customer relationship, trade names were 5 , 5 and 3 years, respectively.
Goodwill of $26.2 million arising from the acquisition includes the expected synergies between 32M and the Company and intangible assets that do not qualify for separate recognition at the time of acquisition. The goodwill, which is deductible for income tax purposes, was assigned to the Company’s only reporting unit.
Subsequent to the acquisition closing date and within the one-year measurement period, the Company adjusted the purchase price allocation from what was initially recognized to reflect facts and circumstances in existence as of the acquisition close date. These adjustments included a net increase of $0.3 million to the overall purchase price consideration, a $2.3 million increase in intangible assets, a net decrease of $1.0 million in working capital, a $0.2 million increase in other assets, a $1.1 million increase in tax liabilities, and a $0.7 million decrease in accounts payable. Recognized goodwill increased by $0.6 million as a result of these adjustments. Furthermore, the Company recorded additional amortization expense of $0.5 million associated with the increase in fair value of the recognized intangible assets in its Consolidated Statement of Operations during the measurement period.
The above table represents the final allocation of the purchase price.
16
Supplemental disclosure of pro forma information
The following unaudited pro forma information presents a summary of our consolidated results of operations as if the acquisition had occurred on July 1, 2022. The pro forma information presented combines the historical condensed consolidated results of operations of the Company and 32M after giving effect to the preliminary purchase accounting impact of the 32M acquisition related costs (including, but not limited to, amortization associated with the acquired intangible assets, interest expense associated with the Credit Facility to finance a portion of the purchase price, acquisition related costs) and the alignment of accounting policies.
| Three months ended December 31, | Six months ended December 31, | |||||||||||||
| (In thousands) | 2022 | 2022 | ||||||||||||
| Revenues | $ | $ | ||||||||||||
| Net income (loss) | $ | $ | ( | |||||||||||
Yoke Payments
In August 2021, we completed the acquisition of certain assets and liabilities of Delicious Nutritious LLC, doing business as Yoke Payments (“Yoke”), a micro market payments company. The acquisition of Yoke was accounted for as a business combination using the acquisition method of accounting which includes the results of operations of the acquired business from the date of acquisition. The purchase price of the acquired company is allocated between tangible and intangible assets acquired and liabilities assumed from the acquired business based on their estimated fair values using primarily Level 3 inputs under ASC Topic 820, Fair Value Measurement, with the residual of the purchase price recorded as goodwill.
Through the acquisition, Yoke’s point of sale platform extended its offering to provide self-checkout while seamlessly integrating with Cantaloupe’s inventory management and payment processing platforms.
The consideration transferred for the acquisition included payments of $3 million in cash at the close of the transaction and $1 million in deferred cash payment due on or before July 30, 2022 based on the achievement of certain sales growth targets. On July 27, 2022, the Company made the cash payment of $1 million in accordance with the agreement consideration.
Additionally in connection with the acquisition, the Company will issue common stock to the former owners of Yoke based on the achievement of certain sales growth targets for software licenses through July 31, 2024 and continued employment as of the respective measurement dates. The accounting treatment for these awards in the context of the business combination is to recognize the awards as a post-combination expense and were not included in the purchase price. We will begin recognizing compensation expense for these awards over that requisite service period when it becomes probable that the performance condition would be satisfied. At each reporting date, we assess the probability of achieving the sales targets and fulfilling the performance condition. As of December 31, 2023, we determined that it is not probable that the performance condition would be satisfied and, accordingly, have not recognized compensation expense related to these awards.
The following table summarizes the total consideration paid for Yoke, total net assets acquired, identifiable assets and goodwill recognized at the acquisition date:
| ($ in thousands) | Amount | ||||
| Consideration | |||||
| Cash | $ | ||||
| Contingent consideration arrangement | |||||
| Fair value of total consideration transferred | |||||
| Recognized amounts of identifiable assets | |||||
| Total net assets acquired | |||||
| Identifiable intangible assets | |||||
| Total identifiable net assets | |||||
| Goodwill | $ | ||||
17
Amounts allocated to identifiable intangible assets included $0.9 million related to developed technology, $0.3 million related to customer relationships, and $0.1 million related to other intangible assets. The fair value of the acquired developed technology was determined using a multi-period excess earnings method. The fair value of the acquired customer relationships was determined using the with-and-without method which estimates the value using the cash flow impact in a scenario where the customer relationships are not in place. The recognized intangible assets will be amortized on a straight-line basis over the estimated useful lives of the respective assets.
Goodwill of $2.7 million arising from the acquisition includes the expected synergies between Yoke and the Company and intangible assets that do not qualify for separate recognition at the time of acquisition. The goodwill, which is deductible for income tax purposes, was assigned to the Company’s only reporting unit.
The above table represents the final allocation of the purchase price, noting no material measurement period adjustments. Pro forma financial information of the acquisition is not presented due to the immaterial impact of the financial results of Yoke in the Company's Consolidated Financial Statements.
10. REVENUES
Based on similar operational characteristics, the Company's revenues are disaggregated as follows:
| Three months ended December 31, | Six months ended December 31, | ||||||||||||||||||||||
| ($ in thousands) | 2023 | 2022 | 2023 | 2022 | |||||||||||||||||||
| Transaction fees | $ | $ | $ | $ | |||||||||||||||||||
| Subscription fees | |||||||||||||||||||||||
| Subscription and transaction fees | $ | $ | $ | $ | |||||||||||||||||||
| Equipment sales | |||||||||||||||||||||||
| Total revenues | $ | $ | $ | $ | |||||||||||||||||||
Contract Liabilities
The Company’s contract liability (i.e., deferred revenue) balances are as follows:
| Three months ended December 31, | ||||||||||||||
| ($ in thousands) | 2023 | 2022 | ||||||||||||
| Deferred revenue, beginning of the period | $ | $ | ||||||||||||
| Deferred revenue, end of the period | ||||||||||||||
| Revenue recognized in the period from amounts included in deferred revenue at the beginning of the period | $ | $ | ||||||||||||
| Six months ended December 31, | ||||||||||||||
| ($ in thousands) | 2023 | 2022 | ||||||||||||
| Deferred revenue, beginning of the period | $ | $ | ||||||||||||
| Deferred revenue, end of the period | ||||||||||||||
| Revenue recognized in the period from amounts included in deferred revenue at the beginning of the period | $ | $ | ||||||||||||
The change in the contract liability balances period-over-period is primarily the result of timing difference between the Company’s satisfaction of a performance obligation and payment from the customer.
Future Performance Obligations
18
The Company will recognize revenue in future periods related to remaining performance obligations for certain open contracts. Generally, these contracts have terms of one year or less. The amount of revenue related to unsatisfied performance obligations in which the original duration of the contract is greater than one year are primarily associated with the Company's Cantaloupe ONE rental program which has a contractual term of 36 months. The following table reflects the estimated fees to be recognized in the future related to performance obligations that are unsatisfied as of December 31, 2023:
| ($ in thousands) | As of December 31, 2023 | ||||
| Remainder of fiscal year 2024 | $ | ||||
| 2025 | |||||
| 2026 | |||||
| Thereafter | |||||
| Total | $ | ||||
Contract Costs
At December 31, 2023, the Company had net capitalized costs to obtain contracts of $0.6 million included in Prepaid expenses and other current assets and $2.8 million included in Other noncurrent assets on the Condensed Consolidated Balance Sheet. At June 30, 2023, the Company had net capitalized costs to obtain contracts of $0.6 million included in Prepaid expenses and other current assets and $2.8 million included in Other noncurrent assets on the Condensed Consolidated Balance Sheet. None of these capitalized contract costs were impaired.
During the three and six months ended December 31, 2023, amortization of capitalized contract costs was $0.2 million and $0.5 million, respectively. During the three and six months ended December 31, 2022, amortization of capitalized contract costs was $0.2 million and $0.4 million, respectively.
11. STOCK BASED COMPENSATION
Stock Options
The Company estimates the grant date fair value of the stock options with service conditions (i.e., a condition that requires an employee to render services to the Company for a stated period of time to vest) it grants using a Black-Scholes valuation model. The Company’s assumption for expected volatility is based on its historical volatility data related to market trading of its own common stock. The Company uses the simplified method to determine expected term, as the Company does not have adequate historical exercise and forfeiture behavior on which to base the expected life assumption. The dividend yield assumption is based on dividends expected to be paid over the expected life of the stock option. The risk-free interest rate assumption is determined by using the U.S. Treasury rates of the same period as the expected option term of each stock option.
The fair value of options granted during the six months ended December 31, 2023 and 2022 were determined using the following assumptions and includes only options with an established grant date under ASC 718:
| Six months ended December 31, | ||||||||||||||
| 2023 | 2022 | |||||||||||||
| Expected volatility (percent) | ||||||||||||||
| Weighted average expected life (years) | ||||||||||||||
| Dividend yield (percent) | % | % | ||||||||||||
| Risk-free interest rate (percent) | ||||||||||||||
| Number of options granted | ||||||||||||||
| Weighted average exercise price | $ | $ | ||||||||||||
| Weighted average grant date fair value | $ | $ | ||||||||||||
Stock based compensation related to stock options with an established grant date for the three and six months ended December 31, 2023 was $0.7 million and $1.8 million, respectively, and for the three and six months ended December 31, 2022 was $0.6 million and $1.6 million, respectively.
19
Performance based awards
The Company has awarded stock options to certain executives which vest each year over a to four year period. These stock options are subject to the achievement of performance goals to be established by the Company's Board for each fiscal year.
The Compensation Committee of the Board of Directors has established the performance metrics as a price target for the trading price of the Company’s common stock in each applicable fiscal year. The price target is achieved if the average closing price of the common stock during any consecutive 30 -trading-day period during the applicable fiscal year meets or exceeds: (i) $10.50 in the case of fiscal year 2021; (ii) $13.50 in the case of fiscal year 2022; (iii) $16.50 in the case of fiscal year 2023; and (iv) $19.50 in the case of fiscal year 2024. If at least 80 % of the performance goals for an applicable fiscal year are achieved, the Compensation Committee may determine that the portion of the option eligible to vest based on such fiscal year’s performance will vest on a prorated basis. In so determining, the Compensation Committee will consider the Company’s performance relative to its market competitors and any other considerations deemed relevant by the Compensation Committee. The Compensation Committee’s guideline is generally that for every percentage point the achieved price falls below the price target, the percentage of the performance options eligible to vest in respect of the applicable fiscal year should be reduced by 2 %, but the Compensation Committee may vary this formula in its sole discretion.
For these performance based awards that provide discretion to the Compensation Committee, a mutual understanding of the key terms and conditions between the Company and the employees have not yet been met and a "Grant Date" as defined in ASC Topic 718 Compensation — Stock Compensation, has not been established. When the service period begins prior to the grant date, the Company begins recognizing compensation cost before there is a grant date. The Company estimates the award's fair value at each reporting period for these equity-classified awards, until the grant date, utilizing a Monte Carlo simulation valuation model. The total benefit and expense recognized for the three and six months ended December 31, 2023 for these awards was $(0.2 ) million and $0.1 million, respectively. The benefit recognized during the three months ended December 31, 2023 was a result of the mark-to-market fair value adjustment. The total benefit recognized for the three and six months ended December 31, 2022 for these awards was $(0.9 ) million and $(1.1 ) million, respectively, as a result of reversing unvested grants for terminated executives during the period.
Common Stock Awards
The total expense recognized for common stock awards for the three and six months ended December 31, 2023 was $0.6 million and $1.1 million, respectively. The total expense recognized for common stock awards for the three and six months ended December 31, 2022 was $0.5 million and $1.0 million, respectively.
12. INCOME TAXES
For the three and six months ended December 31, 2023, the Company recorded an income tax provision of $0.1 million and $0.2 million, respectively. The income tax provision primarily relates to state income and franchise taxes and deferred taxes related to goodwill. As of December 31, 2023, the Company had a total unrecognized income tax benefit of $0.7 million. The provision is based upon actual income before income taxes for the three months ended December 31, 2023, as this provides a more reliable estimate of the income tax provision than an estimated annual effective income tax rate.
As of December 31, 2023, the Company assessed its existing deferred tax assets and continues to record a full valuation allowance against its deferred tax assets. We considered both positive and negative evidence when evaluating the need for the valuation allowance on our deferred tax assets in accordance with ASC 740. Available evidence includes historical financial information supplemented by currently available information about future years. Generally, historical financial information is more objectively verifiable than projections of future income and is therefore given more weight in our assessment. In management’s judgement there is not enough objectively verifiable information to provide sufficient positive evidence to counteract the negative evidence of historic losses. However, given the Company’s current earnings and anticipated future earnings, the Company believes that there is a reasonable possibility that within the next 12 months, sufficient positive evidence may become available in future reporting periods to allow the Company to reach a conclusion that a portion of the valuation allowance will no longer be needed. Release of the valuation allowance would result in the recognition of certain deferred tax assets and a decrease to income tax expense for the period the release is recorded. The exact timing and amount of a potential valuation allowance release are subject to change on the basis of the level of profitability that the Company is able to actually achieve and limitations to the use of certain historical net operating losses.
For the three months ended December 31, 2022, the Company recorded an income tax provision of $42 thousand. For the six months ended December 31, 2022, the Company recorded an income tax provision of $67 thousand. As of December 31, 2022, the Company reviewed the existing deferred tax assets and continues to record a full valuation allowance against its deferred tax
20
assets. The income tax provisions primarily relate to the Company's uncertain tax positions, as well as state income and franchise taxes. As of December 31, 2022, the Company had a total unrecognized income tax benefit of $0.6 million. The provision is based upon actual loss before income taxes for the six months ended December 31, 2022, as this provides a more reliable estimate of the income tax provision than an estimated annual effective income tax rate.
13. EARNINGS (LOSS) PER SHARE CALCULATION
Basic earnings (loss) per share is computed by dividing net earnings (loss) by the weighted average number of common shares outstanding during the period. Diluted earnings per share, applicable only to years ended with reported income, is computed by dividing net income by the weighted average number of common shares outstanding during the period plus the dilutive effect of outstanding stock options and restricted stock-based awards using the treasury stock method. The calculation of basic and diluted earnings (loss) per share is presented below:
| Three months ended December 31, | ||||||||||||||
| ($ in thousands, except per share data) | 2023 | 2022 | ||||||||||||
| Numerator for basic and diluted loss per share | ||||||||||||||
| Net income (loss) | $ | ( | ||||||||||||
| Preferred dividends | $ | |||||||||||||
| Net income (loss) applicable to common shareholders | ( | |||||||||||||
Denominator for basic earnings (loss) per share - Weighted average shares outstanding | ||||||||||||||
| Effect of dilutive potential common shares | ||||||||||||||
Denominator for diluted earnings (loss) per share - Adjusted weighted average shares outstanding | ||||||||||||||
| Basic earnings (loss) per share | $ | $ | ( | |||||||||||
| Diluted earnings (loss) per share | $ | $ | ( | |||||||||||
| Six months ended December 31, | ||||||||||||||
| ($ in thousands, except per share data) | 2023 | 2022 | ||||||||||||
| Numerator for basic and diluted loss per share | ||||||||||||||
| Net income (loss) | $ | ( | ||||||||||||
| Preferred dividends | ( | $ | ( | |||||||||||
| Net income (loss) applicable to common shareholders | ( | |||||||||||||
Denominator for basic earnings (loss) per share - Weighted average shares outstanding | ||||||||||||||
| Effect of dilutive potential common shares | ||||||||||||||
Denominator for diluted earnings (loss) per share - Adjusted weighted average shares outstanding | ||||||||||||||
| Basic earnings (loss) per share | $ | $ | ( | |||||||||||
| Diluted earnings (loss) per share | $ | $ | ( | |||||||||||
Potentially anti-dilutive shares excluded from the calculation of diluted earnings per share were approximately 1 million for the three and six months ended December 31, 2023. Potentially anti-dilutive shares excluded from the calculation of diluted loss per share were approximately 5
14. SHAREHOLDERS' EQUITY AND PREFERRED STOCK
21
During the six months ended December 31, 2022, the Company retired 59,281 shares of its Series A convertible preferred stock that it purchased for an aggregate amount of approximately $2.45 million. The repurchase transaction was primarily accounted for as an extinguishment of preferred stock and recorded as a decrease to the carrying value of the preferred stock in the amount of $0.42 million and common stock of $1.73 million for an aggregate amount of $2.15 million that was included within the Cash flows from financing activities in the Condensed Consolidated Statements of Cash Flows. The remaining $0.3 million was deemed to be an amount in excess of the fair value of the preferred stock and was recorded within Operating expenses in the Condensed Consolidated Statements of Operations and Cash flows from operating activities in the Condensed Consolidated Statements of Cash Flows.
15. COMMITMENTS AND CONTINGENCIES
Litigation
We are a party to litigation and other proceedings that arise in the ordinary course of our business. These types of matters could result in fines, penalties, compensatory or treble damages or non-monetary sanctions or relief. In accordance with the accounting guidance for contingencies, we reserve for litigation claims and assessments asserted or threatened against us when a loss is probable and the amount of the loss can be reasonably estimated. We cannot predict the outcome of legal or other proceedings with certainty.
Leases
The Company has entered into various operating lease obligations. See Note 5 - Leases for additional information.
Outstanding Debt
The Company has debt and other financing arrangements. See Note 6 - Debt and other financing arrangements for additional information.
Purchase Commitments
16. RELATED PARTY TRANSACTIONS
A member of our Board of Directors serves as a strategic advisor to a consulting firm that we utilize for payments analytics and advisory services. These services are utilized by the Company to reduce the cost of our interchange and other processing fees charged by payment processors and credit card networks. As consideration for the services, we pay the consulting firm a success fee based on the savings realized by the Company, and a recurring monthly subscription fee for the analytical services. The total expense recognized within Cost of subscription and transaction fees for the three and six months ended December 31, 2023 for these arrangements was $0.1 0.1
17. SUBSEQUENT EVENTS
On February 1, 2024, the Company acquired Cheq Lifestyle Technology, Inc., an innovative fan-facing POS and mobile-first ordering platform, for $4.8 million in cash. Due to the close proximity of the acquisition close to the filing date, a preliminary purchase price allocation is not available.
22
Item 2. Management’s Discussion and Analysis of Financial Condition and Results of Operations
Management’s Discussion and Analysis of Financial Condition and Results of Operations should be read in conjunction with the condensed consolidated financial statements and related notes included in this Form 10-Q.
Forward-Looking Statements
This Form 10‑Q contains certain forward-looking statements within the meaning of Section 21E of the Securities Exchange Act of 1934, as amended, regarding, among other things, the anticipated financial and operating results of Cantaloupe, Inc. For this purpose, forward-looking statements are any statements contained herein that are not statements of historical fact and include, but are not limited to, those preceded by or that include the words, “estimate,” “could,” “should,” “would,” “likely,” “may,” “will,” “plan,” “intend,” “believes,” “expects,” “anticipates,” “projected,” or similar expressions. Those statements are subject to known and unknown risks, uncertainties and other factors that could cause the actual results to differ materially from those contemplated by the statements. The forward-looking information is based on various factors and was derived using numerous assumptions. Important factors that could cause the Company’s actual results to differ materially from those projected include, for example:
•general economic, market or business conditions unrelated to our operating performance, including inflation, rising interest rates, financial institution disruptions, public health emergencies and declines in consumer confidence and discretionary spending;
• our ability to compete with our competitors and increase market share;
• failure to comply with the financial covenants in the Amended JPMorgan Credit Facility;
• our ability to raise funds in the future through sales of securities or debt financing in order to sustain operations in the normal course of business or if an unexpected or unusual event were to occur;
• disruptions in or inefficiencies to our supply chain and/or operations;
• the risks related to the availability of, and cost inflation in, supply chain inputs, including labor, raw materials, packaging and transportation;
•weather, climate conditions, natural disasters or other unexpected events;
• whether our current or future customers purchase, lease, rent or utilize our devices, software solutions or our other products in the future at levels currently anticipated;
• whether our customers continue to utilize the Company’s transaction processing and related services, as our customer agreements are generally cancellable by the customer on thirty to sixty days’ notice;
•our ability to acquire and develop relevant technology offerings for current, new and potential customers and partners;
•risks and uncertainties associated with our expansion into and our operations in Europe, Latin America and other foreign markets, including general economic conditions, policy changes affecting international trade, political instability, inflation rates, recessions, sanctions, foreign currency exchange rates and controls, foreign investment and repatriation restrictions, legal and regulatory constraints, civil unrest, armed conflict, war and other economic and political factors;
• our ability to satisfy our trade obligations included in accounts payable and accrued expenses;
•our ability to attract, develop and retain key personnel, or our loss of the services of our key executives;
• the incurrence by us of any unanticipated or unusual non-operating expenses, which may require us to divert our cash resources from achieving our business plan;
• our ability to predict or estimate our future quarterly or annual revenue and expenses given the developing and unpredictable market for our products;
• our ability to integrate acquired companies into our current products and services structure;
• our ability to add new customers and retain key existing customers from whom a significant portion of our revenue is derived;
• the ability of a key customer to reduce or delay purchasing products from us;
• our ability to obtain widespread commercial acceptance of our products and service offerings;
23
• whether any patents issued to us will provide any competitive advantages or adequate protection for our products, or would be challenged, invalidated or circumvented by others;
• our ability to operate without infringing the intellectual property rights of others;
• the ability of our products and services to avoid disruptions to our systems or unauthorized hacking or credit card fraud;
• geopolitical conflicts, such as the ongoing conflict between Russia and Ukraine, and the conflict between Israel and Hamas;
• whether we are able to fully remediate our material weaknesses in our internal controls over financial reporting or continue to experience material weaknesses in our internal controls over financial reporting in the future, and are not able to accurately or timely report our financial condition or results of operations;
• the ability to remain in compliance with the continued listing standards of the Nasdaq Global Select Market (“Nasdaq”) and continue to remain as a member of the US Small-Cap Russell 2000®;
• whether our suppliers would increase their prices, reduce their output or change their terms of sale; and
• the risks associated with cyber attacks and data breaches.
Although we believe that the expectations reflected in the forward-looking statements are reasonable, we cannot guarantee future results, levels of activity, performance, or achievements. Actual results or business conditions may differ materially from those projected or suggested in forward-looking statements as a result of various factors including, but not limited to, those described above, or those discussed under Part I, Item 1A. “Risk Factors” of our Annual Report on Form 10-K for the fiscal year ended June 30, 2023 (“2023 Form 10-K”). We cannot assure you that we have identified all the factors that create uncertainties. Moreover, new risks emerge from time to time and it is not possible for our management to predict all risks, nor can we assess the impact of all risks on our business or the extent to which any risk, or combination of risks, may cause actual results to differ from those contained in any forward-looking statements. Readers should not place undue reliance on forward-looking statements.
Any forward-looking statement made by us in this Form 10-Q speaks only as of the date of this Form 10-Q. Unless required by law, we undertake no obligation to publicly revise any forward-looking statement to reflect circumstances or events after the date of this Form 10-Q or to reflect the occurrence of unanticipated events.
OVERVIEW OF THE COMPANY
Cantaloupe, Inc. is a global technology leader powering self-service commerce. With over a million active locations across the globe processing more than a billion transactions every year, Cantaloupe is enabling businesses of all sizes to provide self-service experiences for consumers. The company's vertically integrated solutions fuel growth by offering micro-payments processing, enterprise cloud software, IoT technology, as well as kiosk and POS innovations. Cantaloupe’s end-to-end platform increases consumer engagement and sales revenue through digital payments, consumer promotions and loyalty programs, while providing business owners increased profitability by leveraging software to drive efficiencies across an entire operation. Cantaloupe’s solutions are used by a wide variety of consumer services in North America, Europe, Latin America, and Australia including vending machines, micro markets and smart retail, laundromats, metered parking terminals, amusement and entertainment venues, IoT services and more.
The Company's fiscal year ends June 30. The Company generates revenues in multiple ways. During the three months ended December 31, 2023 and December 31, 2022, we derived approximately 86% and 80%, respectively, from subscription and transaction fees, and 14% and 20%, respectively, from equipment sales. During the six months ended December 31, 2023 and
December 31, 2022, we derived approximately 87% and 81%, respectively, from subscription and transaction fees and 13% and
19%, respectively, from equipment sales.
Active Devices (as defined below) operating on the Company’s platform and using our services include those resulting from the sale or lease of our point of sale ("POS") electronic payment devices, telemetry devices or certified payment software or the servicing of similar third-party installed POS terminals or telemetry devices. Customers can obtain POS electronic payment devices from us in the following ways:
•Purchasing hardware directly from the Company or one of its authorized resellers;
•Financing hardware under the Company’s financing program, which are non-cancellable 60-month sales-type leases, through an unrelated equipment financing company, if available, or directly from the Company; and
•Renting devices under the Company’s Cantaloupe One program, which are typically 36-months duration agreements.
24
Key Developments during the Quarter
Highlights of the Company for the fiscal quarter ended December 31, 2023 are below:
•Approximately 30,027 Active Customers (as defined below) and 1.23 million Active Devices on our service;
•Revenues of $65.4 million, an increase of 6.6% year over year. The increase was led by higher transaction fees and subscription fees revenue;
•We showcased our full suite of solutions and products for the Mexico market at Cantaloupe LIVE Mexico. Multiple attendees including strategic partners, cooler manufacturers, vending machine distributors and vending operators had the opportunity to interact with Cantaloupe’s technology and learn how we can support their business growth in cashless payments, micro markets and vending management software;
•We launched Seed Analytics and Seed Intelligence, two new premium analytics tools available within the Seed Pro platform, designed to transform the way vending operators leverage data for business growth with improved decision-making and enhanced productivity;
•We showcased our solutions for enabling self-service in the convenience store industry at the National Association of Conveniences Stores ("NACS") Show 2023.
As of December 31, 2023, we have approximately 280 full-time employees in the United States, United Kingdom, and Mexico and offices in Malvern, Pennsylvania; Atlanta, Georgia; River Falls, Wisconsin; Birmingham, United Kingdom; and Mexico City, Mexico.
25
QUARTERLY RESULTS OF OPERATIONS
The following discussion should be read in conjunction with the condensed consolidated financial statements and related notes included in this Form 10-Q.
Selected Operating Metrics
We use certain operating metrics (Active Devices, Active Customers, Total Number of Transactions and Total Dollar Volume, Average Revenue Per Unit) and certain non-GAAP financial measures (Adjusted EBITDA) which are defined below to evaluate our business and operations, measure our performance, identify trends affecting our business, project our future performance, and make strategic decisions. Additionally, refer to the non-GAAP Financial Measures section below for additional information and their reconciliation to the most comparable GAAP measure.
Active Devices
Active Devices are devices that have communicated with us or have had a transaction in the last twelve months. Included in the number of Active Devices are devices that communicate through other devices that communicate or transact with us. A self-service retail location that utilizes an ePort cashless payment device as well as Seed management services constitutes only one device.
Active Customers
The Company defines Active Customers as all customers with at least one active device.
Total Number of Transactions and Total Dollar Volume of Transactions
Transactions are defined as electronic payment transactions that are processed by our technology-enabled solutions. Management uses Total Number and Dollar Volume of transactions to evaluate the effectiveness of our new customer strategy and our ability to leverage existing customers and partners.
Average Revenue Per Unit
The Company defines average revenue per unit ("ARPU") as our total subscription and transaction fees for the trailing 12 months divided by average total active devices for the trailing 12 months.
Adjusted EBITDA (non-GAAP)
The Company defines Adjusted EBITDA (non-GAAP) as U.S. GAAP net income (loss) before (i) interest income, (ii) interest expense on debt and reserves, (iii) income tax provision, (iv) depreciation, (v) amortization, (vi) stock-based compensation expense, (vii) fees and charges, net of reimbursement from insurance proceeds, that were incurred in connection with the 2019 Investigation and financial statement restatement activities as well as proxy solicitation costs that are not indicative of our core operations, (viii) certain other significant infrequent or unusual losses and gains that are not indicative of our core operations such as integration and acquisition expenses, and (ix) severance expenses that are non-recurring and are not indicative of our core operations.
The following table represents our selected operating metrics for the periods indicated:
26
| As of and for the three months ended | |||||||||||||||||||||||||||||
| December 31, 2023 | September 30, 2023 | June 30, 2023 | March 31, 2023 | December 31, 2022 | |||||||||||||||||||||||||
| Devices: | |||||||||||||||||||||||||||||
| Active Devices (thousands) | 1,226 | 1,192 | 1,168 | 1,150 | 1,150 | ||||||||||||||||||||||||
| Customers: | |||||||||||||||||||||||||||||
| Active Customers | 30,027 | 29,670 | 28,584 | 27,598 | 26,335 | ||||||||||||||||||||||||
| Volumes: | |||||||||||||||||||||||||||||
| Total Number of Transactions (millions) | 286.7 | 283.6 | 278.6 | 267.8 | 273.7 | ||||||||||||||||||||||||
| Total Dollar Volume of Transactions (millions) | 730.1 | 724.8 | 703.5 | 653.6 | 649.4 | ||||||||||||||||||||||||
Subscription and transaction fees - Trailing 12 months (thousands) | $ | 215,380 | $ | 208,283 | $ | 200,223 | $ | 192,147 | $ | 183,045 | |||||||||||||||||||
| Average revenue per unit (ARPU) | $ | 181.91 | $ | 178.78 | $ | 173.39 | $ | 167.52 | $ | 160.46 | |||||||||||||||||||
Highlights for the quarter ended December 31, 2023 include:
•1.23 million Active Devices compared to the same quarter last year of 1.15 million, an increase of approximately 76 thousand Active Devices, or 6.6%;
•30,027 Active Customers on our service compared to the same quarter last year of 26,335, an increase of 3,692 Active Customers, or 14.0%; and
•$730.1 million in Total Dollar Volume of Transactions for the quarter ended December 31, 2023 compared to $649.4 million for the quarter ended December 31, 2022, an increase of $80.7 million, or 12.4%. See "Revenues and Gross Margin" in Management’s Discussion and Analysis of Financial Condition and Results of Operations below for additional information.
FINANCIAL PERFORMANCE
The following tables summarize our results of operations and significant changes in our financial performance for the periods presented:
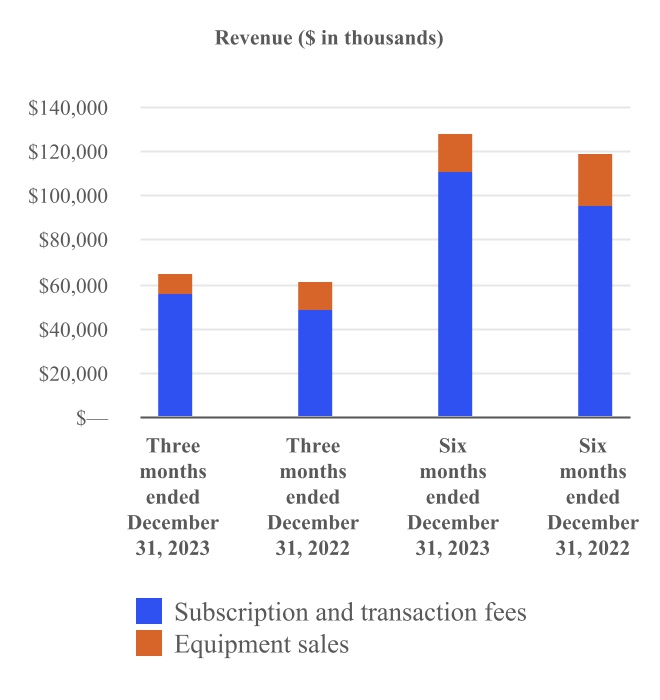

27
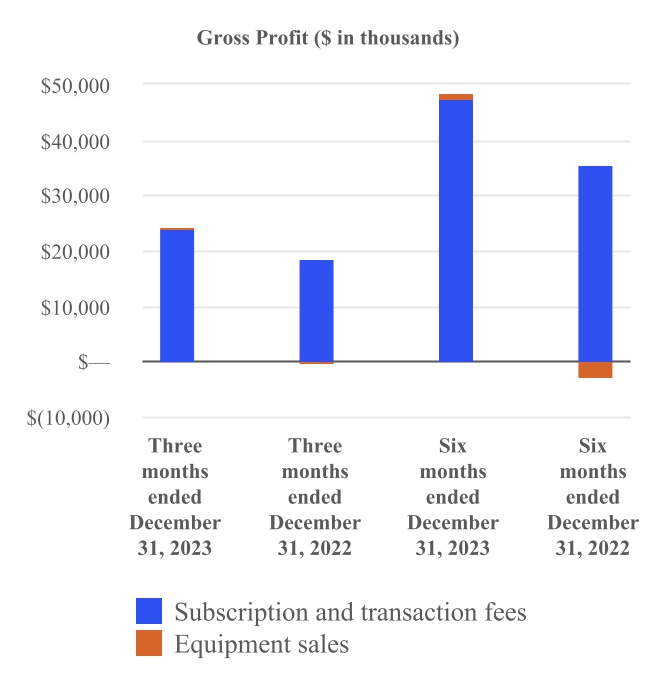
28
Three Months Ended December 31, 2023 Compared to Three Months Ended December 31, 2022
| Three months ended December 31, | Change | |||||||||||||||||||||||||
| ($ in thousands) | 2023 | 2022 | Amount | Percentage | ||||||||||||||||||||||
| Revenues: | ||||||||||||||||||||||||||
| Subscription and transaction fees | $ | 56,029 | $ | 48,932 | $ | 7,097 | 14.5 | % | ||||||||||||||||||
| Equipment sales | 9,330 | 12,398 | (3,068) | (24.7) | % | |||||||||||||||||||||
| Total revenues | 65,359 | 61,330 | 4,029 | 6.6 | % | |||||||||||||||||||||
Costs of sales: | ||||||||||||||||||||||||||
| Cost of subscription and transaction fees | 31,885 | 30,202 | 1,683 | 5.6 | % | |||||||||||||||||||||
| Cost of equipment sales | 9,158 | 12,687 | (3,529) | (27.8) | % | |||||||||||||||||||||
| Total costs of sales | 41,043 | 42,889 | (1,846) | (4.3) | % | |||||||||||||||||||||
Gross profit: | ||||||||||||||||||||||||||
| Subscription and transaction fees | 24,144 | 18,730 | 5,414 | 28.9 | % | |||||||||||||||||||||
| Equipment sales | 172 | (289) | 461 | 159.5 | % | |||||||||||||||||||||
Total gross profit | $ | 24,316 | $ | 18,441 | $ | 5,875 | 31.9 | % | ||||||||||||||||||
Gross margin: | ||||||||||||||||||||||||||
| Subscription and transaction fees | 43.1 | % | 38.3 | % | ||||||||||||||||||||||
| Equipment sales | 1.8 | % | (2.3) | % | ||||||||||||||||||||||
Total gross margin | 37.2 | % | 30.1 | % | ||||||||||||||||||||||
Revenues. Total revenues increased by $4.0 million for the three months ended December 31, 2023 compared to the same period in 2022. The increase in revenues is attributed to a $7.1 million increase in subscription and transaction fees, partially offset by a $3.1 million decrease in equipment sales.
The increase in subscription and transaction fees was primarily driven by increased processing volumes with an approximately 12.4% increase in total dollar volumes of transactions for the current fiscal year quarter relative to the prior year quarter. We continue to benefit as businesses, schools and other organizations across the country continue to maintain normal levels of operations and due to an increase in the average revenue per unit and total number of active devices relative to the same period in the prior year. Our subscription fees have increased 9.7% for the three months ended December 31, 2023 compared to the same period in 2022 which is attributed to a continued focus of management to grow our recurring subscription services to our customer base and an 14.0% increase in our Active Customers compared to last year. The acquisition of 32M contributed $3.3 million to our subscription and transactions fees for the three months ended December 31, 2023.
The decrease in equipment sales in the current fiscal year quarter was primarily driven by decreased equipment shipments compared to the prior year fiscal quarter. In the prior year, our customers were in the process of upgrading their devices to ensure compatibility with the emerging 4G network, resulting in a surge in equipment shipments. As of December 31, 2022, the 3G to 4G network upgrade has been fully completed in the U.S. market. Our equipment margin improved during the current year quarter as we have completed our strategic discounts offered to our existing customers in the prior year fiscal quarter to ensure their proper transitions into the new 4G platform.
Costs of sales. Costs of sales decreased $1.8 million for the three months ended December 31, 2023 compared to the prior year period. The decrease in costs of sales was primarily due to a $3.5 million decrease in equipment costs, partially offset by a $1.7 million increase in subscription and transaction costs. The decrease in equipment costs was primarily driven by lower equipment sales volume in the current year period.
Gross margin. Total gross margin increased to 37.2% for the three months ended December 31, 2023 from 30.1% for the three months ended December 31, 2022. The increases were primarily a result of higher margins in both subscription and transaction fee and equipment sales.
29
Operating Expenses
| Three months ended December 31, | Change | |||||||||||||||||||||||||
| Category ($ in thousands) | 2023 | 2022 | Amount | Percentage | ||||||||||||||||||||||
| Sales and marketing | $ | 4,367 | $ | 3,210 | $ | 1,157 | 36.0 | % | ||||||||||||||||||
| Technology and product development | 3,030 | 5,299 | (2,269) | (42.8) | % | |||||||||||||||||||||
| General and administrative expenses | 10,505 | 6,559 | 3,946 | 60.2 | % | |||||||||||||||||||||
Investigation, proxy solicitation and restatement expenses, net of insurance recoveries | — | 150 | (150) | (100.0) | % | |||||||||||||||||||||
| Integration and acquisition expenses | 93 | 2,787 | (2,694) | (96.7) | % | |||||||||||||||||||||
| Depreciation and amortization | 2,736 | 1,350 | 1,386 | 102.7 | % | |||||||||||||||||||||
| Total operating expenses | $ | 20,731 | $ | 19,355 | $ | 1,376 | 7.1 | % | ||||||||||||||||||
Total operating expenses. Operating expenses increased 7.1% for the three months ended December 31, 2023 compared to the same period in 2022. See further details on individual categories below.
Sales and marketing. Sales and marketing expenses increased approximately $1.2 million for the three months ended December 31, 2023 compared to the same period in 2022 due to increased compensation costs as a result of higher sales and marketing employee headcount in the current quarter to support our expanding business and service offerings in the United States and internationally.
Technology and product development. Technology and product development expenses decreased by $2.3 million for the three months ended December 31, 2023. The decrease in the current year was driven by lower expensed personnel costs as we continued to invest in internal-use software which resulted in higher capitalized costs compared to the prior year.
General and administrative expenses. General and administrative expenses increased by $3.9 million for the three months ended December 31, 2023 compared to the same period in 2022 primarily due to a $1.7 million increase in compensation related expenses, a $0.8 million increase in bad debt expense, a $0.5 million increase in connection with non-recurring project work related to remediating previously identified material weaknesses in our internal control over financial reporting, and a $0.3 million increase in rent and occupancy expenses.
Integration and acquisition expenses. On December 1, 2022, the Company acquired all of the equity interests of Three Square Market, Inc., a Wisconsin corporation, and Three Square Market Limited, a UK private limited company (collectively "32M") pursuant to an Equity Purchase Agreement. Integration and acquisition expenses decreased by $2.7 million for the three months ended December 31, 2023 compared to the same period in the prior year as we have substantially completed the post-acquisition integration process. Integration and acquisition expenses incurred for the three month period ended December 31, 2022 primarily consisted of professional services fees from accounting, legal and investment banking advisors leading up to and for the successful completion of the 32M acquisition.
Depreciation and amortization. Depreciation and amortization expenses increased $1.4 million for the three months ended December 31, 2023 compared to the same period in 2022. The increase was primarily driven by the amortization of intangible assets associated with the acquisition of 32M in December 2022.
Other Income (Expense), Net
| Three months ended December 31, | Change | |||||||||||||||||||||||||
| ($ in thousands) | 2023 | 2022 | Amount | Percentage | ||||||||||||||||||||||
| Other income (expense): | ||||||||||||||||||||||||||
Interest income from leases | $ | 493 | $ | 878 | $ | (385) | (43.8) | % | ||||||||||||||||||
| Interest expense | (1,002) | (518) | (484) | (93.4) | % | |||||||||||||||||||||
Other expense | 129 | 23 | 106 | (460.9) | % | |||||||||||||||||||||
| Total other (expense) income, net | $ | (380) | $ | 383 | $ | (763) | 199.2 | % | ||||||||||||||||||
Other income (expense), net. Other expenses increased $0.8 million for the three months ended December 31, 2023 as compared to the same period in 2022. Our interest expense increased $0.5 million primarily due to our additional borrowing of $25 million to fund a portion of the 32M acquisition in the prior fiscal year.
30
Six Months Ended December 31, 2023 Compared to Six Months Ended December 31, 2022
| Six months ended December 31, | Change | |||||||||||||||||||||||||
| ($ in thousands) | 2023 | 2022 | Amount | Percent | ||||||||||||||||||||||
| Revenues: | ||||||||||||||||||||||||||
| Subscription and transaction fees | $ | 111,164 | $ | 96,007 | $ | 15,157 | 15.8 | % | ||||||||||||||||||
| Equipment sales | 16,878 | 23,105 | (6,227) | (27.0) | % | |||||||||||||||||||||
| Total revenues | 128,042 | 119,112 | 8,930 | 7.5 | % | |||||||||||||||||||||
Costs of sales: | ||||||||||||||||||||||||||
| Cost of subscription and transaction fees | 63,613 | 60,572 | 3,041 | 5.0 | % | |||||||||||||||||||||
| Cost of equipment sales | 15,785 | 25,937 | (10,152) | (39.1) | % | |||||||||||||||||||||
| Total costs of sales | 79,398 | 86,509 | (7,111) | (8.2) | % | |||||||||||||||||||||
| Gross profit: | ||||||||||||||||||||||||||
| Subscription and transaction fees | 47,551 | 35,435 | 12,116 | 34.2 | % | |||||||||||||||||||||
| Equipment sales | 1,093 | (2,832) | 3,925 | (138.6) | % | |||||||||||||||||||||
| Total gross profit | $ | 48,644 | $ | 32,603 | $ | 16,041 | 49.2 | % | ||||||||||||||||||
| Gross margin: | ||||||||||||||||||||||||||
| Subscription and transaction fees | 42.8 | % | 36.9 | % | ||||||||||||||||||||||
| Equipment sales | 6.5 | % | (12.3) | % | ||||||||||||||||||||||
Total gross margin | 38.0 | % | 27.4 | % | ||||||||||||||||||||||
Revenues. Total revenues increased by $8.9 million for the six months ended December 31, 2023 compared to the same period in 2022. The increase in revenues was attributed to a $15.2 million increase in subscription and transaction fees, and a $6.2 million decrease in equipment sales.
The increase in subscription and transaction fees was primarily driven by increased processing volumes, with an approximately 13% increase in total dollar volumes for the six months ended December 31, 2023 compared to the same period in 2022. Our transaction fees increased $11.2 million, or 17.6%, as we continue to benefit as businesses, schools and other organizations across the country continue to maintain normal levels of operations and due to an increase in the average price per transaction and total number of transactions relative to the same period in the prior year. Our subscription fees increased approximately $3.9 million, or 12.1% for the six months ended December 31, 2023 compared to the same period in 2022 which was attributed to a continued focus of management to grow our recurring subscription services, the successful expansion of the Cantaloupe One program to our customer base, and the acquisition of 32M.
The decrease in equipment sales in the current fiscal year period was primarily driven by decreased equipment shipments compared to the prior year fiscal period. In the prior year, our customers continued upgrading their devices to ensure compatibility with the emerging 4G network, resulting in a surge in equipment shipments. As of December 31, 2022, the 3G to 4G network upgrade has been fully completed in the U.S. market.
Costs of sales. Costs of sales decreased $7.1 million for the six months ended December 31, 2023 compared to the same period in 2022. The decrease was driven by a $10.2 million decrease in equipment costs partially offset by an increase of $3.0 million in subscription and transaction costs.
The decrease in costs of sales for equipment was primarily driven by decreased equipment sales. The increased demand in the first half of the prior fiscal year was related to our customers upgrading their payment devices in anticipation of the 3G network discontinuation events described above (See 3G Network discontinuation and upgrade cycle section).
The increase in subscription and transaction costs was primarily driven by an increase in transaction processing fees corresponding with an increase in processing volumes and total dollar volume of transactions. The acquisition of 32M in December 2022 also contributed an approximately $2.7 million increase in our subscription and transaction costs for the six months ended December 31, 2023.
31
Gross margin. Total gross margin increased to 38.0% for the six months ended December 31, 2023 from 27.4% for the six months ended December 31, 2022. The increases were primarily a result of higher margins in subscription and transaction fees.
Operating Expenses
| Six months ended December 31, | Change | |||||||||||||||||||||||||
| Category ($ in thousands) | 2023 | 2022 | Amount | Percentage | ||||||||||||||||||||||
| Sales and marketing | $ | 8,509 | $ | 5,735 | 2,774 | 48.4 | % | |||||||||||||||||||
| Technology and product development | 7,198 | 12,164 | (4,966) | (40.8) | % | |||||||||||||||||||||
| General and administrative expenses | 20,943 | 18,137 | 2,806 | 15.5 | % | |||||||||||||||||||||
| Investigation, proxy solicitation and restatement expenses | — | 547 | (547) | (100.0) | % | |||||||||||||||||||||
| Integration and acquisition expenses | 171 | 2,787 | (2,616) | (93.9) | % | |||||||||||||||||||||
| Depreciation and amortization | 5,483 | 2,666 | 2,817 | 105.7 | % | |||||||||||||||||||||
| Total operating expenses | $ | 42,304 | $ | 42,036 | $ | 268 | 0.6 | % | ||||||||||||||||||
Total operating expenses. Operating expenses increased approximately $0.3 million for the six months ended December 31, 2023 compared to the same period in 2022. The increase was attributed to a $2.8 million increase in general and administrative expenses, a $2.8 million increase in sales and marketing expenses, a $2.6 million decrease in integration and acquisition expenses, and a $2.8 million increase in depreciation and amortization. See further details on individual categories below.
Sales and marketing. Sales and marketing expenses increased approximately $2.8 million for the six months ended December 31, 2023 compared to the same period in 2022 primarily due to higher sales and marketing employee headcount in the current year to support our expanding business and service offerings in the United States and internationally.
Technology and product development. Technology and product development decreased $5.0 million for the six months ended December 31, 2023 compared to the same period in 2022. The decrease in the current year was driven by lower expensed personnel costs as we continued to invest in internal-use software which resulted in higher capitalized costs compared to the prior year.
General and administrative expenses. General and administrative expenses increased approximately $2.8 million for the six months ended December 31, 2023, as compared to the same period in 2022. The increase in general and administrative expenses was primarily driven by a $3.3 million increase in personnel compensation cost as a result of our growing business.
Integration and acquisition. On December 1, 2022, the Company acquired all of the equity interests of Three Square Market, Inc., a Wisconsin corporation, and Three Square Market Limited, a UK private limited company (collectively "32M") pursuant to an Equity Purchase Agreement. For the six months ended December 31, 2023, the Company incurred professional services fees of $0.2 million related to post-acquisition integration. The Company incurred $2.8 million for the six months ended December 31, 2022 from accounting, legal and investing banking advisors leading up to and for the successful completion of the 32M acquisition.
Depreciation and amortization. During the six months ended December 31, 2023, the Company had an increase in depreciation and amortization costs of $2.8 million compared to the same period in the prior year due to the acquisition of 32M in December 2022 and increased depreciation for our growing Internal-use software as various projects and initiatives are implemented. Our increase in internal-use software is attributable to management's focus on developing innovative technologies to further strengthen our network environment and platform.
Other Income (Expense)
| Six months ended December 31, | Change | |||||||||||||||||||||||||
| ($ in thousands) | 2023 | 2022 | Amount | Percentage | ||||||||||||||||||||||
| Other income (expense): | ||||||||||||||||||||||||||
| Interest income | $ | 1,010 | $ | 1,445 | (435) | (30.1) | % | |||||||||||||||||||
| Interest expense | (2,109) | (995) | (1,114) | 112.0 | % | |||||||||||||||||||||
| Other income (expense) | 52 | (97) | 149 | (153.6) | % | |||||||||||||||||||||
| Total other income (expense) | $ | (1,047) | $ | 353 | (1,400) | (396.6) | % | |||||||||||||||||||
32
Other income (expense), net. Other income (expense), net decreased $1.4 million for the six months ended December 31, 2023 as compared to the same period in 2022 primarily driven by an increase in interest expense of $1.1 million due to higher outstanding debt balance in the current year, partially offset by an decrease in interest income of approximately $0.4 million due to less outstanding balances on finance receivables.
33
Non-GAAP Financial Measures
We use certain financial measures internally to evaluate our performance and make financial and operational decisions that are presented in a manner that adjusts from their equivalent GAAP measures or that supplement the information provided by our GAAP measures. We use these adjusted results because we believe they more clearly highlight trends in our business that may not otherwise be apparent when relying solely on GAAP financial measures, since these measures eliminate from our results specific financial items that have less bearing on our core operating performance.
We use these measures in communicating certain aspects of our results and performance, including in this Quarterly Report, and believe that these measures, when viewed in conjunction with our GAAP results and the accompanying reconciliations, can provide investors with greater transparency and a greater understanding of factors affecting our financial condition and results of operations than GAAP measures alone. In addition, we believe the presentation of these measures is useful to investors for making period-to-period comparisons of results because the adjustments to GAAP are not reflective of our core business performance. Furthermore, certain measures are utilized as metrics in our executive offer and management incentive compensation plans.
These financial measures are not presented in accordance with, or as an alternative to, GAAP financial measures and may be different from non-GAAP measures used by other companies. We encourage investors to review the GAAP financial measures included in this Quarterly Report, including our condensed consolidated financial statements, to aid in their analysis and understanding of our performance and in making comparisons.
Adjusted EBITDA (Non-GAAP)
Adjusted earnings before income taxes, depreciation, and amortization (“Adjusted EBITDA”) is a non-GAAP financial measure which is not required by or defined under GAAP. We define Adjusted EBITDA as U.S. GAAP net income (loss) before (i) interest income, (ii) interest expense on debt and reserves, (iii) income tax provision, (iv) depreciation, (v) amortization, (vi) stock-based compensation expense, (vii) fees and charges, net of reimbursement from insurance proceeds, that were incurred in connection with the 2019 Investigation and financial statement restatement activities as well as proxy solicitation costs that are not indicative of our core operations, (viii) certain other significant infrequent or unusual losses and gains that are not indicative of our core operations such as integration and acquisition expenses, and (ix) severance expenses that are non-recurring and are not indicative of our core operations.
Below is a reconciliation of U.S. GAAP net income (loss) to Adjusted EBITDA (non-GAAP):
| Three months ended December 31, | Six months ended December 31, | |||||||||||||||||||||||||
| ($ in thousands) | 2023 | 2022 | 2023 | 2022 | ||||||||||||||||||||||
U.S. GAAP net income (loss) | $ | 3,124 | $ | (573) | $ | 5,131 | $ | (9,147) | ||||||||||||||||||
Less: interest income from leases | (493) | (878) | (1,010) | (1,445) | ||||||||||||||||||||||
| Plus: interest expense | 1,002 | 518 | 2,109 | 995 | ||||||||||||||||||||||
| Plus: income tax provision | 81 | 42 | 162 | 67 | ||||||||||||||||||||||
Plus: depreciation included in cost of subscription and transaction fees for rental equipment | 380 | 312 | 722 | 554 | ||||||||||||||||||||||
Plus: depreciation and amortization in operating expenses | 2,736 | 1,350 | 5,483 | 2,666 | ||||||||||||||||||||||
| EBITDA | 6,830 | 771 | 12,597 | (6,310) | ||||||||||||||||||||||
Plus: stock-based compensation (1) | 1,111 | 160 | 3,043 | 1,477 | ||||||||||||||||||||||
Plus: integration and acquisition expenses (2) | 93 | 2,787 | 171 | 2,787 | ||||||||||||||||||||||
Plus: remediation expenses (3) | 453 | — | 497 | — | ||||||||||||||||||||||
Plus: investigation, proxy solicitation and restatement expenses, net of insurance recoveries (4) | — | 150 | — | 547 | ||||||||||||||||||||||
Adjustments to EBITDA | 1,657 | 3,097 | 3,711 | 4,811 | ||||||||||||||||||||||
Adjusted EBITDA (non-GAAP) | $ | 8,487 | $ | 3,868 | $ | 16,308 | $ | (1,499) | ||||||||||||||||||
(1) As an adjustment to EBITDA, we have excluded stock-based compensation, as it does not reflect our cash-based operations.
(2) As an adjustment to EBITDA, we have excluded expenses incurred in connection with business acquisitions as it does not represent recurring costs or charges related to our core operations.
(3) As an adjustment to EBITDA, we have excluded expense incurred in connection with non-recurring work related to remediating previously identified material weaknesses in our internal control over financial reporting.
(4) As an adjustment to EBITDA, we have excluded the costs and corresponding reimbursements related to the 2019 Investigation, because we believe that they represent charges that are not related to our core operations. The 2019 Investigation has been fully resolved as of fiscal year 2023.
34
LIQUIDITY AND CAPITAL RESOURCES
Sources and Uses of Cash
Historically, we have financed our operations primarily through cash from operating activities, debt financings, and equity issuances. The Company's primary sources of capital available are cash and cash equivalents on hand of $43.5 million as of December 31, 2023 and the cash that we expect to be provided by operating activities by the Company.
The Company also has estimated and recorded for potential sales tax and related interest and penalty liabilities of $14.8 million in the aggregate as of December 31, 2023. The Company continues to evaluate these liabilities and the amount and timing of any such payments.
The Company believes that its current financial resources will be sufficient to fund its current twelve-month operating budget from the date of issuance of these condensed consolidated financial statements. Our primary focus as part of our core operations to increase cash flow from operating activities is to prioritize collection efforts to reduce outstanding accounts receivable, utilize existing inventory to support equipment sales over the next year, focusing on various operational efficiencies to improve overall profitability of the business and continued to grow our business both domestically and internationally.
Below are charts that reflect our cash liquidity and outstanding debt as of December 31, 2023 and June 30, 2023:
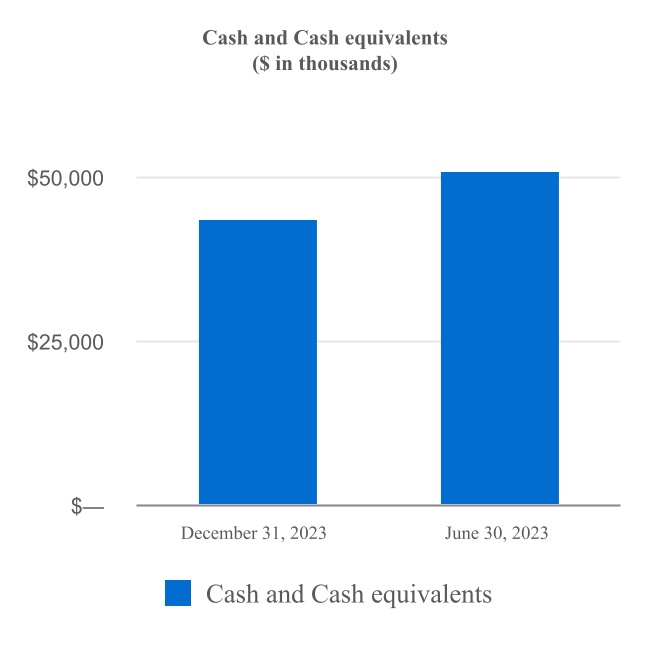

35
Cash Flows
See Condensed Consolidated Statement of Cash Flows in Part I, Item 1 of this Quarterly Report for details on the changes in cash and cash equivalents classified by operating, investing and financing activities during our respective reporting periods.
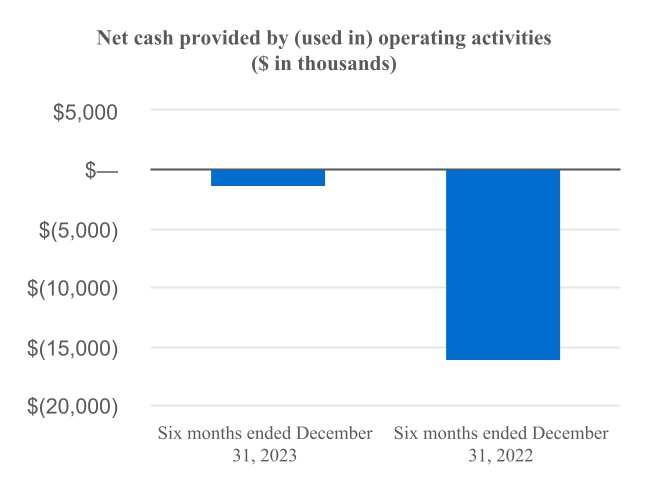
Net cash used in operating activities
For the six months ended December 31, 2023, net cash used in operating activities was $1.2 million which reflects our net income of $5.1 million and non-cash operating charges of $12.8 million, partially offset by $19.2 million of cash utilized by working capital accounts. The change in working capital accounts was primarily driven by a $12.3 million increase of accounts receivable, and a decrease in accounts payable and accrued expenses of $2.9 million in the period. Increase in cash utilized by accounts receivable was a result of increased sales during the six months ended December 31, 2023 and the timing of the cash receipts compared to the prior year period.
For the six months ended December 31, 2022, net cash used in operating activities was $16.1 million, which reflected our net loss of $9.1 million adjusted by $7.4 million in non-cash operating charges and $14.3 million of cash utilized by working capital accounts. The change in working capital accounts is primarily driven by cash used of $5.4 million to increase our inventory on hand and an increase of accounts receivable of $6.7 million in the period. Increase in inventory was driven by increased equipment sales as well as strategic planning to mitigate potential supply chain disruptions. Increase in cash utilized by accounts receivable was a result of increased sales during the six months ended December 31, 2022 compared to the prior year period.
Non-cash operating charges primarily consisted of stock-based compensation, depreciation of property and equipment, amortization of our intangible assets, and provisions for expected losses for the six months ended December 31, 2023 and 2022.
Net cash used in investing activities
Net cash used in investing activities was $5.9 million for the six months ended December 31, 2023. We invested $5.9 million in property and equipment as the Company continued to focus on investing in innovative technologies and products, and increasing rental devices enrolled in the Company's Cantaloupe One program.
Net cash used in investing activities was $45.3 million for the six months ended December 31, 2022. Increase in cash used is due to the cash paid for the 32M acquisition of $35.9 million and $9.4 million for increased property and equipment balances driven primarily by the Company's continued focus on investing in technologies and products and increasing rental devices enrolled in the Company's Cantaloupe one program.
Net cash provided by financing activities
Net cash used in financing activities was $0.3 million for the six months ended December 31, 2023, which is primarily driven by debt repayments on the JPMorgan Credit Facility.
Net cash provided of financing activities was $21.5 million for the six months ended December 31, 2022 which was primarily due to the borrowing of $25 million from our Credit Facility to fund a portion of the cash consideration for the 32M acquisition
36
offset by $2.2 million to repurchase our series A Convertible Stock and a $1 million payment for contingent consideration relating to the Yoke acquisition.
CONTRACTUAL OBLIGATIONS
During the six months ended December 31, 2023, there were no significant changes to our contractual obligations from those disclosed in the section “Management’s Discussion and Analysis of Financial Condition and Results of Operations” in our Annual Report on Form 10-K for the fiscal year ended June 30, 2023.
CRITICAL ACCOUNTING ESTIMATES
There have been no material changes to our critical accounting estimates from those disclosed in our Annual Report on Form 10-K for the fiscal year ended June 30, 2023.
Recent Accounting Pronouncements
See Note 2 - Summary of Significant Accounting Policies to the condensed consolidated financial statements for a description of recent accounting pronouncements.
Item 3. Quantitative and Qualitative Disclosures about Market Risk
As of December 31, 2023, we are exposed to market risk related to changes in interest rates on our outstanding borrowings. Our Amended JPMorgan Credit Facility has a four-year maturity. Interest on the Amended JPMorgan Credit Facility will be based, at the Company’s option, on a base rate or SOFR plus an applicable margin tied to the Company’s total leverage ratio and having ranges of between 2.50% and 3.00% for base rate loans and between 3.50% and 4.00% for SOFR loans. As of December 31, 2023, we have $38.2 million total outstanding borrowings, an increase of 100 basis points in SOFR Rate would result in a change in interest expense of $0.4 million per year.
We are also exposed to market risk related to changes in interest rates on our cash investments. We invest our excess cash in money market funds that we believe are highly liquid and marketable in the short term. These investments earn a floating rate of interest and are not held for trading or other speculative purposes. Consequently, our exposure to market risks for interest rate changes related to our money market funds is not material. Market risks related to fluctuations of foreign currencies are not material and we have no freestanding derivative instruments as of December 31, 2023.
Item 4. Controls and Procedures
(a) Disclosure Controls and Procedures
We maintain disclosure controls and procedures to ensure that information required to be disclosed by us in the reports that we file or submit under the Securities Exchange Act of 1934, as amended (the “Exchange Act”), is recorded, processed, summarized and reported within the time periods specified in the SEC’s rules and forms, and that such information is accumulated and communicated to our management, including our chief executive officer and chief financial officer, to allow timely decisions regarding required disclosure.
Our management, with the participation of our chief executive officer and chief financial officer, has evaluated the effectiveness as of the end of the period covered by this Form 10-Q of our disclosure controls and procedures as defined in Rule 13a-15(e) under the Exchange Act. Based on this evaluation, our management, including our chief executive officer and chief financial officer, has concluded that our disclosure controls and procedures were not effective as of December 31, 2023, as a result of the material weaknesses in our internal control over financial reporting, which are described in Item 9A. of our 2023 Form 10-K.
(b) Changes in Internal Control over Financial Reporting
Other than the remediation plan disclosed in Item 9A. of our 2023 Form 10-K, there have been no changes in the Company’s internal control over financial reporting that occurred during the fiscal quarter ended December 31, 2023 that have materially affected, or are reasonably likely to materially affect, our internal controls over financial reporting.
We are in the process of executing remediation activities to alleviate the material weaknesses identified in the remediation plan disclosed in Item 9A. of our 2023 Form 10-K. The Company hired a public accounting firm to assist with the remediation efforts. As part of the remediation work performed specifically in the second quarter of fiscal year 2024, the Company
37
identified a series of control enhancements necessary to remediate the material weaknesses and the Company began implementing those enhancements in the third quarter of fiscal year 2024. The remediation efforts will remain ongoing until such enhancements to our internal controls are fully implemented and tested by management. The material weaknesses cannot be considered remediated until the related controls have operated for a sufficient period of time and until management has concluded, through testing, that the controls are operating effectively.
38
Part II - Other Information
Item 1. Legal Proceedings
The information required by this Item is incorporated herein by reference to the Notes to condensed consolidated financial statements, Note 15 – Commitments and Contingencies in Part I, Item 1, of this Quarterly Report on Form 10-Q.
Item 1A. Risk Factors
For a discussion of the Company’s risk factors, see the information under the heading “Risk Factors” in the Company’s Annual Report on Form 10-K for the fiscal year ended June 30, 2023.
Item 2. Unregistered Sales of Equity Securities and Use of Proceeds
N/A
Item 3. Defaults Upon Senior Securities
There were no defaults on any senior securities. The total liquidation preference including accrued and unpaid dividends on our Series A Convertible Preferred Stock as of December 31, 2023 was $22.4 million. The dividend accrual dates for our Preferred Stock are February 1 and August 1. The annual cumulative dividend on our Preferred Stock is $1.50 per share.
Item 4. Mine Safety Disclosures
N/A
Item 5. Other Information
Rule 10b5-1 Trading Plans
During the fiscal quarter ended December 31, 2023, none of the Company's director or executive officers adopted terminated
Item 6. Exhibits
39
| Exhibit Number | Description | |||||||
| 3.1 | ||||||||
| 3.2 | ||||||||
| 31.1* | ||||||||
| 31.2* | ||||||||
| 32.1** | ||||||||
| 32.2** | ||||||||
| 101 | The following financial information from our Quarterly Report on Form 10-Q for the quarter ended December 31, 2023, filed with the SEC on February 8, 2024, is formatted in Inline Extensible Business Reporting Language (“iXBRL”): (1) the Condensed Consolidated Balance Sheets as of December 31, 2023 and June 30, 2023, (2) the Condensed Consolidated Statements of Operations for the three-month and six-month periods ended December 31, 2023 and 2022, (3) the Condensed Consolidated Statements of Other Comprehensive Income (Loss) for the three-month and six-month periods ended December 31, 2023 and 2022, (4) the Condensed Consolidated Statements of Convertible Preferred Stock and Shareholders’ Equity for the three-month and six-month periods ended December 31, 2023 and 2022, (5) the Condensed Consolidated Statements of Cash Flows for the six-month periods ended December 31, 2023 and 2022, and (6) the Notes to Condensed Consolidated Financial Statements. | |||||||
| 101.INS | XBRL Instance Document - the instance document does not appear in the Interactive Data File because its XBRL tags are embedded within the Inline XBRL document | |||||||
| 101.SCH* | Inline XBRL Taxonomy Extension Schema | |||||||
| 101.CAL* | Inline XBRL Taxonomy Extension Calculation Linkbase | |||||||
| 101.DEF* | Inline XBRL Taxonomy Extension Definition Linkbase | |||||||
| 101.LAB* | Inline XBRL Taxonomy Extension Label Linkbase | |||||||
| 101.PRE* | Inline XBRL Taxonomy Extension Presentation Linkbase | |||||||
| 104 | The cover page from our Quarterly Report on Form 10-Q for the quarter ended December 31, 2023, filed with the SEC on February 8, 2024, is formatted as Inline iXBRL and contained in Exhibit 101. | |||||||
______________________________________
* Filed herewith.
** Furnished herewith.
40
Pursuant to the requirements of the Securities Exchange Act of 1934, the registrant has duly caused this report to be signed on its behalf by the undersigned thereunto duly authorized.
| Cantaloupe, Inc. | |||||
| Date: February 8, 2024 | /s/ Ravi Venkatesan | ||||
| Ravi Venkatesan | |||||
| Chief Executive Officer | |||||
| Date: February 8, 2024 | /s/ Scott Stewart | ||||
| Scott Stewart | |||||
| Chief Financial Officer | |||||
41