UNITED STATES SECURITIES AND EXCHANGE COMMISSION
Washington, D.C. 20549
Form 10-Q
Quarterly Report pursuant to Section 13 or 15(d) of the Securities Exchange Act of 1934 | |||||||||||
| For the quarterly period ended | |||||||||||
| or | |||||||||||
Transition Report pursuant to Section 13 or 15(d) of the Securities Exchange Act of 1934 for the transition period from to | |||||||||||
Commission file number: 001-36079
(Exact name of Registrant as specified in its charter)
| (State or other jurisdiction of incorporation or organization) | (I.R.S. Employer Identification Number) | |||||||||||||
(Address of principal executive offices, including zip code)
(651 ) 355-6000
(Registrant's telephone number, including area code)
Securities registered pursuant to Section 12(b) of the Act:
| Title of each class | Trading symbol(s) | Name of each exchange on which registered | ||||||
Indicate by check mark whether the Registrant (1) has filed all reports required to be filed by Section 13 or 15(d) of the Securities Exchange Act of 1934 during the preceding 12 months (or for such shorter period that the Registrant was required to file such reports), and (2) has been subject to such filing requirements for the past 90 days.
Indicate by check mark whether the Registrant has submitted electronically every Interactive Data File required to be submitted pursuant to Rule 405 of Regulation S-T (§232.405 of this chapter) during the preceding 12 months (or for such shorter period that the Registrant was required to submit such files).
Indicate by check mark whether the Registrant is a large accelerated filer, an accelerated filer, a non-accelerated filer, a smaller reporting company, or an emerging growth company. See the definitions of "large accelerated filer," "accelerated filer," "smaller reporting company," and "emerging growth company" in Rule 12b-2 of the Exchange Act.
Large accelerated filer ☐ Accelerated filer ☐ Non-accelerated filer ☑ Smaller reporting company ☐ Emerging growth company ☐
If an emerging growth company, indicate by check mark if the Registrant has elected not to use the extended transition period for complying with any new or revised financial accounting standards provided pursuant to Section 13(a) of the Exchange Act. ☐
Indicate by check mark whether the Registrant is a shell company (as defined in Rule 12b-2 of the Exchange Act).
Yes ☐ No ☑
Indicate the number of shares outstanding of each of the issuer's classes of common stock, as of the latest practicable date:
The issuer has no common stock outstanding.
TABLE OF CONTENTS
| Page No. | ||||||||
Unless the context otherwise requires, for purposes of this Quarterly Report on Form 10-Q, the words "CHS," "we," "us" and "our" refer to CHS Inc., a Minnesota cooperative corporation, and its subsidiaries as of February 29, 2024 .
FORWARD-LOOKING STATEMENTS
This Quarterly Report on Form 10-Q contains, and our other CHS Inc. publicly available documents contain, and our officers, directors and representatives may from time to time make, "forward-looking statements" within the meaning of the safe harbor provisions of the U.S. Private Securities Litigation Reform Act of 1995. Forward-looking statements can be identified by words such as "anticipate," "intend," "plan," "goal," "seek," "believe," "project," "estimate," "expect," "strategy," "future," "likely," "may," "should," "will" and similar references to future periods. Forward-looking statements are neither historical facts nor assurances of future performance. Instead, they are based only on our current beliefs, expectations and assumptions regarding the future of our businesses, financial condition and results of operations, future plans and strategies, projections, anticipated events and trends, the economy and other future conditions. Because forward-looking statements relate to the future, they are subject to inherent uncertainties, risks and changes in circumstances that are difficult to predict and many of which are outside of our control. Our actual results and financial condition may differ materially from those indicated in the forward-looking statements. Therefore, you should not place undue reliance on any of these forward-looking statements. Important factors that could cause our actual results and financial condition to differ materially from those indicated in the forward-looking statements are discussed or identified in our filings made with the U.S. Securities and Exchange Commission, including in the "Risk Factors" discussion in Item 1A of CHS Annual Report on Form 10-K for the fiscal year ended August 31, 2023. These factors may include changes in commodity prices; the impact of government policies, mandates, regulations and trade agreements; global and regional political, economic, legal and other risks of doing business globally; the ongoing war between Russia and Ukraine; the escalation of conflict in the Middle East; the impact of inflation; the impact of epidemics, pandemics, outbreaks of disease and other adverse public health developments, including COVID-19; the impact of market acceptance of alternatives to refined petroleum products; consolidation among our suppliers and customers; nonperformance by contractual counterparties; changes in federal income tax laws or our tax status; the impact of compliance or noncompliance with applicable laws and regulations; the impact of any governmental investigations; the impact of environmental liabilities and litigation; actual or perceived quality, safety or health risks associated with our products; the impact of seasonality; the effectiveness of our risk management strategies; business interruptions, casualty losses and supply chain issues; the impact of workforce factors; our funding needs and financing sources; financial institutions’ and other capital sources’ policies concerning energy-related businesses; technological improvements that decrease the demand for our agronomy and energy products; our ability to complete, integrate and benefit from acquisitions, strategic alliances, joint ventures, divestitures and other nonordinary course-of-business events; security breaches or other disruptions to our information technology systems or assets; the impact of our environmental, social and governance practices, including failures or delays in achieving our strategies or expectations related to climate change or other environmental matters; the impairment of long-lived assets; the impact of bank failures; and other factors affecting our businesses generally. Any forward-looking statements made by us in this document are based only on information currently available to us and speak only as of the date on which the statement is made. We undertake no obligation to update any forward-looking statement, whether written or oral, that may be made from time to time, whether as a result of new information, future developments or otherwise except as required by applicable law.
1
PART I. FINANCIAL INFORMATION
ITEM 1. FINANCIAL STATEMENTS
CHS INC. AND SUBSIDIARIES
CONDENSED CONSOLIDATED BALANCE SHEETS
(Unaudited)
| February 29, 2024 | August 31, 2023 | ||||||||||
| (Dollars in thousands) | |||||||||||
| ASSETS | |||||||||||
| Current assets: | |||||||||||
| Cash and cash equivalents | $ | $ | |||||||||
| Receivables | |||||||||||
| Inventories | |||||||||||
| Other current assets | |||||||||||
Total current assets | |||||||||||
| Investments | |||||||||||
| Property, plant and equipment | |||||||||||
| Other assets | |||||||||||
Total assets | $ | $ | |||||||||
| LIABILITIES AND EQUITIES | |||||||||||
| Current liabilities: | |||||||||||
| Notes payable | $ | $ | |||||||||
| Current portion of long-term debt | |||||||||||
| Accounts payable | |||||||||||
| Accrued expenses | |||||||||||
| Other current liabilities | |||||||||||
Total current liabilities | |||||||||||
| Long-term debt | |||||||||||
| Other liabilities | |||||||||||
| Commitments and contingencies (Note 13) | |||||||||||
| Equities: | |||||||||||
| Preferred stock | |||||||||||
| Equity certificates | |||||||||||
| Accumulated other comprehensive loss | ( | ( | |||||||||
| Capital reserves | |||||||||||
Total CHS Inc. equities | |||||||||||
| Noncontrolling interests | |||||||||||
Total equities | |||||||||||
Total liabilities and equities | $ | $ | |||||||||
The accompanying notes are an integral part of the condensed consolidated financial statements (unaudited).
2
CHS INC. AND SUBSIDIARIES
CONDENSED CONSOLIDATED STATEMENTS OF OPERATIONS
(Unaudited)
| Three Months Ended | Six Months Ended | ||||||||||||||||||||||
| February 29, 2024 | February 28, 2023 | February 29, 2024 | February 28, 2023 | ||||||||||||||||||||
| (Dollars in thousands) | |||||||||||||||||||||||
| Revenues | $ | $ | $ | $ | |||||||||||||||||||
| Cost of goods sold | |||||||||||||||||||||||
| Gross profit | |||||||||||||||||||||||
| Marketing, general and administrative expenses | |||||||||||||||||||||||
| Operating earnings | |||||||||||||||||||||||
| Interest expense | |||||||||||||||||||||||
| Other income | ( | ( | ( | ( | |||||||||||||||||||
| Equity income from investments | ( | ( | ( | ( | |||||||||||||||||||
| Income before income taxes | |||||||||||||||||||||||
| Income tax expense | |||||||||||||||||||||||
| Net income | |||||||||||||||||||||||
| Net income (loss) attributable to noncontrolling interests | ( | ||||||||||||||||||||||
| Net income attributable to CHS Inc. | $ | $ | $ | $ | |||||||||||||||||||
The accompanying notes are an integral part of the condensed consolidated financial statements (unaudited).
3
CHS INC. AND SUBSIDIARIES
CONDENSED CONSOLIDATED STATEMENTS OF COMPREHENSIVE INCOME
(Unaudited)
| Three Months Ended | Six Months Ended | ||||||||||||||||||||||
| February 29, 2024 | February 28, 2023 | February 29, 2024 | February 28, 2023 | ||||||||||||||||||||
| (Dollars in thousands) | |||||||||||||||||||||||
| Net income | $ | $ | $ | $ | |||||||||||||||||||
| Other comprehensive income (loss), net of tax: | |||||||||||||||||||||||
| Pension and other postretirement benefits | ( | ||||||||||||||||||||||
| Cash flow hedges | ( | ||||||||||||||||||||||
| Foreign currency translation adjustment | ( | ( | ( | ||||||||||||||||||||
| Other comprehensive income (loss), net of tax | ( | ( | |||||||||||||||||||||
| Comprehensive income | |||||||||||||||||||||||
| Comprehensive income (loss) attributable to noncontrolling interests | ( | ||||||||||||||||||||||
| Comprehensive income attributable to CHS Inc. | $ | $ | $ | $ | |||||||||||||||||||
The accompanying notes are an integral part of the condensed consolidated financial statements (unaudited).
4
CHS INC. AND SUBSIDIARIES
CONDENSED CONSOLIDATED STATEMENTS OF CASH FLOWS
(Unaudited)
| Six Months Ended | |||||||||||
| February 29, 2024 | February 28, 2023 | ||||||||||
| (Dollars in thousands) | |||||||||||
| Cash flows from operating activities: | |||||||||||
| Net income | $ | $ | |||||||||
| Adjustments to reconcile net income to net cash provided by (used in) operating activities: | |||||||||||
| Depreciation and amortization, including amortization of deferred major maintenance | |||||||||||
| Equity income from investments, net of distributions received | ( | ||||||||||
| Provision for current expected credit losses | ( | ||||||||||
| Deferred taxes | ( | ( | |||||||||
| Other, net | ( | ( | |||||||||
| Changes in operating assets and liabilities: | |||||||||||
| Receivables | ( | ( | |||||||||
| Inventories | ( | ( | |||||||||
| Accounts payable and accrued expenses | ( | ( | |||||||||
| Other, net | |||||||||||
| Net cash (used in) provided by operating activities | ( | ||||||||||
| Cash flows from investing activities: | |||||||||||
| Acquisition of property, plant and equipment | ( | ( | |||||||||
| Proceeds from disposition of property, plant and equipment | |||||||||||
| Expenditures for major maintenance | ( | ( | |||||||||
| Changes in CHS Capital notes receivable, net | ( | ||||||||||
| Financing extended to customers | ( | ( | |||||||||
| Payments from customer financing | |||||||||||
| Other investing activities, net | ( | ( | |||||||||
| Net cash used in investing activities | ( | ( | |||||||||
| Cash flows from financing activities: | |||||||||||
| Proceeds from notes payable and long-term debt | |||||||||||
| Payments on notes payable, long-term debt and finance lease obligations | ( | ( | |||||||||
| Preferred stock dividends paid | ( | ( | |||||||||
| Redemptions of equities | ( | ( | |||||||||
| Cash patronage dividends paid | ( | ( | |||||||||
| Other financing activities, net | ( | ( | |||||||||
| Net cash (used in) provided by financing activities | ( | ||||||||||
| Effect of exchange rate changes on cash and cash equivalents | ( | ( | |||||||||
| Decrease in cash and cash equivalents and restricted cash | ( | ( | |||||||||
| Cash and cash equivalents and restricted cash at beginning of period | |||||||||||
| Cash and cash equivalents and restricted cash at end of period | $ | $ | |||||||||
The accompanying notes are an integral part of the condensed consolidated financial statements (unaudited).
5
CHS INC. AND SUBSIDIARIES
NOTES TO CONDENSED CONSOLIDATED FINANCIAL STATEMENTS
(Unaudited)
Note 1 Basis of Presentation and Significant Accounting Policies
Basis of Presentation
Significant Accounting Policies
No significant accounting policies were updated or changed since our Annual Report on Form 10-K for the year ended August 31, 2023.
Recent Accounting Pronouncements
In November 2023, the Financial Accounting Standards Board (the "FASB") issued Accounting Standards Update ("ASU") 2023-07, Segment Reporting (Topic 280): Improvements to Reportable Segment Disclosures, which enhances the disclosures required for operating segments in our annual and interim consolidated financial statements. This ASU is effective on a retrospective basis for our annual reporting beginning in fiscal 2025 and for interim period reporting beginning in fiscal 2026. We are currently evaluating the impact of adopting this ASU on our consolidated financial statements.
In December 2023, the FASB issued ASU 2023-09, Income Taxes (Topic 740): Improvements to Income Tax Disclosures, which provides additional transparency for income tax disclosures. This ASU is effective for our annual reporting for fiscal 2026 on a prospective basis. We are currently evaluating the impact of adopting this ASU on our consolidated financial statements.
Note 2 Revenues
| ASC Topic 606 | ASC Topic 815 | Other Guidance | Total Revenues | |||||||||||||||||||||||
| Three Months Ended February 29, 2024 | (Dollars in thousands) | |||||||||||||||||||||||||
| Energy | $ | $ | $ | $ | ||||||||||||||||||||||
| Ag | ||||||||||||||||||||||||||
| Corporate and Other | ||||||||||||||||||||||||||
| Total revenues | $ | $ | $ | $ | ||||||||||||||||||||||
| Three Months Ended February 28, 2023 | ||||||||||||||||||||||||||
| Energy | $ | $ | $ | $ | ||||||||||||||||||||||
| Ag | ||||||||||||||||||||||||||
| Corporate and Other | ||||||||||||||||||||||||||
| Total revenues | $ | $ | $ | $ | ||||||||||||||||||||||
6
| ASC Topic 606 | ASC Topic 815 | Other Guidance | Total Revenues | |||||||||||||||||||||||
| Six Months Ended February 29, 2024 | (Dollars in thousands) | |||||||||||||||||||||||||
| Energy | $ | $ | $ | $ | ||||||||||||||||||||||
| Ag | ||||||||||||||||||||||||||
| Corporate and Other | ||||||||||||||||||||||||||
| Total revenues | $ | $ | $ | $ | ||||||||||||||||||||||
| Six Months Ended February 28, 2023 | ||||||||||||||||||||||||||
| Energy | $ | $ | $ | $ | ||||||||||||||||||||||
| Ag | ||||||||||||||||||||||||||
| Corporate and Other | ||||||||||||||||||||||||||
| Total revenues | $ | $ | $ | $ | ||||||||||||||||||||||
Less than 1% of revenues accounted for under ASC Topic 606 included within the tables above are recorded over time and relate primarily to service contracts.
Contract Assets and Contract Liabilities
Contract assets relate to unbilled amounts arising from goods that have already been transferred to customers where the right to payment is not conditional on the passage of time. This results in recognition of an asset, as the amount of revenue recognized at a certain point in time exceeds the amount billed to customers. Contract assets are recorded in receivables within our Condensed Consolidated Balance Sheets and were $21.0 million and $16.2 million as of February 29, 2024 , and August 31, 2023, respectively.
Contract liabilities relate to advance payments received from customers for goods and services that we have yet to provide. Contract liabilities of $775.1 million and $240.0 million as of February 29, 2024 , and August 31, 2023, respectively, are recorded within other current liabilities on our Condensed Consolidated Balance Sheets. For the three months ended February 29, 2024, and February 28, 2023, we recognized revenues of $79.2 million and $70.2 million related to contract liabilities, respectively. For the six months ended February 29, 2024, and February 28, 2023, we recognized revenues of $168.8 million and $192.2 million related to contract liabilities, respectively. These amounts were included in the other current liabilities balance at the beginning of the respective period.
Note 3 Receivables
| February 29, 2024 | August 31, 2023 | ||||||||||
| (Dollars in thousands) | |||||||||||
| Trade accounts receivable | $ | $ | |||||||||
| CHS Capital short-term notes receivable | |||||||||||
| Other | |||||||||||
| Gross receivables | |||||||||||
| Less: allowances and reserves | |||||||||||
| Total receivables | $ | $ | |||||||||
Receivables are composed of trade accounts receivable, short-term notes receivable in our wholly-owned subsidiary, CHS Capital, LLC ("CHS Capital"), and other receivables, less an allowance for expected credit losses. The allowance for expected credit losses is based on our best estimate of expected credit losses in existing receivable balances and is determined using historical write-off experience, adjusted for various industry and regional data and current expectations of future credit losses.
Notes receivable from commercial borrowers are collateralized by various combinations of mortgages, personal property, accounts and notes receivable, inventories and assignments of certain regional cooperatives' capital stock. These loans are primarily originated in the states of Minnesota and North Dakota. CHS Capital also has loans receivable from producer borrowers that are collateralized by various combinations of growing crops, livestock, inventories, accounts receivable, personal property and supplemental mortgages and are primarily originated in the same states as the commercial notes, as well as in South Dakota.
7
In addition to the short-term balances included in the table above, CHS Capital had long-term notes receivable, with durations of generally not more than 10 years, totaling $118.1 million and $61.1 million as of February 29, 2024 , and August 31, 2023, respectively. The long-term notes receivable are included in other assets on our Condensed Consolidated Balance Sheets. As of February 29, 2024 , and August 31, 2023, commercial notes represented 32 % and 15 %, respectively, and producer notes represented 68 % and 85 %, respectively, of total CHS Capital notes receivable.
CHS Capital has commitments to extend credit to customers if there are no violations of contractually established conditions. As of February 29, 2024, CHS Capital customers had additional available credit of $1.3 billion. No significant troubled debt restructuring activity occurred, and no third-party customer or borrower accounted for more than 10% of the total receivables balance as of February 29, 2024 , or August 31, 2023.
Note 4 Inventories
| February 29, 2024 | August 31, 2023 | ||||||||||
| (Dollars in thousands) | |||||||||||
| Grain and oilseed | $ | $ | |||||||||
| Energy | |||||||||||
| Agronomy | |||||||||||
| Processed grain and oilseed | |||||||||||
| Other | |||||||||||
| Total inventories | $ | $ | |||||||||
Note 5 Investments
| February 29, 2024 | August 31, 2023 | ||||||||||
| (Dollars in thousands) | |||||||||||
| Equity method investments: | |||||||||||
| CF Industries Nitrogen, LLC | $ | $ | |||||||||
| Ventura Foods, LLC | |||||||||||
| Ardent Mills, LLC | |||||||||||
| Other equity method investments | |||||||||||
| Other investments | |||||||||||
| Total investments | $ | $ | |||||||||
Joint ventures and other investments in which we have significant ownership and influence, but not control, are accounted for in our condensed consolidated financial statements using the equity method of accounting. Our only significant equity method investment during the six months ended February 29, 2024, and February 28, 2023, was CF Industries Nitrogen, LLC ("CF Nitrogen"), which is summarized below. In addition to the recognition of our share of income from equity method investments, our equity method investments are evaluated for indicators of other-than-temporary impairment on an ongoing basis in accordance with accounting principles generally accepted in the United States ("U.S. GAAP"). Other investments consist primarily of investments in cooperatives without readily determinable fair values and are generally recorded at cost, unless an impairment or other observable market price change occurs that requires an adjustment. We had approximately $601.6 million in cumulative undistributed earnings from our equity method investees included in the investments balance as of February 29, 2024 .
CF Nitrogen
We have a $2.6 billion investment in CF Nitrogen, a strategic venture with CF Industries Holdings, Inc. ("CF Industries"). The investment consists of an approximate 9 % membership interest (based on product tons) in CF Nitrogen. We
8
account for this investment using the hypothetical liquidation at book value method, recognizing our share of the earnings and losses of CF Nitrogen as equity income from investments in our Nitrogen Production segment based on our contractual claims on the entity's net assets pursuant to the liquidation provisions of CF Nitrogen's Limited Liability Company Agreement, adjusted for semiannual cash distributions.
| Six Months Ended | |||||||||||
| February 29, 2024 | February 28, 2023 | ||||||||||
| (Dollars in thousands) | |||||||||||
| Net sales | $ | $ | |||||||||
| Gross profit | |||||||||||
| Net earnings | |||||||||||
| Earnings attributable to CHS Inc. | |||||||||||
Our investments in other equity method investees are not significant in relation to our condensed consolidated financial statements, either individually or in aggregate.
Note 6 Notes Payable and Long-Term Debt
Our notes payable and long-term debt are subject to various restrictive requirements for maintenance of minimum consolidated net worth and other financial ratios. We were in compliance with all debt covenants as of February 29, 2024 . Notes payable as of February 29, 2024 , and August 31, 2023, consisted of the following:
| February 29, 2024 | August 31, 2023 | ||||||||||
| (Dollars in thousands) | |||||||||||
| Notes payable | $ | $ | |||||||||
| CHS Capital notes payable | |||||||||||
| Total notes payable | $ | $ | |||||||||
Our primary line of credit is a five-year unsecured revolving credit facility with a syndicate of domestic and international banks. The credit facility provides a committed amount of $2.8 billion that expires on April 21, 2028. There were no February 29, 2024 , or August 31, 2023. We also maintain certain uncommitted bilateral facilities to support our working capital needs.
We have a receivables and loans securitization facility ("Securitization Facility") with certain unaffiliated financial institutions ("Purchasers"). Under the Securitization Facility, we and certain of our subsidiaries ("Originators") sell trade accounts and notes receivable ("Receivables") to Cofina Funding, LLC ("Cofina"), a wholly-owned, bankruptcy-remote, indirect subsidiary of CHS. Cofina in turn transfers the Receivables to the Purchasers, and this arrangement is accounted for as secured financing. We use the proceeds from the sale of Receivables under the Securitization Facility for general corporate purposes, and settlements are made on a monthly basis. The amount available under the Securitization Facility fluctuates over time based on the total amount of eligible Receivables generated during the normal course of business. The Securitization Facility consists of a committed portion with a maximum availability of $850.0 million and an uncommitted portion with a maximum availability of $250.0 million. As of February 29, 2024 , total availability under the Securitization Facility was $781.8 million, of which no amount was utilized.
We also have a repurchase facility ("Repurchase Facility"). Under the Repurchase Facility, we can obtain repurchase agreement financing up to $200.0 million for certain eligible receivables and notes receivables of the Originators. No February 29, 2024 , or August 31, 2023.
9
The following table presents summarized long-term debt (including the current portion) as of February 29, 2024 , and August 31, 2023:
| February 29, 2024 | August 31, 2023 | ||||||||||
| (Dollars in thousands) | |||||||||||
| Private placement debt | $ | $ | |||||||||
| Term loan | |||||||||||
| Deferred financing costs | ( | ( | |||||||||
| Other | |||||||||||
| Total long-term debt | |||||||||||
| Less current portion | |||||||||||
| Long-term portion | $ | $ | |||||||||
Interest expense for the three months ended February 29, 2024, and February 28, 2023, was $25.5 million and $36.0 million, respectively, net of capitalized interest of $6.5 million and $3.3 million, respectively. Interest expense for the six months ended February 29, 2024, and February 28, 2023, was $55.1 million and $69.2 million, respectively, net of capitalized interest of $11.5 million and $5.7 million, respectively.
Note 7 Income Taxes
Our uncertain tax positions are affected by the tax years that are under audit or remain subject to examination by the relevant taxing authorities. Reserves are recorded against unrecognized tax benefits when we believe certain fully supportable tax return positions are likely to be challenged, and we may not prevail. If we were to prevail on all positions taken in relation to uncertain tax positions, $130.4 million and $116.0 million of the unrecognized tax benefits would ultimately benefit our effective tax rate as of February 29, 2024 , and August 31, 2023, respectively. It is reasonably possible that the total amount of unrecognized tax benefits could change significantly in the next 12 months.
10
Note 8 Equities
Changes in Equities
Changes in equities for the three months ended February 29, 2024, and February 28, 2023, are as follows:
| Equity Certificates | Accumulated Other Comprehensive Loss | ||||||||||||||||||||||||||||||||||||||||||||||
| Capital Equity Certificates | Nonpatronage Equity Certificates | Nonqualified Equity Certificates | Preferred Stock | Capital Reserves | Noncontrolling Interests | Total Equities | |||||||||||||||||||||||||||||||||||||||||
| (Dollars in thousands) | |||||||||||||||||||||||||||||||||||||||||||||||
| Balances, November 30, 2023 | $ | $ | $ | $ | $ | ( | $ | $ | $ | ||||||||||||||||||||||||||||||||||||||
| Reversal of prior year patronage and redemption estimates | ( | ( | — | — | — | ||||||||||||||||||||||||||||||||||||||||||
| Distribution of 2023 patronage refunds | — | — | — | ( | — | ( | |||||||||||||||||||||||||||||||||||||||||
Redemptions of equities | ( | ( | ( | — | — | — | ( | ||||||||||||||||||||||||||||||||||||||||
Preferred stock dividends | — | — | — | — | — | ( | — | ( | |||||||||||||||||||||||||||||||||||||||
Other, net | ( | — | ( | — | — | ( | |||||||||||||||||||||||||||||||||||||||||
| Net income | — | — | — | — | — | ||||||||||||||||||||||||||||||||||||||||||
| Other comprehensive income, net of tax | — | — | — | — | — | — | |||||||||||||||||||||||||||||||||||||||||
| Estimated 2024 cash patronage refunds | — | — | — | — | — | ( | — | ( | |||||||||||||||||||||||||||||||||||||||
| Estimated 2024 equity redemptions | ( | — | — | — | — | — | — | ( | |||||||||||||||||||||||||||||||||||||||
| Balances, February 29, 2024 | $ | $ | $ | $ | $ | ( | $ | $ | $ | ||||||||||||||||||||||||||||||||||||||
| Equity Certificates | Accumulated Other Comprehensive Loss | ||||||||||||||||||||||||||||||||||||||||||||||
| Capital Equity Certificates | Nonpatronage Equity Certificates | Nonqualified Equity Certificates | Preferred Stock | Capital Reserves | Noncontrolling Interests | Total Equities | |||||||||||||||||||||||||||||||||||||||||
| (Dollars in thousands) | |||||||||||||||||||||||||||||||||||||||||||||||
| Balances, November 30, 2022 | $ | $ | $ | $ | $ | ( | $ | $ | $ | ||||||||||||||||||||||||||||||||||||||
| Reversal of prior year patronage and redemption estimates | ( | ( | — | — | — | ||||||||||||||||||||||||||||||||||||||||||
| Distribution of 2022 patronage refunds | — | — | — | ( | — | ( | |||||||||||||||||||||||||||||||||||||||||
Redemptions of equities | ( | ( | ( | — | — | — | ( | ||||||||||||||||||||||||||||||||||||||||
Preferred stock dividends | — | — | — | — | — | ( | — | ( | |||||||||||||||||||||||||||||||||||||||
Other, net | ( | — | ( | — | — | ( | |||||||||||||||||||||||||||||||||||||||||
| Net income (loss) | — | — | — | — | — | ( | |||||||||||||||||||||||||||||||||||||||||
| Other comprehensive income, net of tax | — | — | — | — | — | — | |||||||||||||||||||||||||||||||||||||||||
| Estimated 2023 cash patronage refunds | — | — | — | — | — | ( | — | ( | |||||||||||||||||||||||||||||||||||||||
| Estimated 2023 equity redemptions | ( | — | — | — | — | — | — | ( | |||||||||||||||||||||||||||||||||||||||
| Balances, February 28, 2023 | $ | $ | $ | $ | $ | ( | $ | $ | $ | ||||||||||||||||||||||||||||||||||||||
Change in equities for the six months ended February 29, 2024, and February 28, 2023, are as follows:
| Equity Certificates | Accumulated Other Comprehensive Loss | ||||||||||||||||||||||||||||||||||||||||||||||
| Capital Equity Certificates | Nonpatronage Equity Certificates | Nonqualified Equity Certificates | Preferred Stock | Capital Reserves | Noncontrolling Interests | Total Equities | |||||||||||||||||||||||||||||||||||||||||
| (Dollars in thousands) | |||||||||||||||||||||||||||||||||||||||||||||||
| Balances, August 31, 2023 | $ | $ | $ | $ | $ | ( | $ | $ | $ | ||||||||||||||||||||||||||||||||||||||
| Reversal of prior year patronage and redemption estimates | ( | ( | — | — | — | ||||||||||||||||||||||||||||||||||||||||||
| Distribution of 2023 patronage refunds | — | — | — | ( | — | ( | |||||||||||||||||||||||||||||||||||||||||
Redemptions of equities | ( | ( | ( | — | — | — | ( | ||||||||||||||||||||||||||||||||||||||||
Preferred stock dividends | — | — | — | — | — | ( | — | ( | |||||||||||||||||||||||||||||||||||||||
Other, net | ( | ( | — | — | ( | ( | |||||||||||||||||||||||||||||||||||||||||
| Net income | — | — | — | — | — | ||||||||||||||||||||||||||||||||||||||||||
| Other comprehensive loss, net of tax | — | — | — | — | ( | — | — | ( | |||||||||||||||||||||||||||||||||||||||
| Estimated 2024 cash patronage refunds | — | — | — | — | — | ( | — | ( | |||||||||||||||||||||||||||||||||||||||
| Estimated 2024 equity redemptions | ( | — | — | — | — | — | — | ( | |||||||||||||||||||||||||||||||||||||||
| Balances, February 29, 2024 | $ | $ | $ | $ | $ | ( | $ | $ | $ | ||||||||||||||||||||||||||||||||||||||
11
| Equity Certificates | Accumulated Other Comprehensive Loss | ||||||||||||||||||||||||||||||||||||||||||||||
| Capital Equity Certificates | Nonpatronage Equity Certificates | Nonqualified Equity Certificates | Preferred Stock | Capital Reserves | Noncontrolling Interests | Total Equities | |||||||||||||||||||||||||||||||||||||||||
| (Dollars in thousands) | |||||||||||||||||||||||||||||||||||||||||||||||
| Balances, August 31, 2022 | $ | $ | $ | $ | $ | ( | $ | $ | $ | ||||||||||||||||||||||||||||||||||||||
| Reversal of prior year patronage and redemption estimates | ( | ( | — | — | — | ||||||||||||||||||||||||||||||||||||||||||
| Distribution of 2022 patronage refunds | — | — | — | ( | — | ( | |||||||||||||||||||||||||||||||||||||||||
Redemptions of equities | ( | ( | ( | — | — | — | ( | ||||||||||||||||||||||||||||||||||||||||
Preferred stock dividends | — | — | — | — | — | ( | — | ( | |||||||||||||||||||||||||||||||||||||||
Other, net | — | — | — | ( | |||||||||||||||||||||||||||||||||||||||||||
| Net income | — | — | — | — | — | ||||||||||||||||||||||||||||||||||||||||||
| Other comprehensive loss, net of tax | — | — | — | — | ( | — | — | ( | |||||||||||||||||||||||||||||||||||||||
| Estimated 2023 cash patronage refunds | — | — | — | — | — | ( | — | ( | |||||||||||||||||||||||||||||||||||||||
| Estimated 2023 equity redemptions | ( | — | — | — | — | — | — | ( | |||||||||||||||||||||||||||||||||||||||
| Balances, February 28, 2023 | $ | $ | $ | $ | $ | ( | $ | $ | $ | ||||||||||||||||||||||||||||||||||||||
Preferred Stock Dividends
The following table presents a summary of dividends declared per share by series of preferred stock for the three and six months ended February 29, 2024, and February 28, 2023.
| Three Months Ended | Six Months Ended | ||||||||||||||||||||||||||||
| Nasdaq symbol | February 29, 2024 | February 28, 2023 | February 29, 2024 | February 28, 2023 | |||||||||||||||||||||||||
| Series of preferred stock: | (Dollars per share) | ||||||||||||||||||||||||||||
| 8% Cumulative Redeemable | CHSCP | $ | $ | $ | $ | ||||||||||||||||||||||||
| Class B Cumulative Redeemable, Series 1 | CHSCO | $ | $ | $ | $ | ||||||||||||||||||||||||
| Class B Reset Rate Cumulative Redeemable, Series 2 | CHSCN | $ | $ | $ | $ | ||||||||||||||||||||||||
| Class B Reset Rate Cumulative Redeemable, Series 3 | CHSCM | $ | $ | $ | $ | ||||||||||||||||||||||||
| Class B Cumulative Redeemable, Series 4 | CHSCL | $ | $ | $ | $ | ||||||||||||||||||||||||
Accumulated Other Comprehensive Income (Loss)
Changes in accumulated other comprehensive income (loss) by component for the three months ended February 29, 2024, and February 28, 2023, are as follows:
| Pension and Other Postretirement Benefits | Cash Flow Hedges | Foreign Currency Translation Adjustment | Total | ||||||||||||||||||||
| (Dollars in thousands) | |||||||||||||||||||||||
| Balance as of November 30, 2023, net of tax | $ | ( | $ | ( | $ | ( | $ | ( | |||||||||||||||
| Other comprehensive income (loss), before tax: | |||||||||||||||||||||||
| Amounts before reclassifications | ( | ||||||||||||||||||||||
| Amounts reclassified | ( | ( | |||||||||||||||||||||
| Total other comprehensive income (loss), before tax | ( | ||||||||||||||||||||||
| Tax effect | ( | ( | ( | ( | |||||||||||||||||||
| Other comprehensive income (loss), net of tax | ( | ||||||||||||||||||||||
| Balance as of February 29, 2024, net of tax | $ | ( | $ | $ | ( | $ | ( | ||||||||||||||||
12
| Pension and Other Postretirement Benefits | Cash Flow Hedges | Foreign Currency Translation Adjustment | Total | ||||||||||||||||||||
| (Dollars in thousands) | |||||||||||||||||||||||
| Balance as of November 30, 2022, net of tax | $ | ( | $ | ( | $ | ( | $ | ( | |||||||||||||||
| Other comprehensive income (loss), before tax: | |||||||||||||||||||||||
| Amounts before reclassifications | |||||||||||||||||||||||
| Amounts reclassified | ( | ||||||||||||||||||||||
| Total other comprehensive income (loss), before tax | ( | ||||||||||||||||||||||
| Tax effect | ( | ( | ( | ||||||||||||||||||||
| Other comprehensive income (loss), net of tax | ( | ||||||||||||||||||||||
| Balance as of February 28, 2023, net of tax | $ | ( | $ | $ | ( | $ | ( | ||||||||||||||||
Changes in accumulated other comprehensive income (loss) by component for the six months ended February 29, 2024, and February 28, 2023, are as follows:
| Pension and Other Postretirement Benefits | Cash Flow Hedges | Foreign Currency Translation Adjustment | Total | ||||||||||||||||||||
| (Dollars in thousands) | |||||||||||||||||||||||
| Balance as of August 31, 2023, net of tax | $ | ( | $ | $ | ( | $ | ( | ||||||||||||||||
| Other comprehensive income (loss), before tax: | |||||||||||||||||||||||
| Amounts before reclassifications | ( | ||||||||||||||||||||||
| Amounts reclassified | ( | ( | |||||||||||||||||||||
| Total other comprehensive income (loss), before tax | ( | ( | |||||||||||||||||||||
| Tax effect | ( | ( | ( | ||||||||||||||||||||
| Other comprehensive income (loss), net of tax | ( | ( | |||||||||||||||||||||
| Balance as of February 29, 2024, net of tax | $ | ( | $ | $ | ( | $ | ( | ||||||||||||||||
| Pension and Other Postretirement Benefits | Cash Flow Hedges | Foreign Currency Translation Adjustment | Total | ||||||||||||||||||||
| (Dollars in thousands) | |||||||||||||||||||||||
| Balance as of August 31, 2022, net of tax | $ | ( | $ | $ | ( | $ | ( | ||||||||||||||||
| Other comprehensive income (loss), before tax: | |||||||||||||||||||||||
| Amounts before reclassifications | ( | ( | ( | ||||||||||||||||||||
| Amounts reclassified | |||||||||||||||||||||||
| Total other comprehensive income (loss), before tax | ( | ( | ( | ||||||||||||||||||||
| Tax effect | |||||||||||||||||||||||
| Other comprehensive income (loss), net of tax | ( | ( | ( | ||||||||||||||||||||
| Balance as of February 28, 2023, net of tax | $ | ( | $ | $ | ( | $ | ( | ||||||||||||||||
Amounts reclassified from accumulated other comprehensive income (loss) were related to pension and other postretirement benefits, cash flow hedges and foreign currency translation adjustments. Pension and other postretirement reclassifications include amortization of net actuarial loss, prior service credit and transition amounts and are recorded as cost of goods sold and marketing, general and administrative expenses (see Note 9, Benefit Plans, for further information). As described in Note 11, Derivative Financial Instruments and Hedging Activities, amounts reclassified from accumulated other comprehensive loss for cash flow hedges are recorded in cost of goods sold. Gains or losses on foreign currency translation reclassifications are recorded in other income.
Note 9 Benefit Plans
We have various pension and other defined benefit and defined contribution plans, in which substantially all employees may participate. We also have nonqualified supplemental executive and Board of Directors retirement plans.
13
| Three Months Ended | |||||||||||||||||||||||||||||||||||
| Qualified Pension Benefits | Nonqualified Pension Benefits | Other Benefits | |||||||||||||||||||||||||||||||||
| February 29, 2024 | February 28, 2023 | February 29, 2024 | February 28, 2023 | February 29, 2024 | February 28, 2023 | ||||||||||||||||||||||||||||||
| Components of net periodic benefit costs: | (Dollars in thousands) | ||||||||||||||||||||||||||||||||||
| Service cost | $ | $ | $ | $ | $ | $ | |||||||||||||||||||||||||||||
| Interest cost | |||||||||||||||||||||||||||||||||||
| Expected return on assets | ( | ( | |||||||||||||||||||||||||||||||||
| Prior service cost (credit) amortization | ( | ( | ( | ( | |||||||||||||||||||||||||||||||
| Actuarial loss (gain) amortization | ( | ( | |||||||||||||||||||||||||||||||||
| Net periodic benefit cost (benefit) | $ | $ | $ | $ | $ | ( | $ | ( | |||||||||||||||||||||||||||
| Six Months Ended | |||||||||||||||||||||||||||||||||||
| Qualified Pension Benefits | Nonqualified Pension Benefits | Other Benefits | |||||||||||||||||||||||||||||||||
| February 29, 2024 | February 28, 2023 | February 29, 2024 | February 28, 2023 | February 29, 2024 | February 28, 2023 | ||||||||||||||||||||||||||||||
| Components of net periodic benefit costs: | (Dollars in thousands) | ||||||||||||||||||||||||||||||||||
| Service cost | $ | $ | $ | $ | $ | $ | |||||||||||||||||||||||||||||
| Interest cost | |||||||||||||||||||||||||||||||||||
| Expected return on assets | ( | ( | |||||||||||||||||||||||||||||||||
| Prior service cost (credit) amortization | ( | ( | ( | ( | |||||||||||||||||||||||||||||||
| Actuarial loss (gain) amortization | ( | ( | |||||||||||||||||||||||||||||||||
| Net periodic benefit cost (benefit) | $ | $ | $ | $ | $ | ( | $ | ( | |||||||||||||||||||||||||||
Employer Contributions
Contributions depend primarily on market returns on the pension plan assets and minimum funding level requirements. No contributions were made to the pension plans during the six months ended February 29, 2024, and we do not anticipate being required to make contributions to our pension plans in fiscal 2024, although we may voluntarily elect to do so.
Note 10 Segment Reporting
We are an integrated agricultural cooperative, providing grain, food, agronomy and energy resources to businesses and consumers on a global basis. We provide a wide variety of products and services, from initial agricultural inputs such as fuels, farm supplies, crop nutrients and crop protection products, to agricultural outputs that include grain and oilseed, processed grain and oilseed, renewable fuels and food products. We define our operating segments in accordance with ASC Topic 280, Segment Reporting, to reflect the manner in which our chief operating decision maker, our Chief Executive Officer, evaluates performance and allocates resources in managing the business. We have aggregated those operating segments into three reportable segments: Energy, Ag and Nitrogen Production.
Our Energy segment produces and provides primarily for wholesale distribution of petroleum products and transportation of those products. Our Ag segment purchases and further processes or resells grain and oilseed originated by our country operations business, by our member cooperatives and by third parties; serves as a wholesaler and retailer of crop inputs; and produces and markets ethanol. Our Nitrogen Production segment consists of our equity method investment in CF Nitrogen that records earnings and allocated expenses but not revenues. Our supply agreement with CF Nitrogen entitles us to purchase up to a specified quantity of granular urea and urea ammonium nitrate ("UAN") annually from CF Nitrogen. Corporate and Other represents our financing and hedging businesses, which primarily consists of a U.S. Commodity Futures Trading Commission-regulated futures commission merchant ("FCM") for commodities hedging and financial services related to crop production. Our nonconsolidated investments in Ventura Foods, LLC ("Ventura Foods"), and Ardent Mills, LLC ("Ardent Mills"), are also included in our Corporate and Other category.
Corporate administrative expenses and interest are allocated to each reportable segment and Corporate and Other, based on direct use of services, such as information technology and legal, and other factors or considerations relevant to the costs incurred.
14
Many of our business activities are highly seasonal and our operating results vary throughout the year. Our revenues and income before income taxes ("IBIT") generally trend lower during the second fiscal quarter and increase in the third fiscal quarter. For example, in our Ag segment, our country operations business generally experiences higher volumes and revenues during the fall harvest and spring planting seasons, which generally correspond to our first and third fiscal quarters, respectively. Additionally, our agronomy business generally experiences higher volumes and revenues during the spring planting season. Our global grain and processing operations are subject to fluctuations in volume and revenues based on producer harvests, world grain prices, demand and international trade relationships. Our Energy segment generally experiences higher volumes and revenues in certain operating areas, such as refined products, in the spring, summer and early fall when gasoline and diesel fuel use by agricultural producers is highest and is subject to global supply and demand forces. Other energy products, such as propane, generally experience higher volumes and revenues during the winter heating and fall crop-drying seasons.
Our revenues, assets and cash flows can be significantly affected by global market prices for commodities such as petroleum products, natural gas, grain, oilseed, crop nutrients and flour. Changes in market prices for commodities that we purchase without a corresponding change in the selling prices of those products can affect revenues and operating earnings. Commodity prices are affected by a wide range of factors beyond our control, including weather, crop damage due to plant disease or insects, drought, availability and adequacy of supply, availability of reliable rail and river transportation networks, outbreaks of disease, government regulations and policies, global trade disputes, wars and civil unrest, and general political and economic conditions.
While our revenues and operating results are derived primarily from businesses and operations that are wholly-owned or subsidiaries and limited liability companies in which we have a controlling interest, a portion of our business operations are conducted through companies in which we hold ownership interests of 50% or less or do not control the operations. We account for these investments primarily using the equity method of accounting, wherein we record our proportionate share of income or loss reported by the entity as equity income from investments, without consolidating the revenues and expenses of the entity in our Condensed Consolidated Statements of Operations. In our Nitrogen Production segment, this consists of our approximate 9 % membership interest (based on product tons) in CF Nitrogen. In Corporate and Other, this principally includes our 50 % ownership in Ventura Foods and our 12 % ownership in Ardent Mills. See Note 5, Investments, for more information related to our equity method investments.
Reconciling amounts represent the elimination of revenues between segments. Such transactions are executed at market prices to more accurately evaluate the profitability of the individual business segments.
Segment information for the three and six months ended February 29, 2024, and February 28, 2023, is presented in the tables below:
| Energy | Ag | Nitrogen Production | Corporate and Other | Reconciling Amounts | Total | ||||||||||||||||||||||||||||||
| Three Months Ended February 29, 2024 | (Dollars in thousands) | ||||||||||||||||||||||||||||||||||
| Revenues, including intersegment revenues | $ | $ | $ | $ | $ | ( | $ | ||||||||||||||||||||||||||||
| Intersegment revenues | ( | ( | ( | — | |||||||||||||||||||||||||||||||
Revenues, net of intersegment revenues | $ | $ | $ | $ | $ | $ | |||||||||||||||||||||||||||||
| Operating earnings (loss) | ( | ||||||||||||||||||||||||||||||||||
| Interest expense | ( | ( | |||||||||||||||||||||||||||||||||
| Other income | ( | ( | ( | ( | ( | ||||||||||||||||||||||||||||||
| Equity income from investments | ( | ( | ( | ( | ( | ||||||||||||||||||||||||||||||
| Income before income taxes | $ | $ | $ | $ | $ | $ | |||||||||||||||||||||||||||||
| Energy | Ag | Nitrogen Production | Corporate and Other | Reconciling Amounts | Total | ||||||||||||||||||||||||||||||
| Three Months Ended February 28, 2023 | (Dollars in thousands) | ||||||||||||||||||||||||||||||||||
| Revenues, including intersegment revenues | $ | $ | $ | $ | $ | ( | $ | ||||||||||||||||||||||||||||
| Intersegment revenues | ( | ( | ( | — | |||||||||||||||||||||||||||||||
Revenues, net of intersegment revenues | $ | $ | $ | $ | $ | $ | |||||||||||||||||||||||||||||
| Operating earnings (loss) | ( | ( | ( | ||||||||||||||||||||||||||||||||
| Interest expense | ( | ||||||||||||||||||||||||||||||||||
| Other income | ( | ( | ( | ( | |||||||||||||||||||||||||||||||
| Equity income from investments | ( | ( | ( | ( | ( | ||||||||||||||||||||||||||||||
| Income (loss) before income taxes | $ | $ | ( | $ | $ | $ | $ | ||||||||||||||||||||||||||||
15
| Energy | Ag | Nitrogen Production | Corporate and Other | Reconciling Amounts | Total | ||||||||||||||||||||||||||||||
| Six Months Ended February 29, 2024 | (Dollars in thousands) | ||||||||||||||||||||||||||||||||||
| Revenues, including intersegment revenues | $ | $ | $ | $ | $ | ( | $ | ||||||||||||||||||||||||||||
| Intersegment revenues | ( | ( | ( | — | |||||||||||||||||||||||||||||||
Revenues, net of intersegment revenues | $ | $ | $ | $ | $ | $ | |||||||||||||||||||||||||||||
| Operating earnings (loss) | ( | ||||||||||||||||||||||||||||||||||
| Interest expense | ( | ( | |||||||||||||||||||||||||||||||||
| Other income | ( | ( | ( | ( | ( | ||||||||||||||||||||||||||||||
| Equity (income) loss from investments | ( | ( | ( | ( | |||||||||||||||||||||||||||||||
| Income before income taxes | $ | $ | $ | $ | $ | $ | |||||||||||||||||||||||||||||
| Total assets as of February 29, 2024 | $ | $ | $ | $ | $ | $ | |||||||||||||||||||||||||||||
| Energy | Ag | Nitrogen Production | Corporate and Other | Reconciling Amounts | Total | ||||||||||||||||||||||||||||||
| Six Months Ended February 28, 2023 | (Dollars in thousands) | ||||||||||||||||||||||||||||||||||
| Revenues, including intersegment revenues | $ | $ | $ | $ | $ | ( | $ | ||||||||||||||||||||||||||||
| Intersegment revenues | ( | ( | ( | — | |||||||||||||||||||||||||||||||
Revenues, net of intersegment revenues | $ | $ | $ | $ | $ | $ | |||||||||||||||||||||||||||||
| Operating earnings (loss) | ( | ( | |||||||||||||||||||||||||||||||||
| Interest expense | ( | ||||||||||||||||||||||||||||||||||
| Other income | ( | ( | ( | ( | |||||||||||||||||||||||||||||||
| Equity (income) loss from investments | ( | ( | ( | ( | |||||||||||||||||||||||||||||||
| Income before income taxes | $ | $ | $ | $ | $ | $ | |||||||||||||||||||||||||||||
Note 11 Derivative Financial Instruments and Hedging Activities
We enter into various derivative instruments to manage our exposure to movements primarily associated with agricultural and energy commodity prices and, to a lesser degree, foreign currency exchange rates and interest rates. Except for certain cash-settled swaps related to future crude oil purchases and refined product sales, which are accounted for as cash flow hedges, our derivative instruments represent economic hedges of price risk for which hedge accounting under ASC Topic 815 is not applied. Rather, the derivative instruments are recorded on our Condensed Consolidated Balance Sheets at fair value with changes in fair value being recorded directly to earnings, primarily within cost of goods sold in our Condensed Consolidated Statements of Operations. See Note 12, Fair Value Measurements, for additional information. The majority of our exchange-traded agricultural commodity futures are settled daily through CHS Hedging, LLC, our wholly-owned FCM.
Derivatives Not Designated as Hedging Instruments
The following tables present the gross fair values of derivative assets, derivative liabilities and related margin deposits (cash collateral) recorded on our Condensed Consolidated Balance Sheets, along with related amounts permitted to be offset in accordance with U.S. GAAP. Although we have certain netting arrangements for our exchange-traded futures and options contracts and certain over-the-counter ("OTC") contracts, we have elected to report our derivative instruments on a gross basis on our Condensed Consolidated Balance Sheets under ASC Topic 210-20, Balance Sheet-Offsetting.
| February 29, 2024 | |||||||||||||||||||||||
| Amounts Not Offset on Condensed Consolidated Balance Sheet but Eligible for Offsetting | |||||||||||||||||||||||
| Gross Amount Recognized | Cash Collateral | Derivative Instruments | Net Amount | ||||||||||||||||||||
| Derivative assets | (Dollars in thousands) | ||||||||||||||||||||||
| Commodity derivatives | $ | $ | — | $ | $ | ||||||||||||||||||
| Foreign exchange derivatives | — | ||||||||||||||||||||||
| Total | $ | $ | — | $ | $ | ||||||||||||||||||
| Derivative liabilities | |||||||||||||||||||||||
| Commodity derivatives | $ | $ | $ | $ | |||||||||||||||||||
| Foreign exchange derivatives | |||||||||||||||||||||||
| Total | $ | $ | $ | $ | |||||||||||||||||||
16
| August 31, 2023 | |||||||||||||||||||||||
| Amounts Not Offset on Condensed Consolidated Balance Sheet but Eligible for Offsetting | |||||||||||||||||||||||
| Gross Amount Recognized | Cash Collateral | Derivative Instruments | Net Amount | ||||||||||||||||||||
| Derivative assets | (Dollars in thousands) | ||||||||||||||||||||||
| Commodity derivatives | $ | $ | — | $ | $ | ||||||||||||||||||
| Foreign exchange derivatives | — | ||||||||||||||||||||||
| Total | $ | $ | — | $ | $ | ||||||||||||||||||
| Derivative liabilities | |||||||||||||||||||||||
| Commodity derivatives | $ | $ | $ | $ | |||||||||||||||||||
| Foreign exchange derivatives | |||||||||||||||||||||||
| Total | $ | $ | $ | $ | |||||||||||||||||||
Derivative assets and liabilities with maturities of less than 12 months are recorded in other current assets and other current liabilities, respectively, on our Condensed Consolidated Balance Sheets. Derivative assets and liabilities with maturities greater than 12 months are recorded in other assets and other liabilities, respectively, on our Condensed Consolidated Balance Sheets. The amount of long-term derivative assets recorded on our Condensed Consolidated Balance Sheets as of February 29, 2024 , and August 31, 2023, was $1.5 million and $1.1 million, respectively. The amount of long-term derivative liabilities recorded on our Condensed Consolidated Balance Sheets as of February 29, 2024 , and August 31, 2023, was $1.6 million and $12.6 million, respectively.
| Three Months Ended | Six Months Ended | ||||||||||||||||||||||||||||
| Location of Gain (Loss) | February 29, 2024 | February 28, 2023 | February 29, 2024 | February 28, 2023 | |||||||||||||||||||||||||
| (Dollars in thousands) | |||||||||||||||||||||||||||||
| Commodity derivatives | Cost of goods sold | $ | $ | $ | $ | ( | |||||||||||||||||||||||
| Foreign exchange derivatives | Cost of goods sold | ( | ( | ( | |||||||||||||||||||||||||
| Foreign exchange derivatives | Marketing, general and administrative expenses | ( | ( | ||||||||||||||||||||||||||
| Total | $ | $ | $ | $ | ( | ||||||||||||||||||||||||
Commodity Contracts
As of February 29, 2024, and August 31, 2023, we had outstanding commodity futures and options contracts that were used as economic hedges, as well as fixed-price forward contracts related to physical purchases and sales of commodities. The table below presents the notional volumes for all outstanding commodity contracts:
| February 29, 2024 | August 31, 2023 | ||||||||||||||||||||||
| Long | Short | Long | Short | ||||||||||||||||||||
| (Units in thousands) | |||||||||||||||||||||||
| Grain and oilseed (bushels) | |||||||||||||||||||||||
| Energy products (barrels) | |||||||||||||||||||||||
| Processed grain and oilseed (tons) | |||||||||||||||||||||||
| Crop nutrients (tons) | |||||||||||||||||||||||
| Ocean freight (metric tons) | |||||||||||||||||||||||
| Natural gas (metric million Btu) | |||||||||||||||||||||||
Foreign Exchange Contracts
We conduct a substantial portion of our business in U.S. dollars, but we are exposed to risks relating to foreign currency fluctuations, primarily due to global grain marketing transactions in South America, the Asia Pacific region and Europe and purchases of products from Canada. We use foreign currency derivative instruments to mitigate the impact of exchange rate fluctuations. Although CHS has some risk exposure relating to foreign currency transactions, a larger impact with exchange rate fluctuations is the ability of foreign buyers to purchase U.S. agricultural products and the competitiveness of U.S.
17
agricultural products compared to the same products offered by alternative sources of world supply. The notional amount of our foreign exchange derivative contracts was $1.2 billion and $1.9 billion as of February 29, 2024 , and August 31, 2023, respectively.
Interest Rate Contracts
In the second quarter of fiscal 2024, we entered into forward-starting interest rate swaps with an aggregate notional amount of $150.0 million as an economic hedge for the expected variability of future interest payments on our anticipated issuance of fixed-rate debt.
Derivatives Designated as Cash Flow Hedging Strategies
Certain pay-fixed, receive-variable, cash-settled swaps are designated as cash flow hedges of future crude oil purchases in our Energy segment. We also designate certain pay-variable, receive-fixed, cash-settled swaps as cash flow hedges of future refined energy product sales. These hedging instruments and the related hedged items are exposed to significant market price risk and potential volatility. As part of our risk management strategy, we look to hedge a portion of our expected future crude oil needs and the resulting refined product output based on prevailing futures prices, management's expectations about future commodity price changes and our risk appetite. We may also elect to dedesignate certain derivative instruments previously designated as cash flow hedges as part of our risk management strategy. Amounts recorded in other comprehensive income for these dedesignated derivative instruments remain in other comprehensive income and are recognized in earnings in the period in which the underlying transactions affect earnings. As of February 29, 2024 , and August 31, 2023, the aggregate notional amounts of cash flow hedges were 3.6 million and 4.1 million barrels, respectively.
| Derivative Assets | Derivative Liabilities | |||||||||||||||||||||||||||||||
| Balance Sheet Location | February 29, 2024 | August 31, 2023 | Balance Sheet Location | February 29, 2024 | August 31, 2023 | |||||||||||||||||||||||||||
| (Dollars in thousands) | (Dollars in thousands) | |||||||||||||||||||||||||||||||
| Other current assets | $ | $ | Other current liabilities | $ | $ | |||||||||||||||||||||||||||
| Three Months Ended | Six Months Ended | |||||||||||||||||||||||||
| February 29, 2024 | February 28, 2023 | February 29, 2024 | February 28, 2023 | |||||||||||||||||||||||
| (Dollars in thousands) | ||||||||||||||||||||||||||
| Commodity derivatives | $ | $ | $ | $ | ( | |||||||||||||||||||||
| Three Months Ended | Six Months Ended | ||||||||||||||||||||||||||||
| Location of Gain (Loss) | February 29, 2024 | February 28, 2023 | February 29, 2024 | February 28, 2023 | |||||||||||||||||||||||||
| (Dollars in thousands) | |||||||||||||||||||||||||||||
| Commodity derivatives | Cost of goods sold | $ | $ | ( | $ | $ | ( | ||||||||||||||||||||||
18
Note 12 Fair Value Measurements
ASC Topic 820, Fair Value Measurement, defines fair value as the price that would be received for an asset or paid to transfer a liability (an exit price) in the principal or most advantageous market for the asset or liability in an orderly transaction among the market participants on the measurement date.
We determine fair values of derivative instruments and certain other assets based on the fair value hierarchy established in ASC Topic 820, which requires an entity to maximize use of observable inputs and minimize use of unobservable inputs when measuring fair value. Observable inputs are inputs that reflect the assumptions market participants would use in pricing the asset or liability based on the best information available in the circumstances. ASC Topic 820 describes three levels within its hierarchy that may be used to measure fair value. Level 1 inputs are unadjusted quoted prices in active markets for identical assets or liabilities. Level 2 inputs include quoted prices for similar assets or liabilities in active markets, quoted prices for identical or similar assets or liabilities in markets that are not active and other inputs that are observable or can be corroborated by observable market data for substantially the full term of the assets or liabilities. Level 3 inputs are unobservable inputs that are supported by little or no market activity for the assets or liabilities. Categorization within the valuation hierarchy is based on the lowest level of input significant to the fair value measurement.
Recurring fair value measurements as of February 29, 2024 , and August 31, 2023, are as follows:
| February 29, 2024 | |||||||||||||||||||||||
| Quoted Prices in Active Markets for Identical Assets (Level 1) | Significant Other Observable Inputs (Level 2) | Significant Unobservable Inputs (Level 3) | Total | ||||||||||||||||||||
| Assets | (Dollars in thousands) | ||||||||||||||||||||||
| Commodity derivatives | $ | $ | $ | $ | |||||||||||||||||||
| Foreign exchange derivatives | |||||||||||||||||||||||
| Segregated investments and marketable securities | |||||||||||||||||||||||
| Other assets | |||||||||||||||||||||||
| Total | $ | $ | $ | $ | |||||||||||||||||||
| Liabilities | |||||||||||||||||||||||
| Commodity derivatives | $ | $ | $ | $ | |||||||||||||||||||
| Foreign exchange derivatives | |||||||||||||||||||||||
| Total | $ | $ | $ | $ | |||||||||||||||||||
| August 31, 2023 | |||||||||||||||||||||||
| Quoted Prices in Active Markets for Identical Assets (Level 1) | Significant Other Observable Inputs (Level 2) | Significant Unobservable Inputs (Level 3) | Total | ||||||||||||||||||||
| Assets | (Dollars in thousands) | ||||||||||||||||||||||
| Commodity derivatives | $ | $ | $ | $ | |||||||||||||||||||
| Foreign exchange derivatives | |||||||||||||||||||||||
| Segregated investments and marketable securities | |||||||||||||||||||||||
| Other assets | |||||||||||||||||||||||
| Total | $ | $ | $ | $ | |||||||||||||||||||
| Liabilities | |||||||||||||||||||||||
| Commodity derivatives | $ | $ | $ | $ | |||||||||||||||||||
| Foreign exchange derivatives | |||||||||||||||||||||||
| Total | $ | $ | $ | $ | |||||||||||||||||||
Commodity and foreign exchange derivatives. Exchange-traded futures and options contracts are valued based on unadjusted quoted prices in active markets and are classified within Level 1. Our forward commodity purchase and sales contracts with fixed-price components, select ocean freight contracts and other OTC derivatives are determined using inputs that are generally based on exchange-traded prices and/or recent market bids and offers, including location-specific adjustments, and are classified within Level 2. Location-specific inputs are driven by local market supply and demand and are generally based on broker or dealer quotations or market transactions in either listed or OTC markets. Changes in the fair values
19
of these contracts are recognized in our Condensed Consolidated Statements of Operations as a component of cost of goods sold.
Segregated investments and marketable securities and other assets. Our segregated investments and marketable securities and other assets are comprised primarily of investments in various government agencies, U.S. Treasury securities, money market funds and rabbi trust assets, which are valued using quoted market prices and classified within Level 1.
Note 13 Commitments and Contingencies
Environmental
We are required to comply with various environmental laws and regulations incidental to our normal business operations. To meet our compliance requirements, we establish reserves for future costs of remediation associated with identified issues that are probable and can be reasonably estimated. Estimates of environmental costs are based on current available facts, existing technology, undiscounted site-specific costs and currently enacted laws and regulations and are included in cost of goods sold and marketing, general and administrative expenses in our Condensed Consolidated Statements of Operations. Recoveries, if any, are recorded in the period in which recovery is received. Liabilities are monitored and adjusted as new facts or changes in laws or technology occur. The resolution of any such matters may affect consolidated net income for any fiscal period; however, we currently believe any resulting liabilities, individually or in aggregate, will not have a material effect on our consolidated financial position, results of operations or cash flows during any fiscal year.
Other Litigation and Claims
We are involved as a defendant in various lawsuits, claims and disputes, which are in the normal course of our business. The resolution of any such matters may affect consolidated net income for any fiscal period; however, we currently believe any resulting liabilities, individually or in aggregate, will not have a material effect on our consolidated financial position, results of operations or cash flows during any fiscal year.
Guarantees
We are a guarantor for lines of credit and performance obligations of related, nonconsolidated companies. Our bank covenants allow maximum guarantees of $1.1 billion, of which $161.5 million were outstanding on February 29, 2024 . We have collateral for a portion of these contingent obligations. We have not recorded a liability related to the contingent obligations as we do not expect to pay out any cash related to them, and the fair values are considered immaterial. The underlying loans to the counterparties for which we provide these guarantees were current as of February 29, 2024 .
Note 14 Other Current Assets and Liabilities
| February 29, 2024 | August 31, 2023 | ||||||||||
| Other current assets | (Dollars in thousands) | ||||||||||
| Derivative assets (Note 11) | $ | $ | |||||||||
| Margin and related deposits | |||||||||||
| Prepaid expenses | |||||||||||
| Supplier advance payments | |||||||||||
| Restricted cash | |||||||||||
| Other | |||||||||||
| Total other current assets | $ | $ | |||||||||
| Other current liabilities | |||||||||||
| Customer margin deposits and credit balances | $ | $ | |||||||||
| Customer advance payments | |||||||||||
| Derivative liabilities (Note 11) | |||||||||||
| Dividends and equity payable | |||||||||||
| Total other current liabilities | $ | $ | |||||||||
20
ITEM 2. MANAGEMENT'S DISCUSSION AND ANALYSIS OF FINANCIAL CONDITION AND RESULTS OF OPERATIONS
This Management's Discussion and Analysis of Financial Condition and Results of Operations ("MD&A") is intended to provide a reader of our financial statements with a narrative from the perspective of our management regarding our financial condition and results of operations, liquidity and certain other factors that may affect our future results. Our MD&A is presented in the following sections:
•Overview
•Business Strategy
•Fiscal 2024 Second Quarter Highlights
•Fiscal 2024 Trends Update
•Operating Metrics
•Results of Operations
•Liquidity and Capital Resources
•Critical Accounting Policies
•Recent Accounting Pronouncements
Our MD&A should be read in conjunction with our Annual Report on Form 10-K for the year ended August 31, 2023 (including the information presented therein under Risk Factors), as well as the condensed consolidated financial statements and the related notes included in Item 1 of Part I of this Quarterly Report on Form 10-Q.
Overview
CHS Inc. is a diversified company that provides grain, food, agronomy and energy resources to businesses and consumers on a global scale. As a cooperative, we are owned by farmers, ranchers and member cooperatives across the United States. We also have preferred shareholders who own our five series of preferred stock, all of which are listed and traded on the Global Select Market of The Nasdaq Stock Market LLC. We operate in the following three reportable segments:
•Energy. Produces and provides primarily for wholesale distribution and transportation of petroleum products.
•Ag. Purchases and further processes or resells grain and oilseed originated by our country operations and global grain and processing businesses, by our member cooperatives and by third parties. It also includes our renewable fuels business and serves as a wholesaler and retailer of agronomy products.
•Nitrogen Production. Produces and distributes nitrogen fertilizer. It consists of our equity method investment in CF Nitrogen, LLC ("CF Nitrogen"), and allocated expenses.
In addition, our financing and hedging businesses, along with our nonconsolidated food production and distribution and wheat milling joint ventures, have been aggregated within our Corporate and Other category.
The consolidated financial statements include the accounts of CHS and all subsidiaries and limited liability companies in which we have control. The effects of all significant intercompany transactions have been eliminated.
Corporate administrative expenses and interest are allocated to each reportable segment and Corporate and Other, based on direct use of services, such as information technology and legal, and other factors or considerations relevant to the costs incurred.
Management's Focus. When evaluating our operating performance, management focuses on gross profit and income before income taxes ("IBIT"). As a company that operates heavily in global commodities, there is significant unpredictability and volatility in pricing, costs and global trade volumes. Consequently, we focus on managing the margin we can earn and the resulting IBIT. We also focus on ensuring balance sheet strength through appropriate management of financial liquidity, leverage, capital allocation and cash flow optimization.
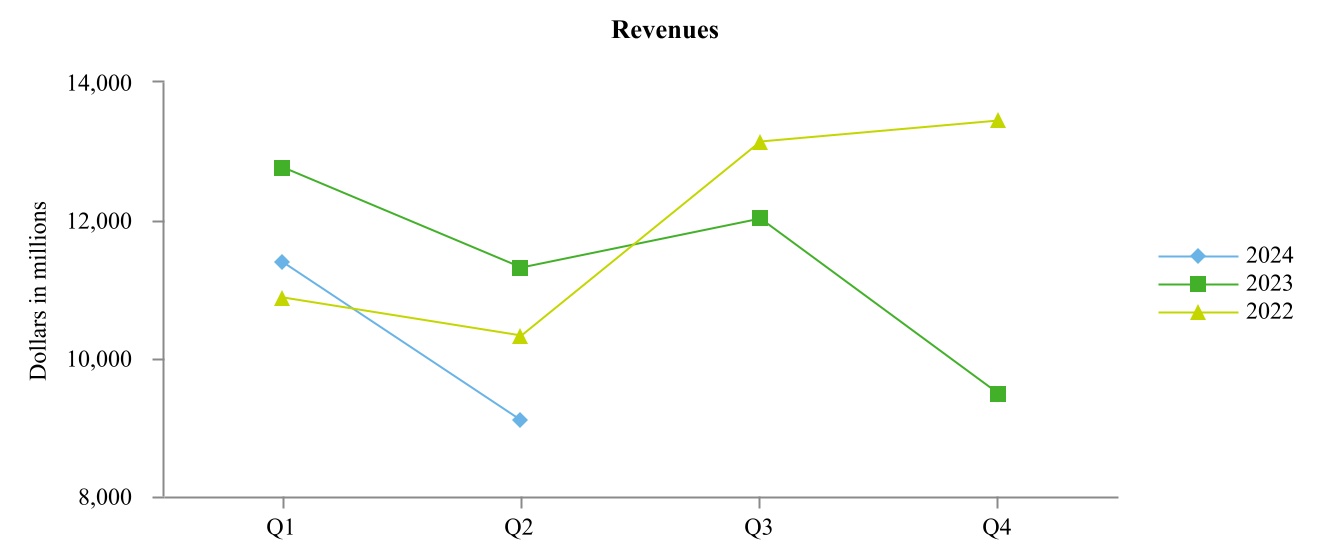
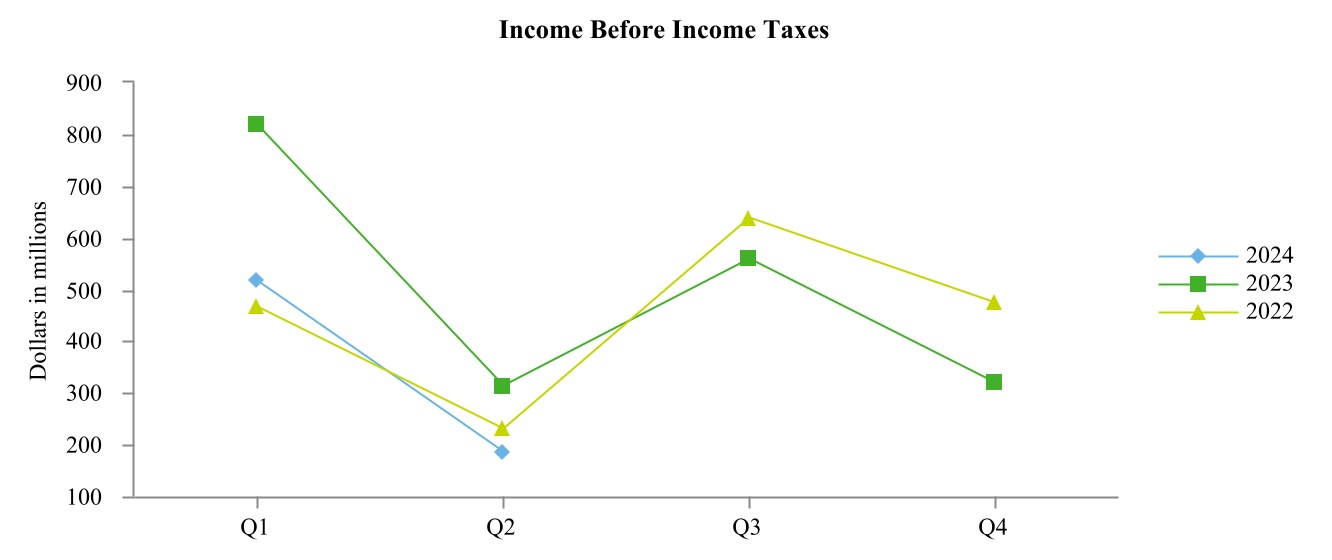
Seasonality. Many of our business activities are highly seasonal and our operating results vary throughout the year. Our revenues and IBIT generally trend lower during the second fiscal quarter and increase in the third fiscal quarter. For example, in our Ag segment, our country operations business generally experiences higher volumes and revenues during the fall harvest and spring planting seasons, which generally correspond to our first and third fiscal quarters, respectively. Additionally, our agronomy business generally experiences higher volumes and revenues during the spring planting season. Our global grain and processing operations are subject to fluctuations in volumes and revenues based on producer harvests, world grain prices, global demand and international trade relationships. Our Energy segment generally experiences higher volumes and revenues in
21
certain operating areas, such as refined products, in the spring, summer and early fall when gasoline and diesel fuel use by agricultural producers is highest and is subject to global supply and demand forces. Other energy products, such as propane, generally experience higher volumes and revenues during the winter heating and fall crop-drying seasons. The graphs below depict the seasonality inherent in our businesses.
Pricing and Volumes. Our revenues, assets and cash flows can be significantly affected by global market prices and sales volumes of commodities such as petroleum products, natural gas, grain, oilseed products and agronomy products. Changes in market prices for commodities we purchase without a corresponding change in the selling prices of those products can affect revenues and operating earnings. Similarly, increased or decreased sales volumes without a corresponding change in the purchase and selling prices of those products can affect revenues and operating earnings. Commodity prices and sales volumes are affected by a wide range of factors beyond our control, including weather, crop damage due to plant disease or insects, drought, availability/adequacy of supply of a commodity, availability of reliable rail and river transportation networks, disease outbreaks, government regulations and policies, global trade disputes, wars and civil unrest, and general political and/or economic conditions.
Business Strategy
Our business strategies focus on an enterprisewide effort to create an experience that empowers customers to make CHS their first choice, expand market access to add value for our owners and transform and evolve our core businesses by capitalizing on changing market dynamics. To execute these strategies, we are focused on implementing agile, efficient and sustainable technology platforms; building robust and efficient supply chains; hiring, developing and retaining high-performing, diverse and passionate teams; achieving operational excellence and continuous improvement; and maintaining a strong balance sheet.
22
Fiscal 2024 Second Quarter Highlights
•Financial performance was solid across our segments, although down from the record second quarter of fiscal 2023.
•In our Ag segment, earnings were higher as agronomy markets were stronger compared to the prior year and grain and oilseed margins were stable.
•Our Energy segment margins declined from the highs in the prior year due to changing market conditions including the impact of a historically warm winter.
•Equity method investments continued to perform well, with our CF Nitrogen investment being the largest contributor.
Fiscal 2024 Trends Update
Our segments operate in cyclical environments in which market conditions can change rapidly with significant positive or negative impacts on our results. We anticipate that various macroeconomic factors will continue to drive uncertainty and instability in global energy and agricultural commodity markets, as well as global financial markets, which could have a significant impact on each of our segments during the remainder of fiscal 2024. These factors include the ongoing war between Russia and Ukraine and any escalation of conflict in the Middle East; shifts in global trade flows for commodities; a higher interest rate environment; and inflationary pressures increasing costs of labor, freight and materials. In addition to these broad macroeconomic factors, other factors could impact the demand and pricing for agricultural inputs and outputs, as well as our ability to supply those inputs and outputs while remaining profitable. These include the cost of renewable energy credits, the prices of which remains volatile and could continue to negatively impact our profitability, and regional factors, such as unpredictable weather conditions, including those due to climate change. We currently expect the imbalance between global supply and strong global demand for energy and agricultural commodities to continue to moderate through the remainder of fiscal 2024. We are unable to predict how long the current environment will last or the severity of the financial and operational impacts to us in fiscal 2024. Refer to Item 1A of our Annual Report on Form 10-K for the year ended August 31, 2023 for additional impacts that these and other risks may have on our business operations and financial performance.
We will continue to execute our enterprise priorities for fiscal 2024, including empowering and investing in our people, accelerating our operating model to better serve owners and customers, navigating dynamic and changing market conditions, and elevating sustainable growth through empowered teams, an integrated operating model and a solid financial foundation.
23
Operating Metrics
Energy
Our Energy segment operations primarily include our refineries in Laurel, Montana, and McPherson, Kansas, which process crude oil to produce refined products, including gasoline, distillates and other products. To ensure the reliability of our refineries, we perform major maintenance activities every two to five years, which require a temporary shutdown of operations. These planned shutdowns allow us to extend the life, increase the capacity and improve the safety and efficiency of our refinery processing assets. They also minimize unplanned business interruptions and are essential to the long-term reliability and profitability of our Energy segment.
During periods of maintenance, utilization rates, throughput volumes and refined fuel yields are lower, and we may purchase refined petroleum products from third parties to meet the needs of our customers. These third-party purchases may result in lower margins than for products produced by our refineries, which reduces our profitability. The following table provides information about our consolidated refinery operations:
| Three Months Ended | Six Months Ended | ||||||||||||||||||||||
| February 29, 2024 | February 28, 2023 | February 29, 2024 | February 28, 2023 | ||||||||||||||||||||
| Refinery throughput volumes | (Barrels per day) | ||||||||||||||||||||||
| Heavy, high-sulfur crude oil | 107,662 | 102,880 | 106,417 | 96,111 | |||||||||||||||||||
| All other crude oil | 68,169 | 69,371 | 70,050 | 70,326 | |||||||||||||||||||
| Other feedstocks and blendstocks | 5,309 | 9,477 | 9,665 | 10,096 | |||||||||||||||||||
| Total refinery throughput volumes | 181,140 | 181,728 | 186,132 | 176,533 | |||||||||||||||||||
| Refined fuel yields | |||||||||||||||||||||||
| Gasolines | 78,076 | 80,722 | 81,918 | 78,355 | |||||||||||||||||||
| Distillates | 85,243 | 82,208 | 85,158 | 78,782 | |||||||||||||||||||
We are subject to the Renewable Fuel Standard that requires refiners to blend renewable fuels (e.g., ethanol and biodiesel) into their finished transportation fuels or purchase renewable energy credits, known as renewable identification numbers ("RINs"), in lieu of blending. The U.S. Environmental Protection Agency ("EPA") generally establishes new annual renewable fuel percentage standards for each compliance year in the preceding year. In June 2023, the EPA issued a final renewable volume obligation ("RVO") for calendar years 2020 through 2025. We generate RINs through our blending activities, but we cannot generate enough RINs to meet the needs of our refining capacity; therefore, RINs must be purchased on the open market. The price of RINs can be volatile, with prices for D6 ethanol RINs and D4 biodiesel RINs decreasing by 59% and 60%, respectively, during the three months ended February 29, 2024, compared to the same period during the prior year, which positively impacted our earnings. Estimates of our RIN expenses are calculated using an average RIN price each month.
In addition to our internal operational reliability, the profitability of our Energy segment is largely driven by crack spreads (i.e., the price differential between refined products and crude oil inputs) and Western Canadian Select ("WCS") crude oil discounts (i.e., the price discount for WCS crude oil relative to West Texas Intermediate ("WTI") crude oil), which are driven by supply and demand of refined products. Crack spreads and WCS crude oil discounts both decreased during the three and six months ended February 29, 2024, compared to the same period during the prior year, contributing to lower IBIT for the Energy segment. The table below provides information about average market reference prices and differentials that impacted our Energy segment:
| Three Months Ended | Six Months Ended | ||||||||||||||||||||||
| February 29, 2024 | February 28, 2023 | February 29, 2024 | February 28, 2023 | ||||||||||||||||||||
| Market indicators | |||||||||||||||||||||||
| WTI crude oil (dollars per barrel) | $ | 74.20 | $ | 77.18 | $ | 79.14 | $ | 81.17 | |||||||||||||||
| WTI - WCS crude oil discount (dollars per barrel) | $ | 21.84 | $ | 27.77 | $ | 20.02 | $ | 25.09 | |||||||||||||||
| Group 3 2:1:1 crack spread (dollars per barrel)* | $ | 17.10 | $ | 30.46 | $ | 23.87 | $ | 37.61 | |||||||||||||||
| Group 3 5:3:2 crack spread (dollars per barrel)* | $ | 15.32 | $ | 28.12 | $ | 21.52 | $ | 34.26 | |||||||||||||||
| D6 ethanol RIN (dollars per RIN) | $ | 0.6678 | $ | 1.6194 | $ | 0.8183 | $ | 1.6463 | |||||||||||||||
| D4 biodiesel RIN (dollars per RIN) | $ | 0.6742 | $ | 1.6857 | $ | 0.8221 | $ | 1.7558 | |||||||||||||||
*Group 3 refers to the oil refining and distribution system serving Midwest markets from the Gulf Coast through the Plains states.
24
Ag
Our Ag segment operations work together to facilitate the production, purchase, sale and eventual use of grain and other agricultural commodities within the United States and internationally. Profitability in our Ag segment is largely driven by throughput and production volumes, as well as commodity price spreads; however, revenues and cost of goods sold ("COGS") are largely affected by market-driven commodity prices outside our control. The table below provides information about average market prices for agricultural commodities, as well as sales and throughput volumes that impacted our Ag segment:
| Three Months Ended | Six Months Ended | ||||||||||||||||||||||||||||
| Market Source* | February 29, 2024 | February 28, 2023 | February 29, 2024 | February 28, 2023 | |||||||||||||||||||||||||
| Commodity prices | |||||||||||||||||||||||||||||
| Corn (dollars per bushel) | Chicago Board of Trade | $ | 4.45 | $ | 6.63 | $ | 4.59 | $ | 6.70 | ||||||||||||||||||||
| Soybeans (dollars per bushel) | Chicago Board of Trade | $ | 12.15 | $ | 15.16 | $ | 12.58 | $ | 14.65 | ||||||||||||||||||||
| Wheat (dollars per bushel) | Chicago Board of Trade | $ | 6.00 | $ | 7.48 | $ | 5.78 | $ | 8.03 | ||||||||||||||||||||
| Urea (dollars per ton) | Green Markets NOLA | $ | 326.54 | $ | 396.83 | $ | 348.42 | $ | 499.12 | ||||||||||||||||||||
| Urea ammonium nitrate (dollars per ton) | Green Markets NOLA | $ | 239.97 | $ | 392.96 | $ | 245.59 | $ | 469.85 | ||||||||||||||||||||
| Ethanol (dollars per gallon) | Chicago Platts | $ | 1.59 | $ | 2.19 | $ | 1.87 | $ | 2.34 | ||||||||||||||||||||
| Volumes | |||||||||||||||||||||||||||||
| Grain and oilseed (thousands of bushels) | 612,682 | 567,198 | 1,204,094 | 1,084,637 | |||||||||||||||||||||||||
| North American grain and oilseed port throughput (thousands of bushels) | 197,816 | 174,876 | 376,516 | 336,591 | |||||||||||||||||||||||||
| Wholesale crop nutrients (thousands of tons) | 1,540 | 1,373 | 3,410 | 2,985 | |||||||||||||||||||||||||
| Ethanol (thousands of gallons) | 186,415 | 237,642 | 433,416 | 481,403 | |||||||||||||||||||||||||
*Market source information represents the average month-end price during the period.
25
Results of Operations
Three Months Ended February 29, 2024, and February 28, 2023
| Three Months Ended | |||||||||||||||||||||||
| February 29, 2024 | % of Revenues* | February 28, 2023 | % of Revenues* | ||||||||||||||||||||
| (Dollars in thousands) | |||||||||||||||||||||||
| Revenues | $ | 100.0 | % | $ | 100.0 | % | |||||||||||||||||
| Cost of goods sold | 96.0 | 96.6 | |||||||||||||||||||||
| Gross profit | 4.0 | 3.4 | |||||||||||||||||||||
| Marketing, general and administrative expenses | 3.3 | 2.1 | |||||||||||||||||||||
| Operating earnings | 0.7 | 1.3 | |||||||||||||||||||||
| Interest expense | 0.3 | 0.3 | |||||||||||||||||||||
| Other income | ( | (0.3) | ( | (0.3) | |||||||||||||||||||
| Equity income from investments | ( | (1.2) | ( | (1.6) | |||||||||||||||||||
| Income before income taxes | 2.0 | 2.8 | |||||||||||||||||||||
| Income tax expense | 0.2 | 0.2 | |||||||||||||||||||||
| Net income | 1.9 | 2.6 | |||||||||||||||||||||
| Net income (loss) attributable to noncontrolling interests | — | ( | — | ||||||||||||||||||||
| Net income attributable to CHS Inc. | $ | 1.9 | % | $ | 2.6 | % | |||||||||||||||||
*Amounts less than 0.1% are shown as zero percent. Percentage totals may differ due to rounding.
The charts below detail revenues, net of intersegment revenues, and IBIT by reportable segment for the three months ended February 29, 2024. Our Nitrogen Production reportable segment represents an equity method investment that records earnings and allocated expenses but not revenues.
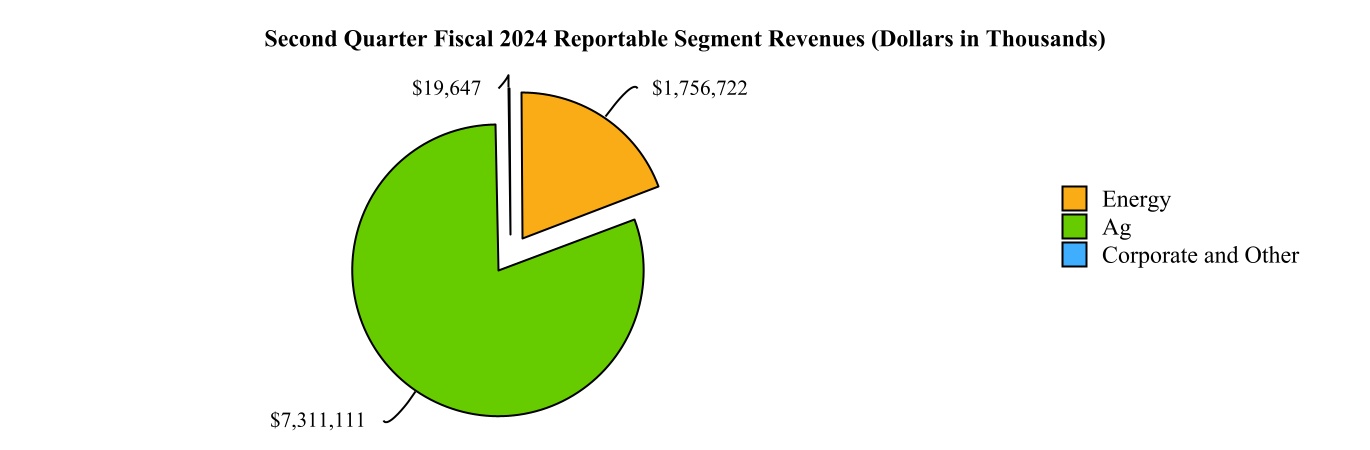
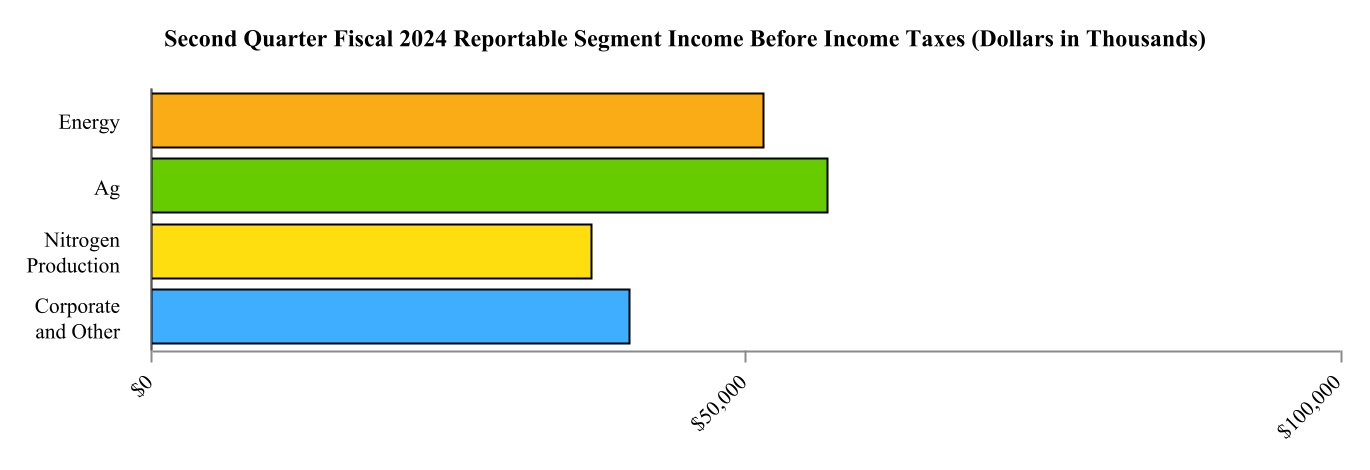
26
Income Before Income Taxes by Segment
Energy
| Three Months Ended | Change | ||||||||||||||||||||||
| February 29, 2024 | February 28, 2023 | Dollars | Percent | ||||||||||||||||||||
| (Dollars in thousands) | |||||||||||||||||||||||
| Income before income taxes | $ | $ | $ | (213,243) | (80.5 | %) | |||||||||||||||||
The following waterfall analysis and commentary presents the changes in our Energy segment IBIT for the three months ended February 29, 2024, compared to the same period during the prior year:
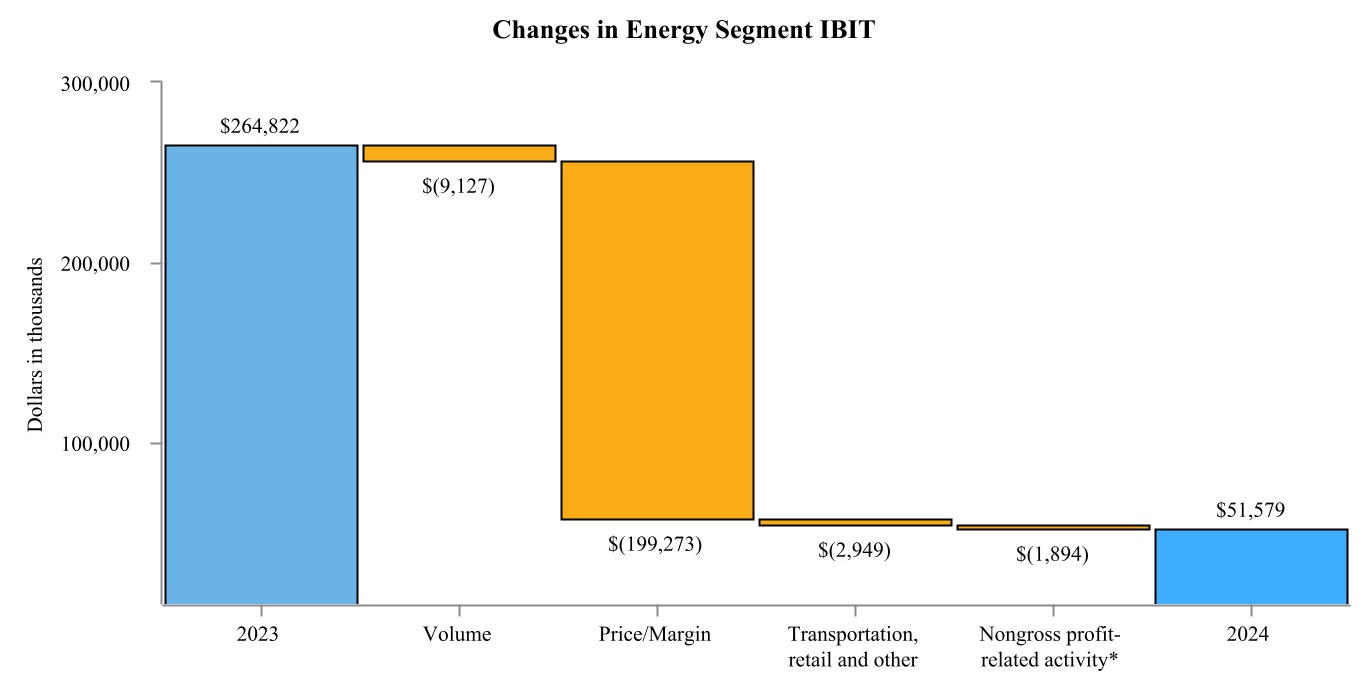
*See commentary related to these changes in the marketing, general and administrative expenses, interest expense, other income and equity income from investments sections of this Results of Operations.
The change in Energy segment IBIT reflects the following:
•Lower crack spreads and decreased WCS crude oil discounts resulted from less favorable global market conditions compared to the same period during the prior year, which contributed to a $235.8 million decrease of IBIT.
•Lower margins for propane and refined fuels attributable to hedging-related impacts due to global market conditions
affecting the price of these products contributed $29.4 million and $9.4 million of decreased IBIT, respectively.
•The overall decreased IBIT was partially offset by decreased costs for RINs in our refined fuels business, which contributed to reduced costs of $66.8 million.
27
Ag
| Three Months Ended | Change | ||||||||||||||||||||||
| February 29, 2024 | February 28, 2023 | Dollars | Percent | ||||||||||||||||||||
| (Dollars in thousands) | |||||||||||||||||||||||
| Income before income taxes | $ | $ | ( | $ | 138,417 | 169.7 | % | ||||||||||||||||
The following waterfall analysis and commentary presents the changes in our Ag segment IBIT for the three months ended February 29, 2024, compared to the same period during the prior year:
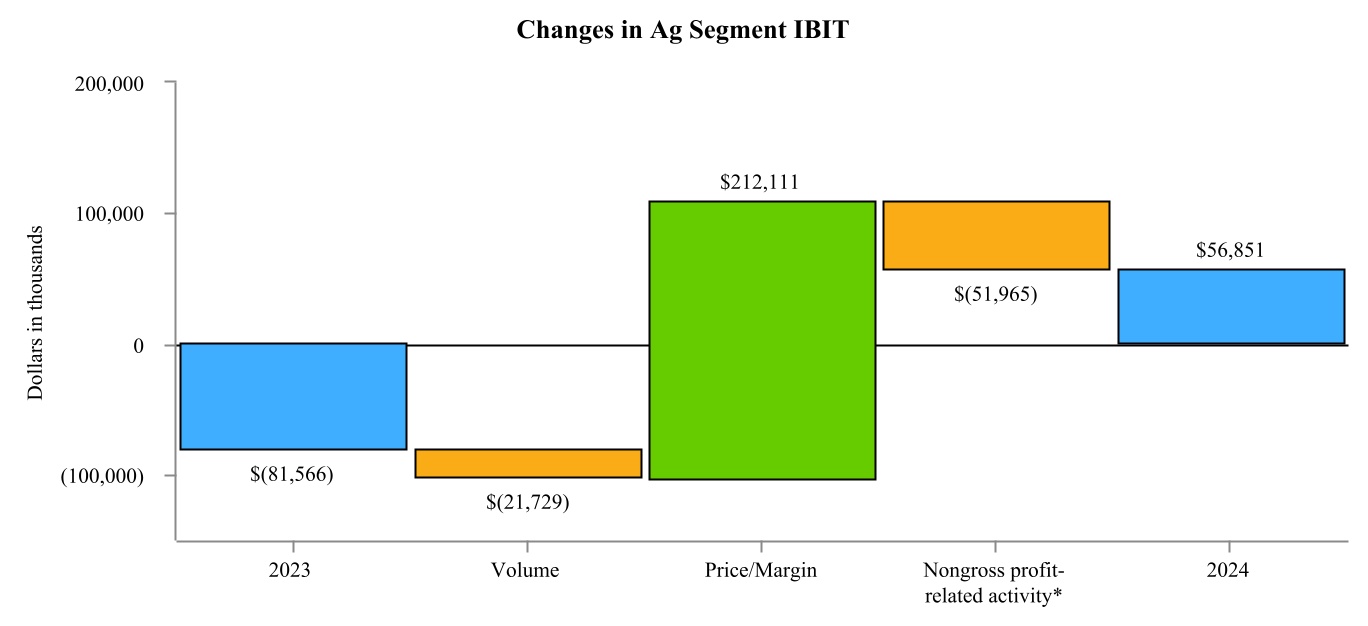
*See commentary related to these changes in the marketing, general and administrative expenses, interest expense, other income and equity income from investments sections of this Results of Operations.
The change in Ag segment IBIT reflects the following:
•Increased margins for our wholesale and retail agronomy products due to improved market conditions contributed to a $112.9 million increase of IBIT, including the impact of a $57.2 million noncash charge to reduce our inventories to their net realizable value during the second quarter of fiscal 2023, which did not reoccur in the current period.
•Increased margins for our grain and oilseed product category resulted primarily from the timing of the impact of mark-to-market adjustments associated with our commodity derivatives and contributed to a $85.2 million increase of IBIT.
All Other Segments
| Three Months Ended | Change | ||||||||||||||||||||||
| February 29, 2024 | February 28, 2023 | Dollars | Percent | ||||||||||||||||||||
| (Dollars in thousands) | |||||||||||||||||||||||
| Nitrogen Production IBIT* | $ | $ | $ | (44,724) | (54.7 | %) | |||||||||||||||||
| Corporate and Other IBIT | $ | $ | $ | (7,814) | (16.3 | %) | |||||||||||||||||
*For additional information, see Note 5, Investments, of the notes to the unaudited condensed consolidated financial statements that are included in this Quarterly Report on Form 10-Q.
Our Nitrogen Production segment IBIT decreased from the prior year due to lower equity income attributed to decreased selling prices of urea and UAN, which was partially offset by decreased natural gas costs, all due to global supply and demand factors. Corporate and Other IBIT decreased primarily due to lower equity income from Ventura Foods, LLC ("Ventura Foods"), which experienced less favorable market conditions for edible oils during the second quarter of fiscal 2024 compared to the same period during the prior year.
28
Revenues by Segment
Energy
| Three Months Ended | Change | ||||||||||||||||||||||
| February 29, 2024 | February 28, 2023 | Dollars | Percent | ||||||||||||||||||||
| (Dollars in thousands) | |||||||||||||||||||||||
| Revenues | $ | $ | $ | (412,179) | (19.0 | %) | |||||||||||||||||
The following waterfall analysis and commentary presents the changes in our Energy segment revenues for the three months ended February 29, 2024, compared to the same period during the prior year:
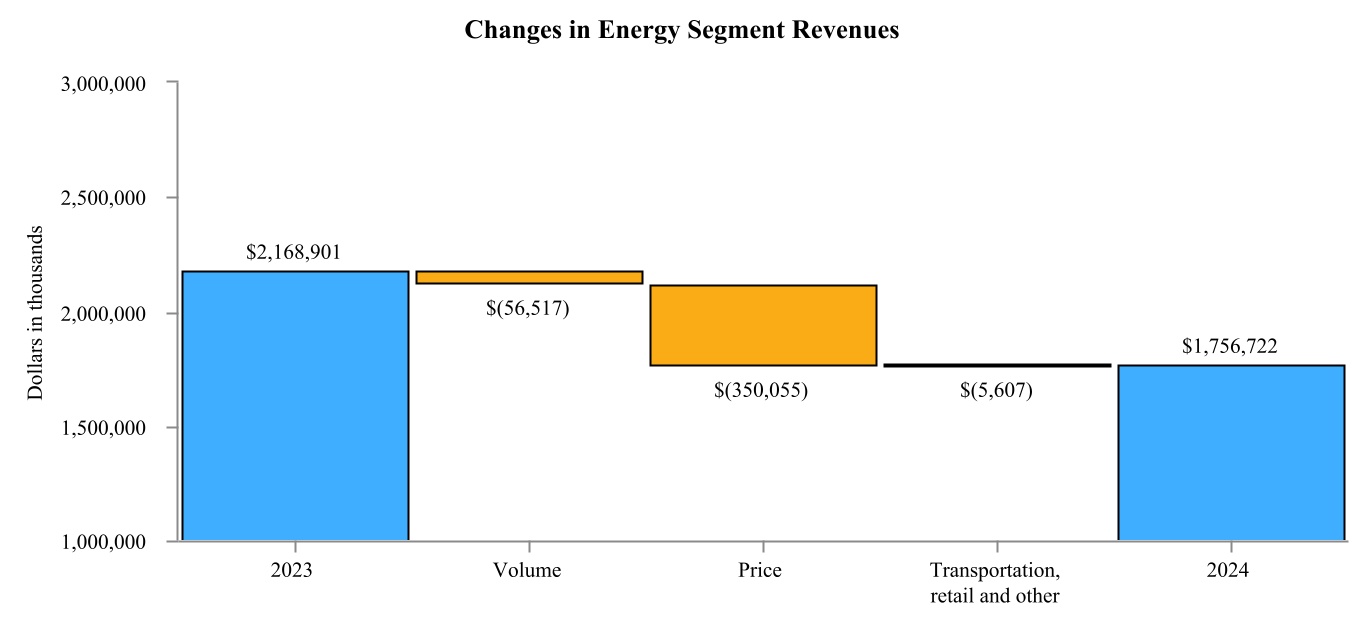
The change in Energy segment revenues reflects the following:
•Decreased selling prices resulting from global market conditions contributed to $279.6 million and $66.7 million decreases in revenues for refined fuels and propane, respectively.
•Lower propane and refined fuels volumes contributed to $34.9 million and $24.8 million decreases in revenues, respectively, primarily driven by lower demand associated with the warm winter weather conditions across much of our trade territory.
29
Ag
| Three Months Ended | Change | ||||||||||||||||||||||
| February 29, 2024 | February 28, 2023 | Dollars | Percent | ||||||||||||||||||||
| (Dollars in thousands) | |||||||||||||||||||||||
| Revenues | $ | $ | $ | (1,809,359) | (19.8 | %) | |||||||||||||||||
The following waterfall analysis and commentary presents the changes in our Ag segment revenues for the three months ended February 29, 2024, compared to the same period during the prior year:
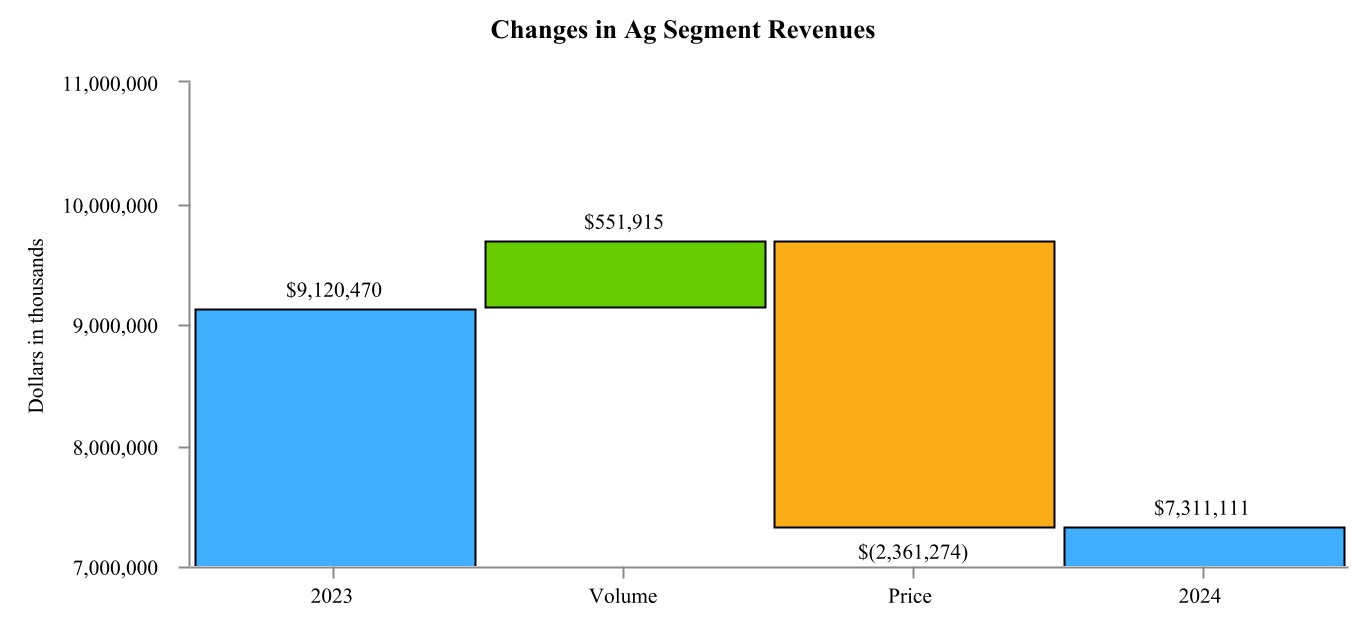
The change in Ag segment revenues reflects the following:
•Decreased selling prices across most of our Ag segment product categories during the second quarter of fiscal 2024, including:
◦$1.9 billion decrease for grain and oilseed primarily as a result of less favorable pricing due to global market conditions;
◦$243.1 million decrease for wholesale and retail agronomy products driven by lower urea and UAN prices; and
◦$124.9 million decrease for oilseed processing due to global market conditions.
•Increased volumes for grain and oilseed contributed to a $546.0 million increase in revenues, primarily due to stronger global demand for grain and oilseed as prices have declined.
All Other Segments
| Three Months Ended | Change | ||||||||||||||||||||||
| February 29, 2024 | February 28, 2023 | Dollars | Percent | ||||||||||||||||||||
| (Dollars in thousands) | |||||||||||||||||||||||
| Corporate and Other revenues* | $ | $ | $ | 2,170 | 12.4 | % | |||||||||||||||||
*Our Nitrogen Production reportable segment represents an equity method investment that records earnings and allocated expenses but not revenues.
Corporate and Other revenues increased during the three months ended February 29, 2024, compared to the same period during the prior year, primarily due to increased interest income as a result of a larger average notes receivable balance and higher interest rates.
30
Cost of Goods Sold by Segment
Energy
| Three Months Ended | Change | ||||||||||||||||||||||
| February 29, 2024 | February 28, 2023 | Dollars | Percent | ||||||||||||||||||||
| (Dollars in thousands) | |||||||||||||||||||||||
| Cost of goods sold | $ | 1,630,422 | $ | 1,831,252 | $ | (200,830) | (11.0 | %) | |||||||||||||||
The following waterfall analysis and commentary presents the changes in our Energy segment COGS for the three months ended February 29, 2024, compared to the same period during the prior year:
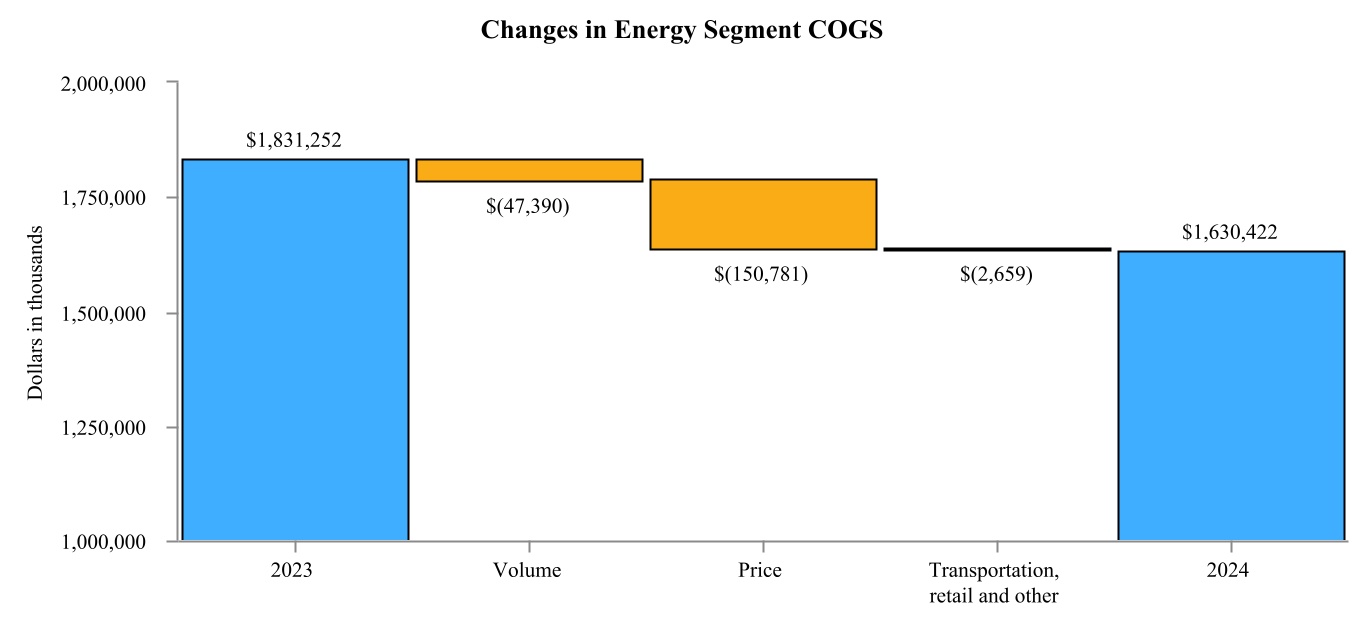
The change in Energy segment COGS reflects the following:
•Global market conditions, including reduced RIN costs within our refined fuels business, contributed to decreased costs for refined fuels and propane that drove $103.4 million and $43.2 million decreases in COGS, respectively.
•Lower volumes of propane and refined fuels resulting from decreased demand associated with the warm winter weather conditions across much of our trade territory and global market conditions contributed to decreased COGS of $29.3 million and $20.9 million, respectively.
31
Ag
| Three Months Ended | Change | ||||||||||||||||||||||
| February 29, 2024 | February 28, 2023 | Dollars | Percent | ||||||||||||||||||||
| (Dollars in thousands) | |||||||||||||||||||||||
| Cost of goods sold | $ | 7,091,565 | $ | 9,091,307 | $ | (1,999,742) | (22.0 | %) | |||||||||||||||
The following waterfall analysis and commentary presents the changes in our Ag segment COGS for the three months ended February 29, 2024, compared to the same period during the prior year:
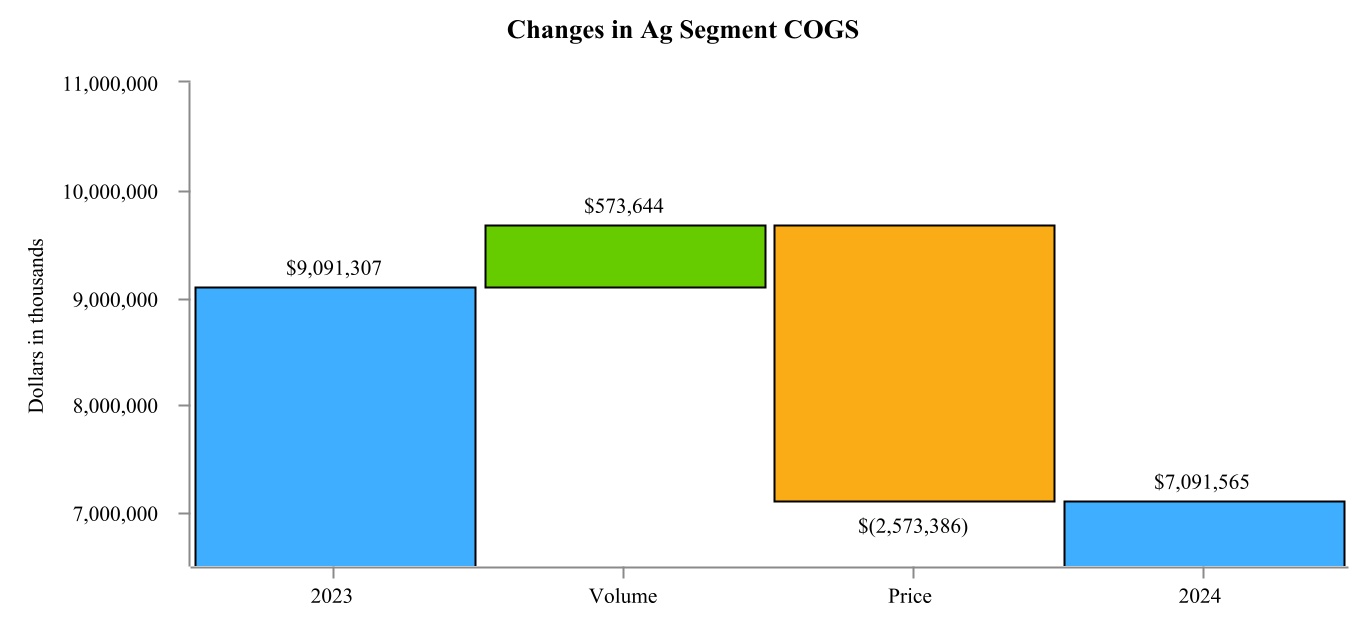
The change in Ag segment COGS reflects the following:
•Lower costs across most of our Ag segment product categories during the second quarter of fiscal 2024, including:
◦$2.0 billion decrease for grain and oilseed primarily driven by lower pricing due to global market conditions;
◦$356.0 million decrease for wholesale and retail agronomy products driven by lower urea and UAN prices and the impact of a $57.2 million noncash charge to reduce our inventories to their net realizable value during the second quarter of fiscal 2023 that did not reoccur in the current period; and
◦$140.9 million decrease for oilseed processing due to global market conditions.
•Increased volumes for grain and oilseed contributed to a $544.9 million increase in COGS, primarily due to stronger global demand for grain and oilseed as prices have declined.
All Other Segments
| Three Months Ended | Change | ||||||||||||||||||||||
| February 29, 2024 | February 28, 2023 | Dollars | Percent | ||||||||||||||||||||
| (Dollars in thousands) | |||||||||||||||||||||||
| Nitrogen Production COGS | $ | 419 | $ | 424 | $ | (5) | (1.2 | %) | |||||||||||||||
| Corporate and Other COGS | $ | (818) | $ | (402) | $ | (416) | (103.5 | %) | |||||||||||||||
There were no significant changes on a dollar basis to COGS in our Nitrogen Production segment or Corporate and Other during the three months ended February 29, 2024, compared to the same period during the prior year.
32
Marketing, General and Administrative Expenses
| Three Months Ended | Change | ||||||||||||||||||||||
| February 29, 2024 | February 28, 2023 | Dollars | Percent | ||||||||||||||||||||
| (Dollars in thousands) | |||||||||||||||||||||||
| Marketing, general and administrative expenses | $ | $ | $ | 56,305 | 23.3 | % | |||||||||||||||||
Marketing, general and administrative expenses increased during the three months ended February 29, 2024, primarily due to higher compensation and benefit expenses during the current fiscal year, as well as a recovery of certain receivables during the same period of the prior year that had been previously reserved.
Interest Expense
| Three Months Ended | Change | ||||||||||||||||||||||
| February 29, 2024 | February 28, 2023 | Dollars | Percent | ||||||||||||||||||||
| (Dollars in thousands) | |||||||||||||||||||||||
| Interest expense | $ | $ | $ | (10,507) | (29.2 | %) | |||||||||||||||||
Interest expense decreased during the three months ended February 29, 2024, as a result of decreased notes payable balances, which was partially offset by higher interest rates compared to the same period in the prior year.
Other Income
| Three Months Ended | Change | ||||||||||||||||||||||
| February 29, 2024 | February 28, 2023 | Dollars | Percent | ||||||||||||||||||||
| (Dollars in thousands) | |||||||||||||||||||||||
| Other income | $ | 31,339 | $ | 28,313 | $ | 3,026 | 10.7 | % | |||||||||||||||
Other income increased during the three months ended February 29, 2024, primarily as a result of increased interest income due to a larger average cash balance and higher interest rates.
Equity Income from Investments
| Three Months Ended | Change | ||||||||||||||||||||||
| February 29, 2024 | February 28, 2023 | Dollars | Percent | ||||||||||||||||||||
| (Dollars in thousands) | |||||||||||||||||||||||
| Equity income from investments* | $ | 112,117 | $ | 178,334 | $ | (66,217) | (37.1 | %) | |||||||||||||||
*For additional information, see Note 5, Investments, of the notes to the condensed consolidated financial statements that are included in this Quarterly Report on Form 10-Q.
Equity income from investments decreased during the three months ended February 29, 2024, compared to the same period during the prior year, primarily due to lower income associated with our equity method investments in CF Nitrogen as a result of lower prices of urea and UAN due to global supply and demand factors and Ventura Foods due to less favorable market conditions for edible oils during the second quarter of fiscal 2024 compared to the same period during the prior year.
Income Tax Expense
| Three Months Ended | Change | ||||||||||||||||||||||
| February 29, 2024 | February 28, 2023 | Dollars | Percent | ||||||||||||||||||||
| (Dollars in thousands) | |||||||||||||||||||||||
| Income tax expense | $ | $ | $ | (5,649) | (26.9 | %) | |||||||||||||||||
Decreased income tax expense during the three months ended February 29, 2024, resulted primarily from lower nonpatronage earnings during the period. Effective tax rates for the three months ended February 29, 2024, and February 28, 2023, were 8.3 % and 6.7 %, respectively. Federal and state statutory rates of 24.5% and 24.4% were applied to nonpatronage business activity for the three months ended February 29, 2024, and February 28, 2023, respectively. Income taxes and effective tax rates vary each year based on profitability, income tax credits, nonpatronage business activity and current equity management assumptions.
33
Results of Operations
Six Months Ended February 29, 2024, and February 28, 2023
| Six Months Ended | |||||||||||||||||||||||
| 2024 | % of Revenues* | 2023 | % of Revenues* | ||||||||||||||||||||
| (Dollars in thousands) | |||||||||||||||||||||||
| Revenues | $ | 100.0 | % | $ | 100.0 | % | |||||||||||||||||
| Cost of goods sold | 95.1 | 94.8 | |||||||||||||||||||||
| Gross profit | 4.9 | 5.2 | |||||||||||||||||||||
| Marketing, general and administrative expenses | 2.7 | 2.0 | |||||||||||||||||||||
| Operating earnings | 2.2 | 3.3 | |||||||||||||||||||||
| Interest expense | 0.3 | 0.3 | |||||||||||||||||||||
| Other income | ( | (0.4) | ( | (0.2) | |||||||||||||||||||
| Equity income from investments | ( | (1.1) | ( | (1.5) | |||||||||||||||||||
| Income before income taxes | 3.4 | 4.7 | |||||||||||||||||||||
| Income tax expense | — | 0.2 | |||||||||||||||||||||
| Net income | 3.4 | 4.5 | |||||||||||||||||||||
| Net income attributable to noncontrolling interests | — | — | |||||||||||||||||||||
| Net income attributable to CHS Inc. | $ | 3.4 | % | $ | 4.5 | % | |||||||||||||||||
*Amounts less than 0.1% are shown as zero percent. Percentage totals may differ due to rounding.
The charts below detail revenues, net of intersegment revenues, and IBIT by reportable segment for the six months ended February 29, 2024. Our Nitrogen Production reportable segment represents an equity method investment that records earnings and allocated expenses but not revenues.
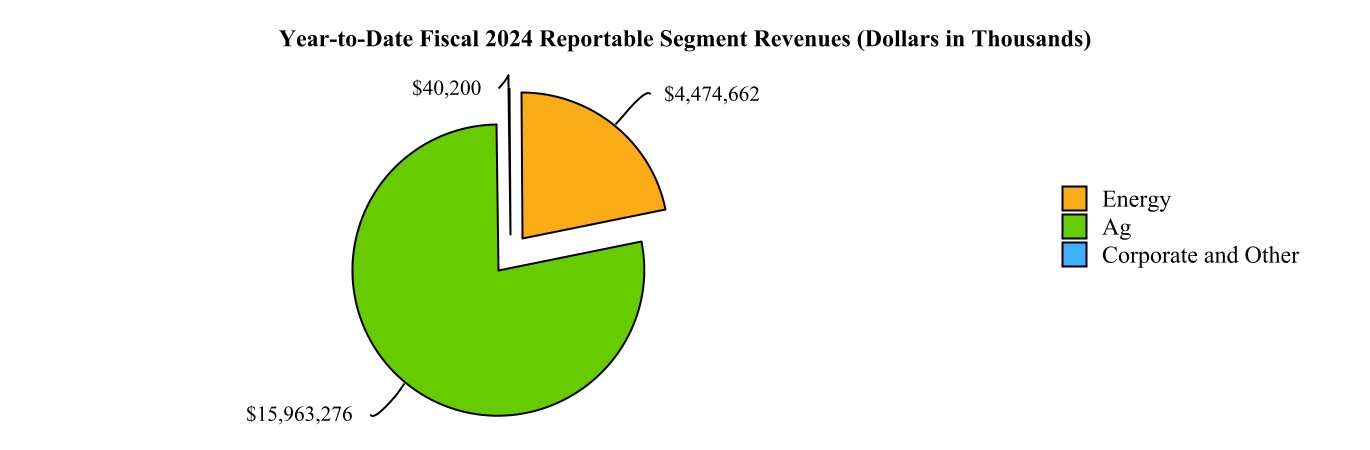
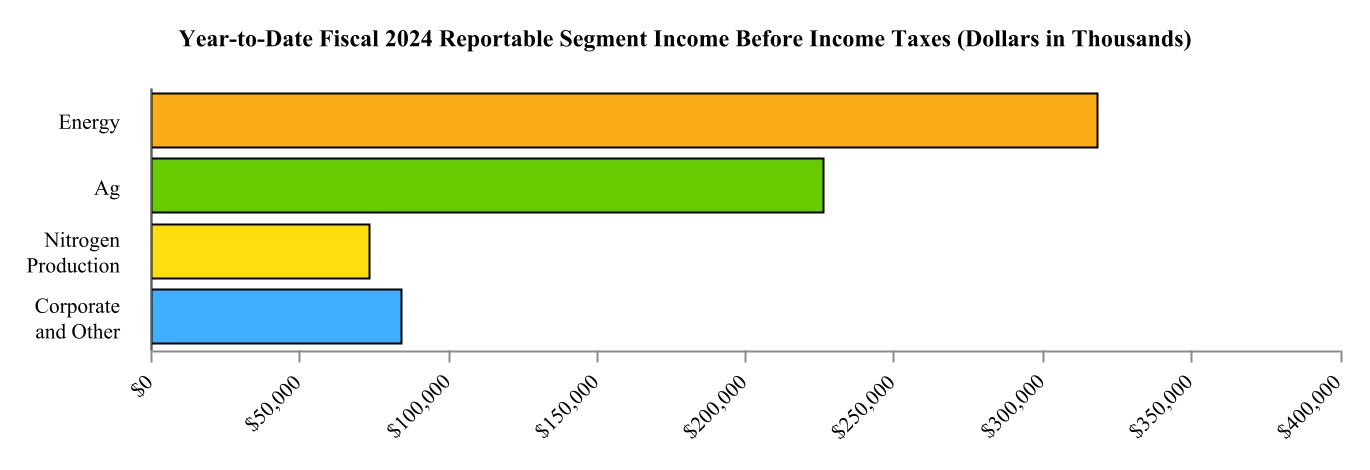
34
Income Before Income Taxes by Segment
Energy
| Six Months Ended | Change | ||||||||||||||||||||||
| February 29, 2024 | February 28, 2023 | Dollars | Percent | ||||||||||||||||||||
| (Dollars in thousands) | |||||||||||||||||||||||
| Income before income taxes | $ | $ | $ | (343,002) | (51.9 | %) | |||||||||||||||||
The following waterfall analysis and commentary presents the changes in our Energy segment IBIT for the six months ended February 29, 2024, compared to the same period during the prior year:
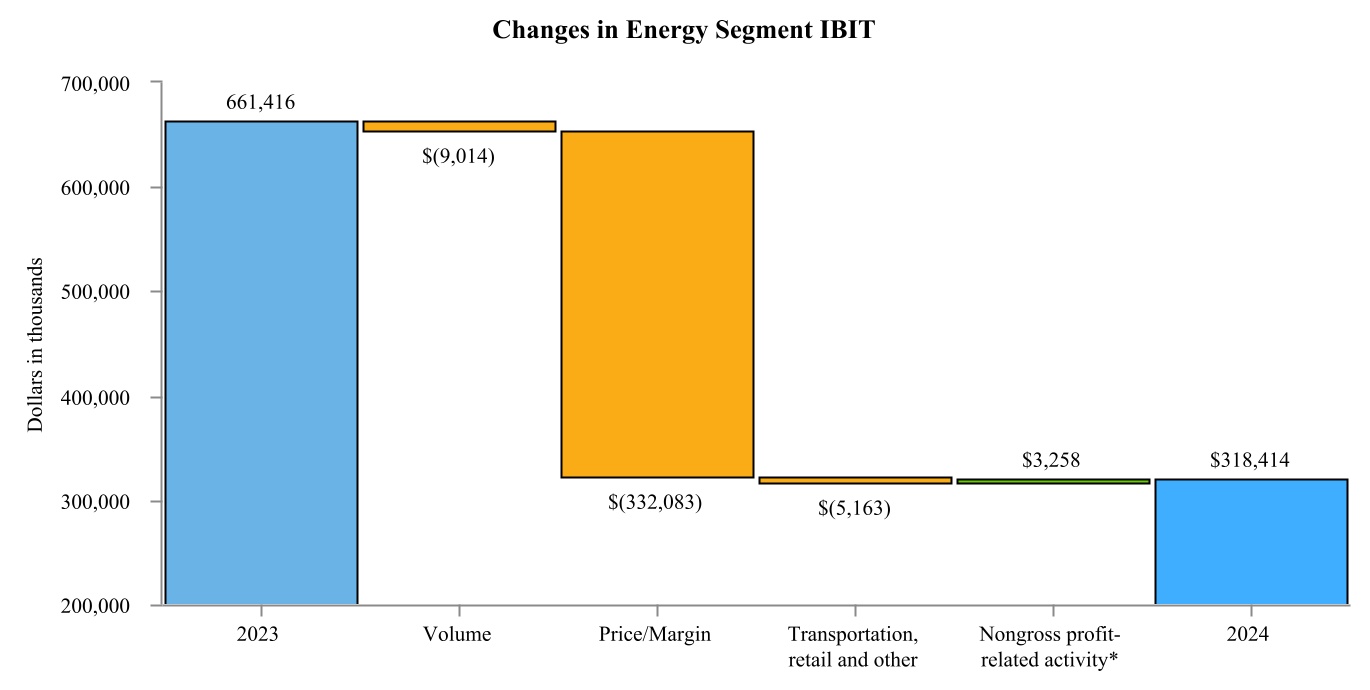
*See commentary related to these changes in the marketing, general and administrative expenses, interest expense, other income and equity income from investments sections of this Results of Operations.
The change in Energy segment IBIT reflects the following:
•Lower crack spreads and decreased WCS crude oil discounts resulted from global market conditions, which contributed to a $427.6 million decrease of IBIT.
•The overall decreased IBIT was partially offset by decreased costs for RINs in our refined fuels business, which contributed to a $114.4 million cost reduction.
35
Ag
| Six Months Ended | Change | ||||||||||||||||||||||
| February 29, 2024 | February 28, 2023 | Dollars | Percent | ||||||||||||||||||||
| (Dollars in thousands) | |||||||||||||||||||||||
| Income before income taxes | $ | $ | $ | 20,838 | 10.1 | % | |||||||||||||||||
The following waterfall analysis and commentary presents the changes in our Ag segment IBIT for the six months ended February 29, 2024, compared to the same period during the prior year:
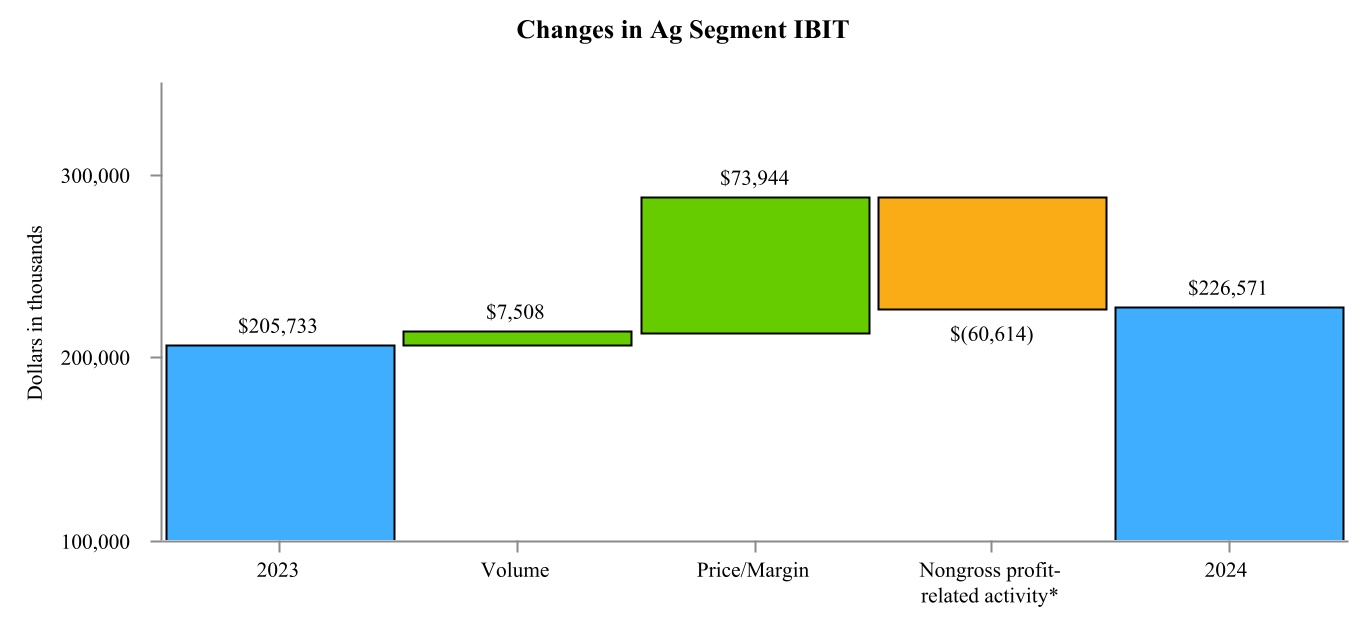
*See commentary related to these changes in the marketing, general and administrative expenses, interest expense, other income and equity income from investments sections of this Results of Operations.
The change in Ag segment IBIT reflects the following:
•Increased margins for our wholesale and retail agronomy products due to improved market conditions contributed to a $91.4 million increase of IBIT, including the impact of a $68.2 million noncash charge to reduce our inventories to their net realizable value during the first half of fiscal 2023, which did not reoccur in the current period.
•Higher volumes of grain and oilseed resulted in a $17.4 million increase of IBIT, primarily due to stronger global demand for grain as prices have declined.
All Other Segments
| Six Months Ended | Change | ||||||||||||||||||||||
| February 29, 2024 | February 28, 2023 | Dollars | Percent | ||||||||||||||||||||
| (Dollars in thousands) | |||||||||||||||||||||||
| Nitrogen Production IBIT* | $ | $ | $ | (105,138) | (58.9 | %) | |||||||||||||||||
| Corporate and Other IBIT | $ | $ | $ | (686) | (0.8 | %) | |||||||||||||||||
*For additional information, see Note 5, Investments, of the notes to the unaudited condensed consolidated financial statements that are included in this Quarterly Report on Form 10-Q.
Our Nitrogen Production segment IBIT decreased from the prior year due to lower equity income attributed to decreased selling prices of urea and UAN, which was partially offset by decreased natural gas costs, all due to global supply and demand factors. Corporate and other IBIT remained flat as lower equity income from Ventura Foods due to less favorable market conditions for edible oils during the first half of fiscal 2024 compared to the same period during the prior year was mostly offset by increased interest income resulting from higher interest rates and a larger cash balance.
36
Revenues by Segment
Energy
| Six Months Ended | Change | ||||||||||||||||||||||
| February 29, 2024 | February 28, 2023 | Dollars | Percent | ||||||||||||||||||||
| (Dollars in thousands) | |||||||||||||||||||||||
| Revenues | $ | $ | $ | (813,545) | (15.4 | %) | |||||||||||||||||
The following waterfall analysis and commentary presents the changes in our Energy segment revenues for the six months ended February 29, 2024, compared to the same period during the prior year:
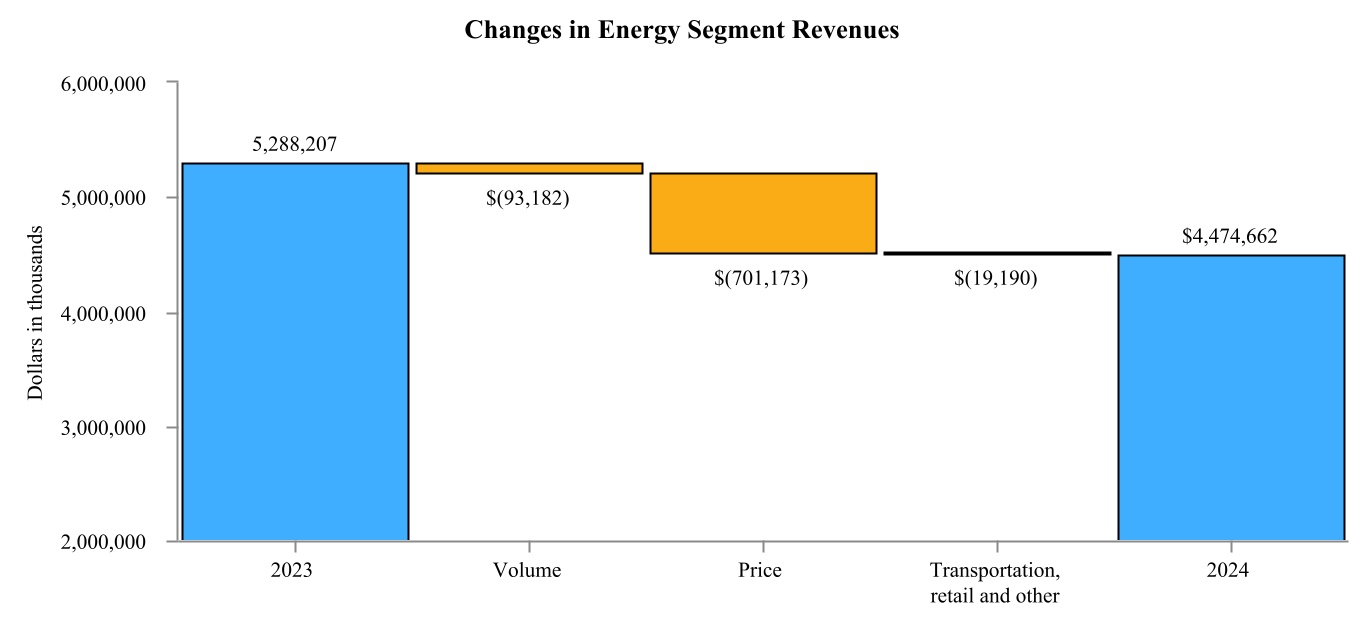
The change in Energy segment revenues reflects the following:
•Decreased selling prices resulting from global market conditions contributed to $577.5 million and $117.7 million decreases in revenues for refined fuels and propane, respectively.
•Lower propane and refined fuels volumes contributed to $52.1 million and $48.4 million decreases in revenues, respectively, primarily driven by lower demand due to warm winter weather conditions across much of our trade territory.
37
Ag
| Six Months Ended | Change | ||||||||||||||||||||||
| February 29, 2024 | February 28, 2023 | Dollars | Percent | ||||||||||||||||||||
| (Dollars in thousands) | |||||||||||||||||||||||
| Revenues | $ | $ | $ | (2,790,438) | (14.9 | %) | |||||||||||||||||
The following waterfall analysis and commentary presents the changes in our Ag segment revenues for the six months ended February 29, 2024, compared to the same period during the prior year:
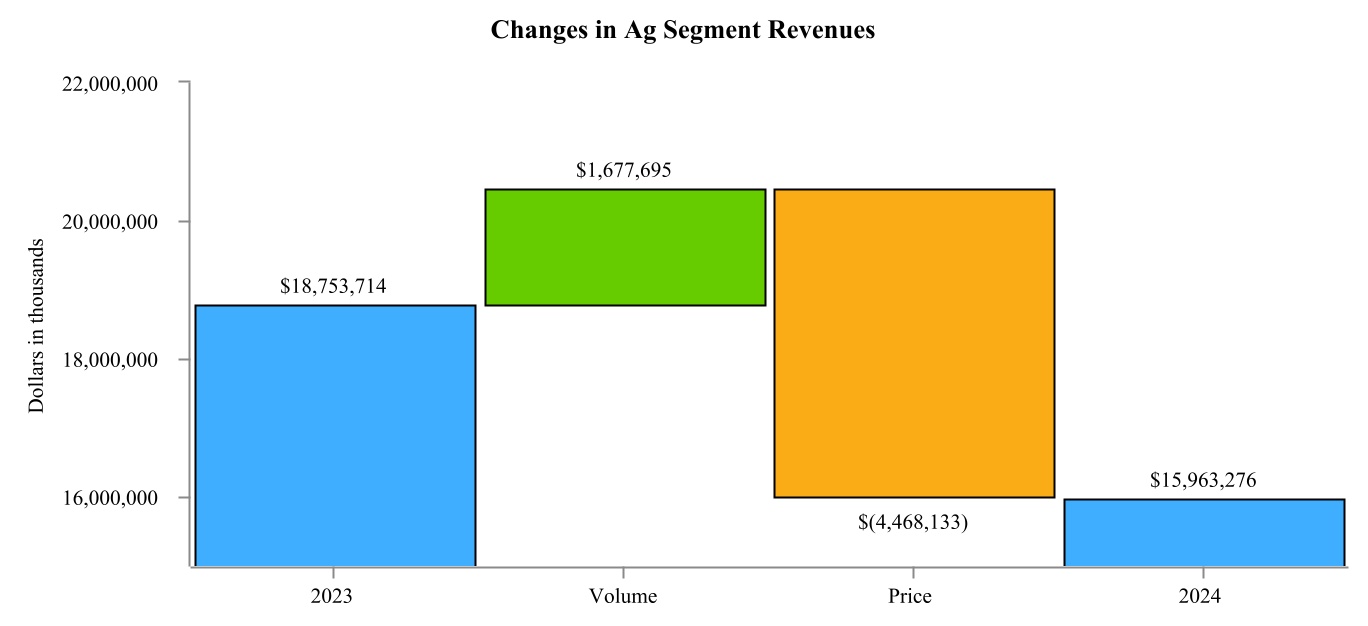
The change in Ag segment revenues reflects the following:
•Decreased selling prices across most of our Ag segment product categories during the first half of fiscal 2024, including:
◦$3.3 billion decrease for grain and oilseed primarily as a result of less favorable pricing due to global market conditions;
◦$745.2 million decrease for wholesale and retail agronomy products driven by lower urea and UAN prices;
◦$178.3 million decrease for oilseed processing due to global market conditions; and
◦$170.0 million decrease for renewable fuels resulting from lower ethanol prices due to decreased demand.
•Increased volumes for grain and oilseed contributed to a $1.5 billion increase in revenues, primarily due to stronger global demand for grain and oilseed as prices have declined.
•Increased volumes of wholesale and retail agronomy products, which experienced increased demand during the first half of fiscal 2024 as prices continued to remain lower due to global market conditions, contributed to a $238.5 million increase in revenues.
All Other Segments
| Six Months Ended | Change | ||||||||||||||||||||||
| February 29, 2024 | February 28, 2023 | Dollars | Percent | ||||||||||||||||||||
| (Dollars in thousands) | |||||||||||||||||||||||
| Corporate and Other revenues* | $ | $ | $ | 9,434 | 30.7 | % | |||||||||||||||||
*Our Nitrogen Production reportable segment represents an equity method investment that records earnings and allocated expenses but not revenues.
Corporate and Other revenues increased during the six months ended February 29, 2024, compared to the same period during the prior year, primarily due to increased interest income as a result of a larger average notes receivable balance and higher interest rates.
38
Cost of Goods Sold by Segment
Energy
| Six Months Ended | Change | ||||||||||||||||||||||
| February 29, 2024 | February 28, 2023 | Dollars | Percent | ||||||||||||||||||||
| (Dollars in thousands) | |||||||||||||||||||||||
| Cost of goods sold | $ | 4,018,695 | $ | 4,485,981 | $ | (467,286) | (10.4 | %) | |||||||||||||||
The following waterfall analysis and commentary presents the changes in our Energy segment COGS for the six months ended February 29, 2024, compared to the same period during the prior year:
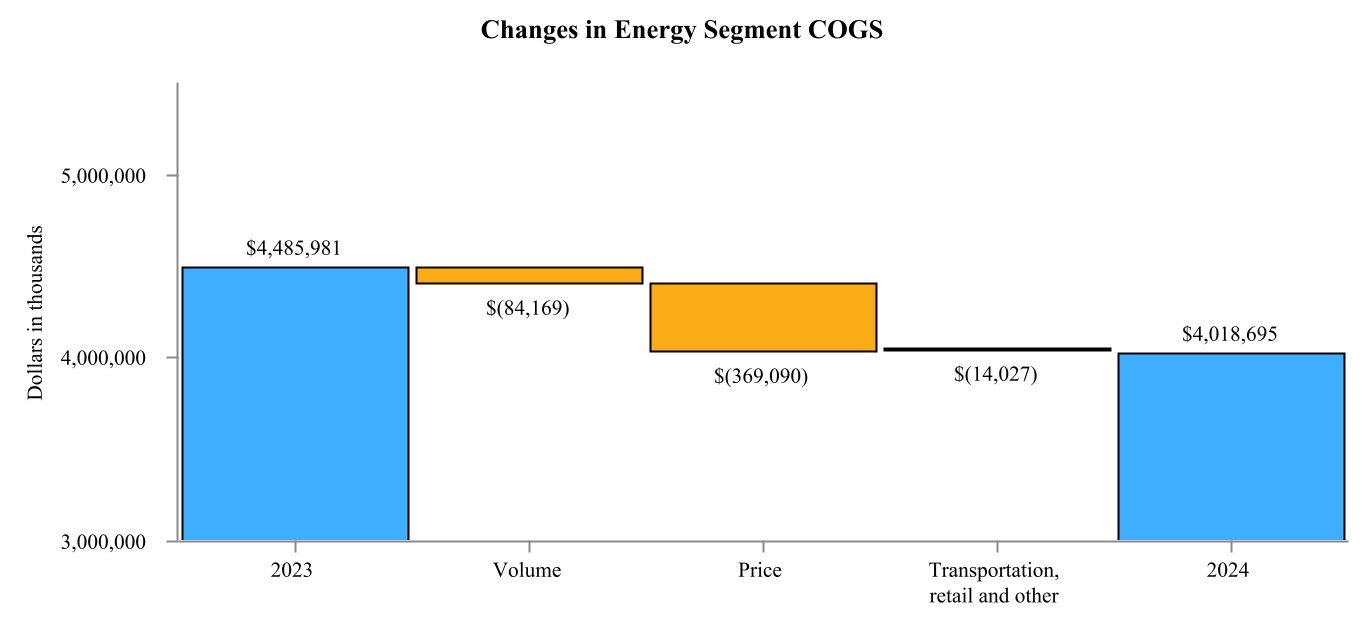
The change in Energy segment COGS reflects the following:
•Global market conditions, including reduced RIN costs, contributed to decreased costs for refined fuels and propane that drove $230.4 million and $132.5 million decreases in COGS, respectively.
•Lower propane and refined fuels volumes contributed to $50.3 million and $40.2 million decreases in COGS, respectively, primarily driven by lower demand due to warm winter weather conditions across much of our trade territory.
39
Ag
| Six Months Ended | Change | ||||||||||||||||||||||
| February 29, 2024 | February 28, 2023 | Dollars | Percent | ||||||||||||||||||||
| (Dollars in thousands) | |||||||||||||||||||||||
| Cost of goods sold | $ | 15,452,145 | $ | 18,324,035 | $ | (2,871,890) | (15.7 | %) | |||||||||||||||
The following waterfall analysis and commentary presents the changes in our Ag segment COGS for the six months ended February 29, 2024, compared to the same period during the prior year:
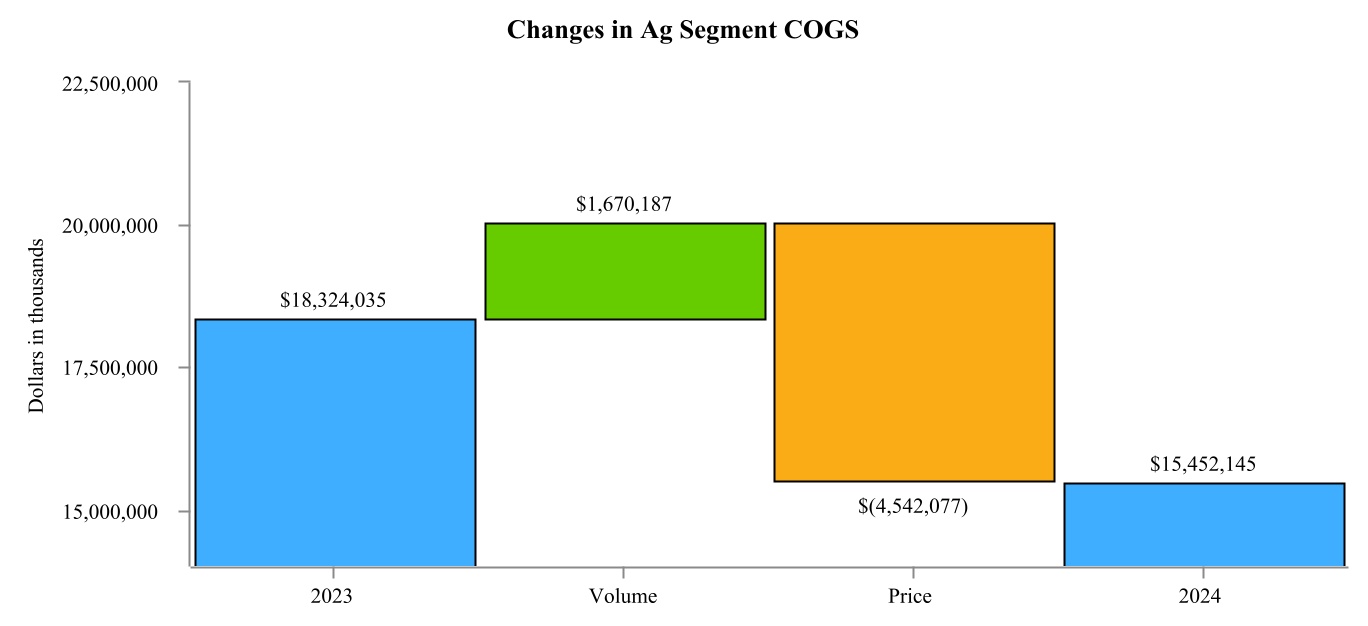
The change in Ag segment COGS reflects the following:
•Lower costs across most of our Ag segment product categories during the first half of fiscal 2024, including:
◦$3.3 billion decrease for grain and oilseed primarily driven by lower pricing due to global market conditions;
◦$836.6 million decrease for wholesale and retail agronomy products driven by lower urea and UAN prices and the impact of a $68.2 million noncash charge to reduce our inventories to their net realizable value during the first half of fiscal 2023 that did not reoccur in the current period;
◦$202.2 million decrease for renewable fuels primarily resulting from lower input costs; and
◦$156.2 million decrease for oilseed processing due to global market conditions.
•Increased volumes for grain and oilseed contributed to a $1.4 billion increase in COGS, primarily due to stronger global demand for grain and oilseed as prices have declined.
•Increased volumes of wholesale and retail agronomy products, which experienced increased demand during the first half of fiscal 2024 as prices continued to remain lower due to global market conditions, contributed to a $248.1 million increase in COGS.
All Other Segments
| Six Months Ended | Change | ||||||||||||||||||||||
| February 29, 2024 | February 28, 2023 | Dollars | Percent | ||||||||||||||||||||
| (Dollars in thousands) | |||||||||||||||||||||||
| Nitrogen Production COGS | $ | 831 | $ | 852 | $ | (21) | (2.5 | %) | |||||||||||||||
| Corporate and Other COGS | $ | (4,375) | $ | (1,583) | $ | (2,792) | (176.4 | %) | |||||||||||||||
There were no significant changes on a dollar basis to COGS in our Nitrogen Production segment or Corporate and Other during the six months ended February 29, 2024, compared to the same period during the prior year.
40
Marketing, General and Administrative Expenses
| Six Months Ended | Change | ||||||||||||||||||||||
| February 29, 2024 | February 28, 2023 | Dollars | Percent | ||||||||||||||||||||
| (Dollars in thousands) | |||||||||||||||||||||||
| Marketing, general and administrative expenses | $ | $ | $ | 73,695 | 15.5 | % | |||||||||||||||||
Marketing, general and administrative expenses increased during the six months ended February 29, 2024, primarily due to higher compensation and benefit expenses during the current fiscal year, as well as a recovery of certain receivables during the same period of the prior year that had been previously reserved.
Interest Expense
| Six Months Ended | Change | ||||||||||||||||||||||
| February 29, 2024 | February 28, 2023 | Dollars | Percent | ||||||||||||||||||||
| (Dollars in thousands) | |||||||||||||||||||||||
| Interest expense | $ | $ | $ | (14,129) | (20.4 | %) | |||||||||||||||||
Interest expense decreased during the six months ended February 29, 2024, as a result of decreased notes payable balances, which was partially offset by higher interest rates compared to the same period in the prior year.
Other Income
| Six Months Ended | Change | ||||||||||||||||||||||
| February 29, 2024 | February 28, 2023 | Dollars | Percent | ||||||||||||||||||||
| (Dollars in thousands) | |||||||||||||||||||||||
| Other income | $ | 75,868 | $ | 52,602 | $ | 23,266 | 44.2 | % | |||||||||||||||
Other income increased during the six months ended February 29, 2024, primarily as a result of increased interest income due to a larger average cash balance and higher interest rates.
Equity Income from Investments
| Six Months Ended | Change | ||||||||||||||||||||||
| February 29, 2024 | February 28, 2023 | Dollars | Percent | ||||||||||||||||||||
| (Dollars in thousands) | |||||||||||||||||||||||
| Equity income from investments* | $ | 221,168 | $ | 360,296 | $ | (139,128) | (38.6 | %) | |||||||||||||||
*For additional information, see Note 5, Investments, of the notes to the condensed consolidated financial statements that are included in this Quarterly Report on Form 10-Q.
Equity income from investments decreased during the six months ended February 29, 2024, compared to the same period during the prior year, primarily due to lower income associated with our equity method investments in CF Nitrogen as a result of lower prices of urea and UAN due to global supply and demand factors and Ventura Foods due to less favorable market conditions for edible oils during the first half of fiscal 2024 compared to the same period during the prior year.
Income Tax Expense
| Six Months Ended | Change | ||||||||||||||||||||||
| February 29, 2024 | February 28, 2023 | Dollars | Percent | ||||||||||||||||||||
| (Dollars in thousands) | |||||||||||||||||||||||
| Income tax expense | $ | $ | $ | (46,725) | (84.1 | %) | |||||||||||||||||
Decreased income tax expense during the six months ended February 29, 2024, resulted primarily from the recognition of research and development tax credits as well as lower nonpatronage income during the period. Effective tax rates for the six months ended February 29, 2024, and February 28, 2023, were 1.3% and 4.9%, respectively. Federal and state statutory rates of 24.5% and 24.4% were applied to nonpatronage business activity for the six months ended February 29, 2024, and February 28, 2023, respectively. Income taxes and effective tax rates vary each year based on profitability, income tax credits, nonpatronage business activity and current equity management assumptions.
41
Liquidity and Capital Resources
In assessing our financial condition, we consider factors such as working capital, internal benchmarking related to our applicable covenants and other financial information. The following financial information is used when assessing our liquidity and capital resources to meet our capital allocation priorities, which include maintaining the safety and compliance of our operations, paying interest on debt and preferred stock dividends, returning cash to our member-owners in the form of cash patronage and equity redemptions, and taking advantage of strategic opportunities that benefit our member-owners:
| February 29, 2024 | August 31, 2023 | ||||||||||
| (Dollars in thousands) | |||||||||||
| Cash and cash equivalents | $ | $ | |||||||||
| Notes payable | |||||||||||
| Long-term debt including current maturities | 1,828,635 | 1,827,658 | |||||||||
| Total equities | |||||||||||
| Working capital | 3,415,770 | 3,229,455 | |||||||||
| Current ratio* | 1.6 | 1.5 | |||||||||
*Current ratio is defined as current assets divided by current liabilities.
Summary of Our Major Sources of Cash and Cash Equivalents
We fund our current operations primarily through our cash flows from operations and with short-term borrowings through our committed and uncommitted revolving credit facilities, including our securitization facility with certain unaffiliated financial institutions and our repurchase facility. We fund certain of our long-term capital needs, primarily those related to acquisitions of property, plant and equipment, with cash flows from operations and by issuing long-term debt. See Note 6, Notes Payable and Long-Term Debt, of the notes to the unaudited condensed consolidated financial statements that are included in this Quarterly Report on Form 10-Q for additional information on our short-term borrowings and long-term debt. We will continue to consider opportunities to further diversify and enhance our sources and amounts of liquidity.
Summary of Our Major Uses of Cash and Cash Equivalents
The following is a summary of our primary cash requirements for fiscal 2024:
•Capital expenditures. We expect total capital expenditures for fiscal 2024 to be approximately $953.0 million compared to capital expenditures of $564.5 million in fiscal 2023. Increased capital expenditures for fiscal 2024 are for investments in our infrastructure to meet the evolving needs of our owners and customers, enhance value for the cooperative system and propel sustainable growth. During the six months ended February 29, 2024, we acquired $346.1 million of property, plant and equipment.
•Major maintenance. We expect total major maintenance for fiscal 2024 to be approximately $20.0 million compared to major maintenance of $217.4 million in fiscal 2023. Decreased major maintenance for fiscal 2024 is due to significantly reduced turnaround activities at our refineries compared to the turnaround at our Laurel refinery during fiscal 2023. During the six months ended February 29, 2024, we paid $10.7 million in major maintenance.
•Debt and interest. We expect to repay approximately $9.6 million of long-term debt and finance lease obligations and incur interest payments related to long-term debt of approximately $88.3 million during fiscal 2024. During the six months ended February 29, 2024, we repaid $4.5 million of scheduled long-term debt maturities and finance lease obligations.
•Preferred stock dividends. We had approximately $2.3 billion of preferred stock outstanding as of February 29, 2024. We expect to pay dividends on our preferred stock of approximately $168.7 million during fiscal 2024. Dividends paid on our preferred stock during the six months ended February 29, 2024, were $84.3 million.
•Patronage. Our Board of Directors has authorized approximately $365.0 million of our fiscal 2023 patronage-sourced earnings to be paid to our member-owners during fiscal 2024. During the six months ended February 29, 2024, we distributed $300.8 million of cash patronage related to the year ended August 31, 2023, with the remaining amount expected to be distributed in the third quarter of fiscal 2024.
•Equity redemptions. Our Board of Directors has authorized equity redemptions of up to $365.0 million to be distributed in fiscal 2024 in the form of redemptions of qualified and nonqualified equity owned by individual producer-members and association members. During the six months ended February 29, 2024, we redeemed $16.5 million of member equity.
We believe cash generated by operating and investing activities, along with available borrowing capacity under our credit facilities, will be sufficient to support our short- and long-term operations. Our notes payable and long-term debt are
42
subject to various restrictive requirements for maintenance of minimum consolidated net worth and other financial ratios. We were in compliance with all debt covenants and restrictions as of February 29, 2024. Based on our current fiscal 2024 projections, we expect continued covenant compliance.
Working Capital
We measure working capital as current assets less current liabilities as each amount appears on our condensed consolidated balance sheets. We believe this information is meaningful to investors as a measure of operational efficiency and short-term financial health. Working capital is not defined under U.S. generally accepted accounting principles ("U.S. GAAP") and may not be computed the same as similarly titled measures used by other companies. Working capital as of February 29, 2024, and August 31, 2023, was as follows:
| February 29, 2024 | August 31, 2023 | Change | |||||||||||||||
| (Dollars in thousands) | |||||||||||||||||
| Current assets | $ | $ | $ | 194,459 | |||||||||||||
| Less current liabilities | 8,144 | ||||||||||||||||
| Working capital | $ | 3,415,770 | $ | 3,229,455 | $ | 186,315 | |||||||||||
As of February 29, 2024, working capital increased by $186.3 million compared with August 31, 2023. Current asset balance changes increased working capital by $194.5 million, primarily driven by increases in inventories, supplier advance payments and receivables, which were partially offset by a decrease in our cash balance, all of which were driven by seasonality in our business. Current liability balance changes decreased working capital by $8.1 million, primarily due to increases in customer advance payments, which were also driven by seasonality in our business.
We finance our working capital needs through committed and uncommitted lines of credit with domestic and international banks. We believe our current cash balances and available capacity on our committed and uncommitted lines of credit will provide adequate liquidity to meet our working capital needs.
Contractual Obligations
For information regarding our estimated contractual obligations, see the MD&A discussion included in Item 7 of Part II of our Annual Report on Form 10-K for the year ended August 31, 2023. No material changes occurred during the six months ended February 29, 2024.
Cash Flows
The following table presents summarized cash flow data for the six months ended February 29, 2024, and February 28, 2023:
| Six Months Ended | |||||||||||||||||
| February 29, 2024 | February 28, 2023 | Change | |||||||||||||||
| (Dollars in thousands) | |||||||||||||||||
| Net cash (used in) provided by operating activities | $ | ( | $ | $ | (413,779) | ||||||||||||
| Net cash used in investing activities | ( | ( | 248,133 | ||||||||||||||
| Net cash (used in) provided by financing activities | ( | (653,447) | |||||||||||||||
| Effect of exchange rate changes on cash and cash equivalents | ( | ( | (2,575) | ||||||||||||||
| Decrease in cash and cash equivalents and restricted cash | $ | (1,135,288) | $ | (313,620) | $ | (821,668) | |||||||||||
Cash flows from operating activities can fluctuate significantly from period to period as a result of various factors, including seasonality and timing differences associated with purchases, sales, taxes and other business decisions. The $413.8 million increase in cash used in operating activities primarily reflects increased receivables and decreased net income during the first half of fiscal 2024 compared to the same period during fiscal 2023, which was partially offset by decreased inventories primarily due to market-driven price declines.
The $248.1 million decrease of cash used in investing activities reflects timing differences in borrowings and payments for CHS Capital notes receivable partially offset by higher acquisitions of property, plant and equipment during the first half of fiscal 2024, compared to the same period during fiscal 2023.
43
The $653.4 million decrease in cash provided by financing activities relative to the previous year primarily reflects decreased net cash inflows associated with our notes payable due to lower short-term funding needs resulting from decreased working capital needs and strong cash earnings. The decrease is partially offset by decreased cash outflows for patronage paid during the first half of fiscal 2024, compared to the same period during fiscal 2023.
Preferred Stock
The following is a summary of our outstanding preferred stock as of February 29, 2024 , all shares of which are listed on the Global Select Market of The Nasdaq Stock Market LLC:
| Nasdaq Symbol | Issuance Date | Shares Outstanding | Redemption Value | Net Proceeds (a) | Dividend Rate (b) (c) | Dividend Payment Frequency | Redeemable Beginning (d) | |||||||||||||||||||||||||||||||||||||||||||
| (Dollars in millions) | ||||||||||||||||||||||||||||||||||||||||||||||||||
| 8% Cumulative Redeemable | CHSCP | (e) | 12,272,003 | $ | 306.8 | $ | 311.2 | 8.00 | % | Quarterly | 7/18/2023 | |||||||||||||||||||||||||||||||||||||||
| Class B Cumulative Redeemable, Series 1 | CHSCO | (f) | 21,459,066 | $ | 536.5 | $ | 569.3 | 7.875 | % | Quarterly | 9/26/2023 | |||||||||||||||||||||||||||||||||||||||
| Class B Reset Rate Cumulative Redeemable, Series 2 | CHSCN | 3/11/2014 | 16,800,000 | $ | 420.0 | $ | 406.2 | 7.10 | % | Quarterly | 3/31/2024 | |||||||||||||||||||||||||||||||||||||||
| Class B Reset Rate Cumulative Redeemable, Series 3 | CHSCM | 9/15/2014 | 19,700,000 | $ | 492.5 | $ | 476.7 | 6.75 | % | Quarterly | 9/30/2024 | |||||||||||||||||||||||||||||||||||||||
| Class B Cumulative Redeemable, Series 4 | CHSCL | 1/21/2015 | 20,700,000 | $ | 517.5 | $ | 501.0 | 7.50 | % | Quarterly | 1/21/2025 | |||||||||||||||||||||||||||||||||||||||
(a) Includes patron equities redeemed with preferred stock.
(b) Class B Reset Rate Cumulative Redeemable Preferred Stock, Series 2 accumulates dividends at a rate of 7.10% per year until March 31, 2024, and then will fix at a rate of 7.10% based on the terms of the contract and application of the Adjustable Rate (LIBOR) Act.
(c) Class B Reset Rate Cumulative Redeemable Preferred Stock, Series 3 accumulates dividends at a rate of 6.75% per year until September 30, 2024, and then will fix at a rate of 6.75% based on the terms of the contract and application of the Adjustable Rate (LIBOR) Act.
(d) All series of preferred stock are redeemable for cash at our option, in whole or in part, at a per share price equal to the per share liquidation preference of $25.00 per share, plus all dividends accumulated and unpaid on that share to and including the date of redemption, beginning on the dates set forth in this column.
(e) The 8% Cumulative Redeemable Preferred Stock was issued at various times from 2002 through 2010.
(f) Shares of Class B Cumulative Redeemable Preferred Stock, Series 1 were issued on September 26, 2013, August 25, 2014, March 31, 2016, and March 30, 2017.
Critical Accounting Policies
Our critical accounting policies as presented in the MD&A in our Annual Report on Form 10-K for the year ended August 31, 2023, have not materially changed during the six months ended February 29, 2024.
Recent Accounting Pronouncements
Refer to Note 1, Basis of Presentation and Significant Accounting Policies, included in Item 1 of Part I of this Quarterly Report on Form 10-Q for a discussion of applicable standards issued and not yet adopted.
ITEM 3. QUANTITATIVE AND QUALITATIVE DISCLOSURES ABOUT MARKET RISK
We did not experience material changes in market risk exposures for the period ended February 29, 2024 , that would affect the quantitative and qualitative disclosures presented in our Annual Report on Form 10-K for the year ended August 31, 2023.
ITEM 4. CONTROLS AND PROCEDURES
Evaluation of Disclosure Controls and Procedures
Under the supervision and with the participation of our management, including our chief executive officer and chief financial officer, we evaluated the effectiveness of our disclosure controls and procedures (as defined in Rule 13a-15(e) under
44
the Securities Exchange Act of 1934) as of February 29, 2024 . Based on that evaluation, our chief executive officer and chief financial officer concluded that, as of that date, our disclosure controls and procedures were effective.
Changes in Internal Control Over Financial Reporting
There have been no changes in internal control over financial reporting during the quarter ended February 29, 2024 , that have materially affected or are reasonably likely to materially affect our internal control over financial reporting.
PART II. OTHER INFORMATION
ITEM 1. LEGAL PROCEEDINGS
For a description of our material pending legal proceedings, please see Note 13, Commitments and Contingencies, of the notes to the unaudited condensed consolidated financial statements that are included in this Quarterly Report on Form 10-Q.
ITEM 1A. RISK FACTORS
There have been no material changes from the risk factors disclosed in Item 1A of our Annual Report on Form 10-K for the year ended August 31, 2023.
ITEM 5. OTHER INFORMATION
On January 2, 2024, per the terms of our Class B Reset Rate Cumulative Redeemable Preferred Stock, Series 2 and Series 3, and the Adjustable Interest Rate (LIBOR) Act, the stated rates of 7.10% and 6.75%, respectively, were fixed at 7.10% and 6.75% (the "Fixed Rates"), respectively. We will pay dividends on Class B Reset Rate Cumulative Redeemable Preferred Stock, Series 2 after March 31, 2024, and on Class B Reset Rate Cumulative Redeemable Preferred Stock, Series 3 after September 30, 2024, at the Fixed Rates until they are redeemed.
ITEM 6. EXHIBITS
| Exhibit | Description | ||||
| Certification of the Chief Executive Officer Pursuant to Section 302 of the Sarbanes-Oxley Act of 2002. | |||||
| Certification of the Chief Financial Officer Pursuant to Section 302 of the Sarbanes-Oxley Act of 2002. | |||||
| Certification of the Chief Executive Officer Pursuant to 18 U.S.C. Section 1350, as Adopted Pursuant to Section 906 of the Sarbanes-Oxley Act of 2002. | |||||
| Certification of the Chief Financial Officer Pursuant to 18 U.S.C. Section 1350, as Adopted Pursuant to Section 906 of the Sarbanes-Oxley Act of 2002. | |||||
| 101.INS | XBRL Instance Document (The Instance Document does not appear in the Interactive Data File because its XBRL tags are embedded within the Inline XBRL document). | ||||
| 101.SCH | XBRL Taxonomy Extension Schema Document. | ||||
| 101.CAL | XBRL Taxonomy Extension Calculation Linkbase Document. | ||||
| 101.DEF | XBRL Taxonomy Extension Definition Linkbase Document. | ||||
| 101.LAB | XBRL Taxonomy Extension Labels Linkbase Document. | ||||
| 101.PRE | XBRL Taxonomy Extension Presentation Linkbase Document. | ||||
| 104 | Cover Page Interactive Data File (formatted as Inline XBRL and contained in Exhibit 101). | ||||
45
SIGNATURES
Pursuant to the requirements of the Securities Exchange Act of 1934, as amended, the registrant has duly caused this report to be signed on its behalf by the undersigned, thereunto duly authorized.
CHS Inc.
(Registrant)
| Date: | April 3, 2024 | By: | /s/ Olivia Nelligan | ||||||||||||||
| Olivia Nelligan | |||||||||||||||||
| Executive Vice President, Chief Financial Officer and Chief Strategy Officer | |||||||||||||||||
46