UNITED STATES
SECURITIES AND EXCHANGE COMMISSION
Washington, D.C. 20549
FORM
(Mark one)
QUARTERLY REPORT PURSUANT TO SECTION 13 OR 15(d) OF THE SECURITIES EXCHANGE ACT OF 1934 |
FOR THE QUARTERLY PERIOD ENDED
OR
TRANSITION REPORT PURSUANT TO SECTION 13 OR 15(d) OF THE SECURITIES EXCHANGE ACT OF 1934 |
Commission File Number
(Exact name of registrant as specified in its charter)
|
||
(State or other jurisdiction of incorporation or organization) |
(IRS Employer Identification No.) |

(Address of principal executive offices)
(
(Registrant’s telephone number, including area code)
Securities registered pursuant to Section 12(b) of the Act:
Title of each class |
Trading Symbol(s) |
Name of each exchange on which registered |
Indicate by check mark whether the registrant (1) has filed all reports required to be filed by Section 13 or 15(d) of the Securities Exchange Act of 1934 during the preceding 12 months (or for such shorter period that the registrant was required to file such reports), and (2) has been subject to such filing requirements for the past 90 days.
Indicate by check mark whether the registrant has submitted electronically, every Interactive Data File required to be submitted pursuant to Rule 405 of Regulation S-T (§232.405 of this chapter) during the preceding 12 months (or for such shorter period that the registrant was required to submit such files).
Indicate by check mark whether the registrant is a large accelerated filer, an accelerated filer, a non-accelerated filer, smaller reporting company, or an emerging growth company. See the definitions of “large accelerated filer”, “accelerated filer”, “smaller reporting company” and “emerging growth company” in Rule 12b-2 of the Exchange Act.
☑ |
|
Accelerated filer |
☐ |
Non-accelerated filer |
☐ |
|
Smaller reporting company |
|
Emerging growth company |
|
|
If an emerging growth company, indicate by check mark if the registrant has elected not to use the extended transition period for complying with any new or revised financial accounting standards provided pursuant to Section 13(a) of the Exchange Act. ☐
Indicate by check mark whether the registrant is a shell company (as defined in Rule 12b-2 of the Exchange Act). Yes ☐ No
As of April 12, 2024 the registrant had
PART I - FINANCIAL INFORMATION
Item 1. Financial Statements
NOV INC.
CONSOLIDATED BALANCE SHEETS
(In millions, except share data)
|
|
March 31, |
|
|
December 31, |
|
||
|
|
2024 |
|
|
2023 |
|
||
ASSETS |
|
(Unaudited) |
|
|
|
|
||
Current assets: |
|
|
|
|
|
|
||
Cash and cash equivalents |
|
$ |
|
|
$ |
|
||
Receivables, net |
|
|
|
|
|
|
||
Inventories, net |
|
|
|
|
|
|
||
Contract assets |
|
|
|
|
|
|
||
Prepaid and other current assets |
|
|
|
|
|
|
||
Total current assets |
|
|
|
|
|
|
||
Property, plant and equipment, net |
|
|
|
|
|
|
||
Lease right-of-use assets, operating |
|
|
|
|
|
|
||
Lease right-of-use assets, financing |
|
|
|
|
|
|
||
Deferred income taxes |
|
|
|
|
|
|
||
Goodwill |
|
|
|
|
|
|
||
Intangibles, net |
|
|
|
|
|
|
||
Investment in unconsolidated affiliates |
|
|
|
|
|
|
||
Other assets |
|
|
|
|
|
|
||
Total assets |
|
$ |
|
|
$ |
|
||
LIABILITIES AND STOCKHOLDERS' EQUITY |
|
|
|
|
|
|
||
Current liabilities: |
|
|
|
|
|
|
||
Accounts payable |
|
$ |
|
|
$ |
|
||
Accrued liabilities |
|
|
|
|
|
|
||
Contract liabilities |
|
|
|
|
|
|
||
Current portion of lease liabilities |
|
|
|
|
|
|
||
Current portion of long-term debt |
|
|
|
|
|
|
||
Accrued income taxes |
|
|
|
|
|
|
||
Total current liabilities |
|
|
|
|
|
|
||
Long-term debt |
|
|
|
|
|
|
||
Lease liabilities |
|
|
|
|
|
|
||
Deferred income taxes |
|
|
|
|
|
|
||
Other liabilities |
|
|
|
|
|
|
||
Total liabilities |
|
|
|
|
|
|
||
|
|
|
|
|
|
|||
Stockholders’ equity: |
|
|
|
|
|
|
||
Common stock - par value $ |
|
|
|
|
|
|
||
Additional paid-in capital |
|
|
|
|
|
|
||
Accumulated other comprehensive loss |
|
|
( |
) |
|
|
( |
) |
Retained deficit |
|
|
( |
) |
|
|
( |
) |
Total Company stockholders' equity |
|
|
|
|
|
|
||
Noncontrolling interests |
|
|
|
|
|
|
||
Total stockholders’ equity |
|
|
|
|
|
|
||
Total liabilities and stockholders’ equity |
|
$ |
|
|
$ |
|
||
See notes to unaudited consolidated financial statements.
2
NOV INC.
CONSOLIDATED STATEMENTS OF INCOME (UNAUDITED)
(In millions, except per share data)
|
|
Three Months Ended |
|
|||||
|
|
March 31, |
|
|||||
|
|
2024 |
|
|
2023 |
|
||
Revenue |
|
$ |
|
|
$ |
|
||
Cost of revenue |
|
|
|
|
|
|
||
Gross profit |
|
|
|
|
|
|
||
Selling, general and administrative |
|
|
|
|
|
|
||
Operating profit |
|
|
|
|
|
|
||
Interest and financial costs |
|
|
( |
) |
|
|
( |
) |
Interest income |
|
|
|
|
|
|
||
Equity income in unconsolidated affiliates |
|
|
|
|
|
|
||
Other expense, net |
|
|
( |
) |
|
|
( |
) |
Net income before income taxes |
|
|
|
|
|
|
||
Provision for income taxes |
|
|
|
|
|
|
||
Net income |
|
|
|
|
|
|
||
Net income (loss) attributable to noncontrolling interests |
|
|
|
|
|
( |
) |
|
Net income attributable to Company |
|
$ |
|
|
$ |
|
||
Net income attributable to Company per share: |
|
|
|
|
|
|
||
Basic |
|
$ |
|
|
$ |
|
||
Diluted |
|
$ |
|
|
$ |
|
||
Cash dividends per share |
|
$ |
|
|
$ |
|
||
Weighted average shares outstanding: |
|
|
|
|
|
|
||
Basic |
|
|
|
|
|
|
||
Diluted |
|
|
|
|
|
|
||
See notes to unaudited consolidated financial statements.
3
NOV INC.
CONSOLIDATED STATEMENTS OF COMPREHENSIVE INCOME (LOSS) (UNAUDITED)
(In millions)
|
|
Three Months Ended |
|
|||||
|
|
March 31, |
|
|||||
|
|
2024 |
|
|
2023 |
|
||
Net income |
|
$ |
|
|
$ |
|
||
Currency translation adjustments |
|
|
( |
) |
|
|
|
|
Changes in derivative financial instruments, net of tax |
|
|
- |
|
|
|
( |
) |
Changes in defined benefit plans, net of tax |
|
|
( |
) |
|
|
|
|
Comprehensive income |
|
|
|
|
|
|
||
Comprehensive income (loss) attributable to noncontrolling interest |
|
|
|
|
|
( |
) |
|
Comprehensive income attributable to Company |
|
$ |
|
|
$ |
|
||
See notes to unaudited consolidated financial statements.
4
NOV INC.
CONSOLIDATED STATEMENTS OF CASH FLOWS (UNAUDITED)
(In millions)
|
|
Three Months Ended |
|
|||||
|
|
March 31, |
|
|||||
|
|
2024 |
|
|
2023 |
|
||
Cash flows from operating activities: |
|
|
|
|||||
Net income |
|
$ |
|
|
$ |
|
||
Adjustments to reconcile net income to net cash used in |
|
|
|
|
|
|
||
Depreciation and amortization |
|
|
|
|
|
|
||
Provision for inventory losses |
|
|
— |
|
|
|
|
|
Deferred income taxes |
|
|
|
|
|
( |
) |
|
Equity income in unconsolidated affiliates |
|
|
( |
) |
|
|
( |
) |
Stock-based compensation |
|
|
|
|
|
|
||
Other, net |
|
|
|
|
|
( |
) |
|
Change in operating assets and liabilities, net of acquisitions: |
|
|
|
|
|
|
||
Receivables |
|
|
|
|
|
( |
) |
|
Inventories |
|
|
( |
) |
|
|
( |
) |
Contract assets |
|
|
( |
) |
|
|
|
|
Prepaid and other current assets |
|
|
( |
) |
|
|
( |
) |
Accounts payable |
|
|
( |
) |
|
|
|
|
Accrued liabilities |
|
|
( |
) |
|
|
( |
) |
Contract liabilities |
|
|
— |
|
|
|
( |
) |
Income taxes payable |
|
|
( |
) |
|
|
( |
) |
Other assets/liabilities, net |
|
|
|
|
|
|
||
Net cash used in operating activities |
|
$ |
( |
) |
|
$ |
( |
) |
|
|
|
|
|
|
|
||
Cash flows from investing activities: |
|
|
|
|
|
|
||
Purchases of property, plant and equipment |
|
|
( |
) |
|
|
( |
) |
Business acquisitions, net of cash acquired |
|
|
( |
) |
|
|
— |
|
Other |
|
|
|
|
|
|
||
Net cash used in investing activities |
|
$ |
( |
) |
|
$ |
( |
) |
|
|
|
|
|
|
|
||
Cash flows from financing activities: |
|
|
|
|
|
|
||
Borrowings against lines of credit and other debt |
|
|
|
|
|
|
||
Cash dividends paid |
|
|
( |
) |
|
|
( |
) |
Financing leases |
|
|
( |
) |
|
|
( |
) |
Other |
|
|
( |
) |
|
|
( |
) |
Net cash provided by (used in) financing activities |
|
|
|
|
|
( |
) |
|
Effect of exchange rates on cash |
|
|
( |
) |
|
|
— |
|
Decrease in cash and cash equivalents |
|
|
( |
) |
|
|
( |
) |
Cash and cash equivalents, beginning of period |
|
|
|
|
|
|
||
Cash and cash equivalents, end of period |
|
$ |
|
|
$ |
|
||
|
|
|
|
|
|
|
||
Supplemental disclosures of cash flow information: |
|
|
|
|
|
|
||
Cash payments during the period for: |
|
|
|
|
|
|
||
Interest |
|
$ |
|
|
$ |
|
||
Income taxes |
|
$ |
|
|
$ |
|
||
See notes to unaudited consolidated financial statements.
5
NOV INC.
CONSOLIDATED STATEMENTS OF STOCKHOLDERS’ EQUITY (UNAUDITED)
(In millions)
|
|
Shares Issued |
|
|
Common |
|
|
Additional |
|
|
Accumulated |
|
|
Retained |
|
|
Total |
|
|
Noncontrolling |
|
|
Total |
|
||||||||
Balance at December 31, 2023 |
|
|
|
|
$ |
|
|
$ |
|
|
$ |
( |
) |
|
$ |
( |
) |
|
$ |
|
|
$ |
|
|
$ |
|
||||||
Net income |
|
|
— |
|
|
|
— |
|
|
|
— |
|
|
|
— |
|
|
|
|
|
|
|
|
|
|
|
|
|
||||
Other comprehensive loss |
|
|
— |
|
|
|
— |
|
|
|
— |
|
|
|
( |
) |
|
|
— |
|
|
|
( |
) |
|
|
— |
|
|
|
( |
) |
Cash dividends, $ |
|
|
— |
|
|
|
— |
|
|
|
— |
|
|
|
— |
|
|
|
( |
) |
|
|
( |
) |
|
|
— |
|
|
|
( |
) |
Transactions with non-controlling interests |
|
|
— |
|
|
|
— |
|
|
|
|
|
|
— |
|
|
|
— |
|
|
|
|
|
|
( |
) |
|
|
— |
|
||
Stock-based compensation |
|
|
— |
|
|
|
— |
|
|
|
|
|
|
— |
|
|
|
— |
|
|
|
|
|
|
— |
|
|
|
|
|||
Common stock issued |
|
|
|
|
|
— |
|
|
|
— |
|
|
|
— |
|
|
|
— |
|
|
|
— |
|
|
|
— |
|
|
|
— |
|
|
Withholding taxes |
|
|
( |
) |
|
|
— |
|
|
|
( |
) |
|
|
— |
|
|
|
— |
|
|
|
( |
) |
|
|
— |
|
|
|
( |
) |
Other |
|
|
— |
|
|
|
— |
|
|
|
|
|
|
— |
|
|
|
— |
|
|
|
|
|
|
— |
|
|
|
|
|||
Balance at March 31, 2024 |
|
|
|
|
$ |
|
|
$ |
|
|
$ |
( |
) |
|
$ |
( |
) |
|
$ |
|
|
$ |
|
|
$ |
|
||||||
|
|
Shares Issued |
|
|
Common |
|
|
Additional |
|
|
Accumulated |
|
|
Retained |
|
|
Total |
|
|
Noncontrolling |
|
|
Total |
|
||||||||
Balance at December 31, 2022 |
|
|
|
|
$ |
|
|
$ |
|
|
$ |
( |
) |
|
$ |
( |
) |
|
$ |
|
|
$ |
|
|
$ |
|
||||||
Net income |
|
|
— |
|
|
|
— |
|
|
|
— |
|
|
|
— |
|
|
|
|
|
|
|
|
|
( |
) |
|
|
|
|||
Other comprehensive income, net |
|
|
— |
|
|
|
— |
|
|
|
— |
|
|
|
|
|
|
— |
|
|
|
|
|
|
— |
|
|
|
|
|||
Cash dividends, $ |
|
|
— |
|
|
|
— |
|
|
|
— |
|
|
|
— |
|
|
|
( |
) |
|
|
( |
) |
|
|
— |
|
|
|
( |
) |
Transactions with non-controlling interests |
|
|
— |
|
|
|
— |
|
|
|
|
|
|
— |
|
|
|
— |
|
|
|
|
|
|
|
|
|
|
||||
Stock-based compensation |
|
|
— |
|
|
|
— |
|
|
|
|
|
|
— |
|
|
|
— |
|
|
|
|
|
|
— |
|
|
|
|
|||
Common stock issued |
|
|
|
|
|
— |
|
|
|
— |
|
|
|
— |
|
|
|
— |
|
|
|
- |
|
|
|
— |
|
|
|
— |
|
|
Withholding taxes |
|
|
( |
) |
|
|
— |
|
|
|
( |
) |
|
|
— |
|
|
|
— |
|
|
|
( |
) |
|
|
— |
|
|
|
( |
) |
Other |
|
|
— |
|
|
|
— |
|
|
|
|
|
|
— |
|
|
|
— |
|
|
|
|
|
|
— |
|
|
|
|
|||
Balance at March 31, 2023 |
|
|
|
|
$ |
|
|
$ |
|
|
$ |
( |
) |
|
$ |
( |
) |
|
$ |
|
|
$ |
|
|
$ |
|
||||||
See notes to unaudited consolidated financial statements.
6
NOV INC.
Notes to Consolidated Financial Statements (Unaudited)
1. Basis of Presentation
The accompanying unaudited consolidated financial statements of NOV Inc. (“NOV” or the “Company”) present information in accordance with generally accepted accounting principles in the United States (“GAAP”) for interim financial information and the instructions to Form 10-Q and applicable rules of Regulation S-X. They do not include all information or footnotes required by GAAP for complete consolidated financial statements and should be read in conjunction with the audited consolidated financial statements and footnotes included in the Company’s 2023 Annual Report on Form 10-K. Certain reclassifications have been made to prior period financial information in order to conform with current period presentation.
In our opinion, the consolidated financial statements include all adjustments, which are of a normal recurring nature unless otherwise disclosed, necessary for a fair presentation of the results for the interim periods. The results of operations for the three months ended March 31, 2024 are not necessarily indicative of the results to be expected for the full year.
The preparation of financial statements in conformity with GAAP requires management to make estimates and assumptions that affect reported and contingent amounts of assets and liabilities as of the date of the financial statements and reported amounts of revenues and expenses during the reporting period. Actual results could differ from those estimates.
The fair values of cash and cash equivalents, receivables and payables were approximately the same as their presented carrying values because of the short maturities of these instruments. The fair value of long-term debt is provided in Note 9, and the fair values of derivative financial instruments are provided in Note 12.
2. Inventories, net
Inventories consist of (in millions):
|
|
March 31, |
|
|
December 31, |
|
||
|
|
2024 |
|
|
2023 |
|
||
Raw materials and supplies |
|
$ |
|
|
$ |
|
||
Work in process |
|
|
|
|
|
|
||
Finished goods and purchased products |
|
|
|
|
|
|
||
|
|
|
|
|
|
|
||
Less: Inventory reserve |
|
|
( |
) |
|
|
( |
) |
Total |
|
$ |
|
|
$ |
|
||
3. Accrued Liabilities
Accrued liabilities consist of (in millions):
|
|
March 31, |
|
|
December 31, |
|
||
|
|
2024 |
|
|
2023 |
|
||
Compensation |
|
$ |
|
|
$ |
|
||
Vendor costs |
|
|
|
|
|
|
||
Taxes (non-income) |
|
|
|
|
|
|
||
Warranties |
|
|
|
|
|
|
||
Insurance |
|
|
|
|
|
|
||
Commissions |
|
|
|
|
|
|
||
Fair value of derivatives |
|
|
|
|
|
|
||
Interest |
|
|
|
|
|
|
||
Other |
|
|
|
|
|
|
||
Total |
|
$ |
|
|
$ |
|
||
7
4. Accumulated Other Comprehensive Loss
The components of accumulated other comprehensive loss are as follows (in millions):
|
|
|
|
|
Derivative |
|
|
Employee |
|
|
|
|
||||
|
|
Currency |
|
|
Financial |
|
|
Benefit |
|
|
|
|
||||
|
|
Translation |
|
|
Instruments, |
|
|
Plans, |
|
|
|
|
||||
|
|
Adjustments |
|
|
Net of Tax |
|
|
Net of Tax |
|
|
Total |
|
||||
Balance at December 31, 2023 |
|
$ |
( |
) |
|
$ |
( |
) |
|
$ |
( |
) |
|
$ |
( |
) |
Accumulated other comprehensive loss before |
|
|
( |
) |
|
|
( |
) |
|
|
( |
) |
|
|
( |
) |
Amounts reclassified from accumulated other comprehensive |
|
|
— |
|
|
|
|
|
|
— |
|
|
|
|
||
Balance at March 31, 2024 |
|
$ |
( |
) |
|
$ |
( |
) |
|
$ |
( |
) |
|
$ |
( |
) |
The components of amounts reclassified from accumulated other comprehensive loss are as follows (in millions):
|
Three Months Ended March 31, |
|
||||||||||||||||||||||||||||||
|
2024 |
|
|
2023 |
|
|||||||||||||||||||||||||||
|
|
Currency |
|
|
Derivative |
|
|
Employee |
|
|
|
|
|
Currency |
|
|
Derivative |
|
|
Employee |
|
|
|
|
||||||||
|
|
Translation |
|
|
Financial |
|
|
Benefit |
|
|
|
|
|
Translation |
|
|
Financial |
|
|
Benefit |
|
|
|
|
||||||||
|
|
Adjustments |
|
|
Instruments |
|
|
Plans |
|
|
Total |
|
|
Adjustments |
|
|
Instruments |
|
|
Plans |
|
|
Total |
|
||||||||
Revenue |
|
$ |
— |
|
|
$ |
|
|
$ |
— |
|
|
$ |
|
|
$ |
— |
|
|
$ |
|
|
$ |
— |
|
|
$ |
|
||||
Cost of revenue |
|
|
— |
|
|
|
|
|
|
— |
|
|
|
|
|
|
— |
|
|
|
|
|
|
— |
|
|
|
|
||||
Other expense |
|
|
— |
|
|
|
— |
|
|
|
— |
|
|
|
— |
|
|
|
|
|
|
— |
|
|
|
— |
|
|
|
|
||
Selling, general and administrative |
|
|
— |
|
|
|
— |
|
|
|
— |
|
|
|
— |
|
|
|
— |
|
|
|
— |
|
|
|
|
|
|
|
||
Tax effect |
|
|
— |
|
|
|
— |
|
|
|
— |
|
|
|
— |
|
|
|
— |
|
|
|
— |
|
|
|
— |
|
|
|
— |
|
|
|
$ |
— |
|
|
$ |
|
|
$ |
— |
|
|
$ |
|
|
$ |
|
|
$ |
|
|
$ |
|
|
$ |
|
||||||
The Company’s reporting currency is the U.S. dollar. A majority of the Company’s international entities in which there is a substantial investment have the local currency as their functional currency. As a result, currency translation adjustments resulting from the process of translating the entities’ financial statements into the reporting currency are reported in other comprehensive income (loss).
The effect of changes in the fair values of derivatives designated as cash flow hedges are accumulated in other comprehensive income (loss), net of tax, until the underlying transactions are realized. The movement in other comprehensive income (loss) from period to period will be the combination of: 1) changes in fair value of open derivatives of ($
8
5. Segments
Effective January 1, 2024, NOV consolidated its reporting structure into
Financial results by operating segment are as follows (in millions):
|
|
Three Months Ended |
|
|||||
|
|
March 31, |
|
|||||
|
|
2024 |
|
|
2023 |
|
||
Revenue: |
|
|
|
|
|
|
||
Energy Products and Services |
|
$ |
|
|
$ |
|
||
Energy Equipment |
|
|
|
|
|
|
||
Eliminations |
|
|
( |
) |
|
|
( |
) |
Total revenue |
|
$ |
|
|
$ |
|
||
|
|
|
|
|
|
|
||
Operating profit: |
|
|
|
|
|
|
||
Energy Products and Services |
|
$ |
|
|
$ |
|
||
Energy Equipment |
|
|
|
|
|
|
||
Eliminations and corporate costs |
|
|
( |
) |
|
|
( |
) |
Total operating profit |
|
$ |
|
|
$ |
|
||
Sales from one segment to another generally are priced at estimated equivalent commercial selling prices; however, segments originating an external sale are credited with the full profit to the Company. Eliminations include intercompany transactions conducted between the
Total other items included in operating profit for the three months ended March 31, 2024 and March 31, 2023, were a pre-tax credit of $
6. Business Combinations
During the first quarter of 2024, our Energy Products and Services segment made
At March 31, 2024, we provisionally recorded $
9
7. Revenue
Disaggregation of Revenue
The following table disaggregates the Company’s revenue by major geographic and market segment destination. In the table, North America includes the U.S. and Canada (in millions):
|
|
Three Months Ended March 31, |
|
|||||||||||||||||||||||||||||
|
|
2024 |
|
|
2023 |
|
||||||||||||||||||||||||||
|
|
Energy |
|
|
|
|
|
|
|
|
|
|
|
Energy |
|
|
|
|
|
|
|
|
|
|
||||||||
|
|
Products |
|
|
Energy |
|
|
|
|
|
|
|
|
Products |
|
|
Energy |
|
|
|
|
|
|
|
||||||||
|
|
and Services |
|
|
Equipment |
|
|
Elims. |
|
|
Total |
|
|
and Services |
|
|
Equipment |
|
|
Elims. |
|
|
Total |
|
||||||||
North America |
|
$ |
|
|
$ |
|
|
$ |
— |
|
|
$ |
|
|
$ |
|
|
$ |
|
|
$ |
— |
|
|
$ |
|
||||||
International |
|
|
|
|
|
|
|
|
— |
|
|
|
|
|
|
|
|
|
|
|
|
— |
|
|
|
|
||||||
Eliminations |
|
|
|
|
|
|
|
|
( |
) |
|
|
— |
|
|
|
|
|
|
|
|
|
( |
) |
|
|
— |
|
||||
|
|
$ |
|
|
$ |
|
|
$ |
( |
) |
|
$ |
|
|
$ |
|
|
$ |
|
|
$ |
( |
) |
|
$ |
|
||||||
|
|
|
|
|
|
|
|
|
|
|
|
|
|
|
|
|
|
|
|
|
|
|
|
|
||||||||
Land |
|
$ |
|
|
$ |
|
|
$ |
— |
|
|
$ |
|
|
$ |
|
|
$ |
|
|
$ |
— |
|
|
$ |
|
||||||
Offshore |
|
|
|
|
|
|
|
|
— |
|
|
|
|
|
|
|
|
|
|
|
|
— |
|
|
|
|
||||||
Eliminations |
|
|
|
|
|
|
|
|
( |
) |
|
|
— |
|
|
|
|
|
|
|
|
|
( |
) |
|
|
— |
|
||||
|
|
$ |
|
|
$ |
|
|
$ |
( |
) |
|
$ |
|
|
$ |
|
|
$ |
|
|
$ |
( |
) |
|
$ |
|
||||||
Performance Obligations
Net revenue recognized from performance obligations satisfied in previous periods was $
Remaining performance obligations represent the transaction price of firm orders for all revenue streams for which work has not been performed on contracts with original expected duration of one year or more. We do not disclose the remaining performance obligations of royalty contracts, service contracts for which there is a right to invoice, and short-term contracts that are expected to have a duration of one year or less. As of March 31, 2024, the aggregate amount of the transaction price allocated to remaining performance obligations was $
Contract Assets and Liabilities
Contract assets include unbilled amounts when revenue recognized exceeds the amount billed to the customer under contracts where revenue is recognized over time. Contract liabilities consist of customer billings in excess of revenue recognized under over-time contracts, customer advance payments and deferred revenue.
The changes in the carrying amount of contract assets and contract liabilities are as follows (in millions):
|
|
Contract |
|
|
Contract |
|
||
Balance at December 31, 2023 |
|
$ |
|
|
$ |
|
||
Billings |
|
|
( |
) |
|
|
|
|
Revenue recognized |
|
|
|
|
|
( |
) |
|
Currency translation adjustments and other |
|
|
( |
) |
|
|
( |
) |
Balance at March 31, 2024 |
|
$ |
|
|
$ |
|
||
Royalty Revenue
The Company recognizes royalty revenue due under various licenses for the Company's intellectual property, including for technology related to drill bits. The Company recognized revenue for drill bit licenses of approximately $
10
to which it is entitled pursuant to the terms of the licensing agreements, the Company will also continue to evaluate the credit quality of the receivables. See Note 15 for discussion of the ongoing litigation.
Allowance for Credit Losses
The Company estimates its allowance for credit losses using information about past events, current conditions and risk characteristics of each customer, and reasonable and supportable forecasts relevant to assessing risk associated with the collectability of receivables and contract assets. The Company’s customer base, mostly in the oil and gas industry, have generally similar collectability risk characteristics, although larger and state-owned customers may have lower risk than smaller independent customers. As of March 31, 2024, the allowance for credit losses totaled $
The changes in the carrying amount of the allowance for credit losses are as follows (in millions):
Balance at December 31, 2023 |
|
$ |
|
|
Provision for expected credit losses |
|
|
|
|
Recoveries collected |
|
|
( |
) |
Other |
|
|
( |
) |
Balance at March 31, 2024 |
|
$ |
|
11
8. Leases
The Company leases certain facilities and equipment to support its operations around the world. These leases generally require the Company to pay maintenance, insurance, taxes and other operating costs in addition to rent. Renewal options are common in longer term leases; however, it is rare that the Company initially intends that a lease option will be exercised due to the cyclical nature of the Company’s business. Residual value guarantees are not typically part of the Company’s leases. Occasionally, the Company sub-leases excess facility space, generally at terms similar to the source lease. The Company reviews agreements at inception to determine if they include a lease and, when they do, uses its incremental borrowing rate to determine the present value of the future lease payments as most do not include implicit interest rates.
Components of leases are as follows (in millions):
|
|
March 31, |
|
|
December 31, |
|
||
|
|
2024 |
|
|
2023 |
|
||
Current portion of lease liabilities: |
|
|
|
|
|
|
||
|
$ |
|
|
$ |
|
|||
|
|
|
|
|
|
|||
Total |
|
$ |
|
|
$ |
|
||
|
|
|
|
|
|
|
||
|
|
March 31, |
|
|
December 31, |
|
||
|
|
2024 |
|
|
2023 |
|
||
Long-term portion of lease liabilities: |
|
|
|
|
|
|
||
|
$ |
|
|
$ |
|
|||
|
|
|
|
|
|
|||
Total |
|
$ |
|
|
$ |
|
||
12
9. Debt
Debt consists of (in millions):
|
|
March 31, |
|
|
December 31, |
|
||
|
|
2024 |
|
|
2023 |
|
||
$ |
|
$ |
|
|
$ |
|
||
$ |
|
|
|
|
|
|
||
Other debt |
|
|
|
|
|
|
||
Total Debt |
|
|
|
|
|
|
||
Less current portion |
|
|
|
|
|
|
||
Long-term debt |
|
$ |
|
|
$ |
|
||
The Company has a revolving credit facility with a borrowing capacity of $
A consolidated joint venture of the Company borrowed $
Other debt at March 31, 2024 included $
The Company had $
At March 31, 2024 and December 31, 2023, the fair value of the Company’s unsecured Senior Notes approximated $
13
10. Income Taxes
The effective tax rate for the three months ended March 31, 2024 was
11. Stock-Based Compensation
The Company’s stock-based compensation plan, known as the NOV Inc. Long-Term Incentive Plan (the “NOV Plan”), was approved by shareholders on May 11, 2018 and amended and restated on May 24, 2022. The NOV Plan provides for the granting of stock options, restricted stock, restricted stock units, performance awards, phantom shares, stock appreciation rights, stock payments and substitute awards. The number of shares authorized under the NOV Plan is
On February 6, 2024, under the NOV Plan, the Company granted
Total expense for all stock-based compensation arrangements was $
There was an income tax benefit of $
14
12. Derivative Financial Instruments
The Company uses forward currency contracts to manage the foreign currency exchange rate risk on forecasted revenues and expenses denominated in currencies other than the functional currency of the operating unit (cash flow hedge). The Company also executes forward currency contracts to manage the foreign currency exchange rate risk on recognized nonfunctional currency monetary accounts (non-designated hedge).
The fair values of these derivative financial instruments are determined using level 2 inputs (inputs other than quoted prices in active markets for identical assets and liabilities that are observable either directly or indirectly for substantially the full term of the asset or liability) in the fair value hierarchy as the fair value is based on publicly available foreign exchange and interest rates at each financial reporting date.
Forward currency contracts consist of (in millions):
|
|
Currency Denomination |
|
|||||||
|
|
March 31, |
|
|
December 31, |
|
||||
Currency |
|
2024 |
|
|
2023 |
|
||||
Colombian Peso |
|
COP |
|
|
|
COP |
|
|
||
South Korean Won |
|
KRW |
|
|
|
KRW |
|
|
||
Norwegian Krone |
|
NOK |
|
|
|
NOK |
|
|
||
Japanese Yen |
|
JPY |
|
|
|
JPY |
|
|
||
U.S. Dollar |
|
USD |
|
|
|
USD |
|
|
||
Brazilian Real |
|
BRL |
|
|
|
BRL |
|
|
||
Mexican Peso |
|
MXN |
|
|
|
MXN |
|
|
||
Euro |
|
EUR |
|
|
|
EUR |
|
|
||
Singapore Dollar |
|
SGD |
|
|
|
SGD |
|
|
||
South African Rand |
|
ZAR |
|
|
|
ZAR |
|
|
||
British Pound Sterling |
|
GBP |
|
|
|
GBP |
|
|
||
Danish Krone |
|
DKK |
|
|
|
DKK |
|
|
||
Canadian Dollar |
|
CAD |
|
|
|
CAD |
|
|
||
Cash Flow Hedging Strategy
To protect against the volatility of forecasted foreign currency cash flows resulting from forecasted revenues and expenses, the Company instituted a cash flow hedging program. For derivative instruments that are designated and qualify as a cash flow hedge, the gain or loss on the derivative instrument is recorded in accumulated other comprehensive income (loss) and reclassified into earnings in the same line item associated with the forecasted transaction and in the same period or periods during which the hedged transaction affects earnings (e.g., in “revenues” when the hedged transactions are cash flows associated with forecasted revenues). The Company includes time value in hedge relationships.
The Company expects accumulated other comprehensive income of $
Non-designated Hedging Strategy
The Company enters into forward exchange contracts to hedge certain nonfunctional currency monetary accounts. The gain or loss on the derivative instrument is recognized in earnings in other income (expense), together with the changes in the hedged nonfunctional monetary accounts.
The amount of loss recognized in other expense, net was $
15
The Company has the following fair values of its derivative instruments and their balance sheet classifications (in millions):
|
|
Asset Derivatives |
|
|
Liability Derivatives |
|
||||||||||||||
|
|
|
|
Fair Value |
|
|
|
|
Fair Value |
|
||||||||||
|
|
Balance Sheet |
|
March 31, |
|
|
December 31, |
|
|
Balance Sheet |
|
March 31, |
|
|
December 31, |
|
||||
|
|
Location |
|
2024 |
|
|
2023 |
|
|
Location |
|
2024 |
|
|
2023 |
|
||||
|
|
|
|
|
|
|
|
|
|
|
|
|
|
|
|
|
||||
Derivatives designated as hedging |
|
|
|
|
|
|
|
|
|
|
|
|
|
|
|
|
||||
Foreign exchange contracts |
|
Prepaid and other |
|
$ |
— |
|
|
$ |
|
|
Accrued liabilities |
|
$ |
|
|
$ |
|
|||
Foreign exchange contracts |
|
Other assets |
|
|
— |
|
|
|
— |
|
|
Other |
|
|
— |
|
|
|
|
|
Total derivatives designated as hedging |
|
|
|
$ |
— |
|
|
$ |
|
|
|
|
$ |
|
|
$ |
|
|||
Derivatives not designated as hedging |
|
|
|
|
|
|
|
|
|
|
|
|
|
|
|
|
||||
Foreign exchange contracts |
|
Prepaid and other |
|
$ |
|
|
$ |
|
|
Accrued liabilities |
|
$ |
|
|
$ |
|
||||
Foreign exchange contracts |
|
Other assets |
|
|
— |
|
|
|
— |
|
|
Other |
|
|
— |
|
|
|
|
|
Total derivatives not designated as |
|
|
|
$ |
|
|
$ |
|
|
|
|
$ |
|
|
$ |
|
||||
Total derivatives |
|
|
|
$ |
|
|
$ |
|
|
|
|
$ |
|
|
$ |
|
||||
16
13. Net Income Attributable to Company Per Share
The following table sets forth the computation of weighted average basic and diluted shares outstanding (in millions, except per share data):
|
Three Months Ended |
|
|||||
|
March 31, |
|
|||||
|
2024 |
|
|
2023 |
|
||
Numerator: |
|
|
|
|
|
||
Net income attributable to Company |
$ |
|
|
$ |
|
||
Denominator: |
|
|
|
|
|
||
Basic—weighted average common shares outstanding |
|
|
|
|
|
||
Dilutive effect of employee stock options and other |
|
|
|
|
|
||
Diluted outstanding shares |
|
|
|
|
|
||
|
|
|
|
|
|
||
Net income attributable to Company per share: |
|
|
|
|
|
||
Basic |
$ |
|
|
$ |
|
||
Diluted |
$ |
|
|
$ |
|
||
|
|
|
|
|
|
||
Cash dividends per share |
$ |
|
|
$ |
|
||
Companies with unvested participating securities are required to utilize a two-class method for the computation of net income attributable to Company per share. The two-class method requires a portion of net income attributable to Company to be allocated to participating securities, which are unvested awards of share-based payments with non-forfeitable rights to receive dividends or dividend equivalents if declared. Net income attributable to the Company allocated to these participating securities was immaterial for each of the three months ended March 31, 2024 and 2023, respectively.
The Company had stock options outstanding that were anti-dilutive totaling
14. Cash Dividends
Cash dividends were $
15. Commitments and Contingencies
Our business is governed by laws and regulations, including those directed to the oilfield service industry, promulgated by U.S. federal and state governments and regulatory agencies, as well as international governmental authorities in the many countries in which we conduct business. In the United States these governmental authorities include the U.S. Department of Labor, the Occupational Safety and Health Administration, the Environmental Protection Agency, the Bureau of Land Management, the Department of Treasury, Office of Foreign Asset Controls, state environmental agencies and many others. We are unaware of any material liabilities in connection with our compliance with such laws. New laws, investigations, regulations and enforcement policies may result in additional, presently unquantifiable, or unknown, costs or liabilities.
From time to time, the Company is involved in various claims, regulatory agency audits, investigations and legal actions involving a variety of matters. The Company maintains insurance that covers claims such as third-party personal injuries or property damage arising from risks associated with the business activities of the Company, such as premises liability, product liability, personal injury, marine risk, property damage, and other such insurable losses. The Company carries substantial insurance to cover insurable risks above a self-insured retention. The Company believes, and the Company’s experience has been, that such insurance has been sufficient to cover any such material risks.
The Company is also a party to claims, threatened and actual litigation, arbitration, and internal investigations of potential regulatory and compliance matters which may arise from the Company’s business activities. These regulatory matters and disputes may involve private parties and/or government authorities who may assert a broad variety of potential claims against the Company, such as employment law claims, collective actions or class action claims, intellectual property claims (such as alleged patent infringement, and/or misappropriation of trade secrets by the company), premises liability claims, environmental claims, product liability claims, warranty claims, personal injury claims arising from exposure to or use of allegedly defective products or from activities of the Company, alleged regulatory violations, alleged violations of anti-corruption and anti-bribery, trade, customs or other laws and other commercial
17
and/or regulatory claims seeking recovery for alleged actual or exemplary damages or fines and penalties. Such claims involve various theories of liability which may include negligence, breach of contract, strict liability, product liability, and other theories of liability. For some of these contingent claims and potential liabilities, the Company’s insurance coverage may not apply, or exclusions to coverage or legal impediments may apply. In such instances, settlement or other resolution of such claims, individually or collectively, could have a material financial or reputational impact on the Company. As of March 31, 2024, the Company recorded reserves in an amount believed to be sufficient, given the estimated range of potential outcomes, for contingent liabilities believed to be probable. These reserves include costs currently and reasonably estimated to be incurred for reclamation of a closed barite mine and product liability claims, as well as other circumstances involving material claims.
The Company periodically assesses the potential for losses above the amounts accrued as well as potential losses for matters that are believed to be not probable, but which are reasonably possible. The Company sets accruals in accordance with GAAP based on its best judgment about the probable results of disputed claims, regulatory enforcement actions, tax and other governmental audits, and other contingencies. The litigation process and the outcome of regulatory oversight is inherently uncertain, and our best judgment concerning the probable outcome of litigation or regulatory enforcement matters may prove to be incorrect. No assurance can be given as to the outcome of these matters. The total potential loss on these matters cannot be determined; however, in our opinion, any ultimate liability, to the extent not otherwise provided for, will not materially affect our financial position, cash flow or results of operations. These estimated liabilities are based on the Company’s assessment of the nature of these matters, their progress toward resolution, the advice of legal counsel and outside experts as well as management’s experience. Because of the uncertainty and risk inherent to litigation, arbitration, audits, governmental investigations, enforcement actions, and similar matters, the Company’s actual liabilities incurred may materially exceed our estimated liabilities and reserves, which could have a material financial or reputational impact on the Company.
In many instances, the Company’s products and services embody or incorporate trade secrets or patented inventions. From time to time, we are engaged in disputes concerning protection of the Company’s trade secrets and confidential information, patents, and other intellectual property rights. Such disputes frequently involve complex, factual, technical and/or legal issues which result in high costs to adjudicate our rights and for which it may be difficult to predict the ultimate outcome. At any given time, the Company may be a plaintiff or defendant in disputes involving disputed intellectual property rights.
The Company is currently pursuing litigation against several companies involving royalties due under licenses for technology related to drill bits. This technology resulted in a portfolio of patents related to leaching technology, a revolutionary technology owned by the Company that improves the performance of drill bits and other products utilizing certain synthetic diamond parts. The Company previously sued several drill bit manufacturers for patent infringement and those lawsuits were resolved by a series of licensing agreements with various drill bit manufacturers. To settle and end litigation or to avoid litigation, the licensees were provided access to the portfolio of leaching patents owned by the Company in exchange for a royalty payment, as defined in each license agreement. The companies agreed to pay the royalties for the right to use the portfolio of patents, whether they used some, all or none of the specific patented claims in any particular patent. The license agreements each provide that they terminate on the date of the last to expire of the patents in the licensed portfolio. Having obtained the benefit of these licenses for more than a decade, all of the drill bit manufacturer licensees unilaterally stopped making royalty payments even though all of the patents in the portfolio have not expired. These companies have asserted, among other reasons, that they are entitled to stop making these payments because they have not elected to manufacture products covered by the unexpired patents. Some of these companies stopped making payments after the expiration of what are allegedly the patents in the portfolio that they elected to use. Others paid for some period of time after that date but have since stopped payment. The Company has sued asserting that failure to pay the royalties is a breach of the license agreements at issue. The Company is in litigation with most of the licensees seeking a judicial determination that it is entitled to be paid royalties pursuant to the terms of the licenses. The parties’ legal filings to date can be found in two cases currently pending in the United States District Court for the Southern District of Texas: Grant Prideco, Inc., et al. v. Schlumberger Tech. Corp., et al., No. 4:23-cv-00730; and Halliburton Energy Serv, Inc. v. Grant Prideco, Inc., et al., No. 4:23-cv-01789. While the Company strongly believes that the royalties for which it has sued are due and owing pursuant to the terms of the licensing agreements, there is inherent risk with the related litigation and the Company makes no assurances as to the outcome of such litigation. See Note 7 to the Consolidated Financial Statements for discussion of the financial impact of royalties.
The protection of intellectual property is important to the Company’s performance, and as such, an adverse result in disputes related to our intellectual property could result in materially adverse financial consequences such as a decline in sales of products protected by patents, which could materially and adversely impact our financial performance.
From time-to-time purchasers of our products and services or members of our supply chain or sales chain become involved in litigation, governmental investigations, internal investigations, political or other enforcement matters, or other dispute proceedings. In such circumstances, such proceedings may adversely impact the ability of purchasers of our products, entities providing financial support to such consumers or entities in the supply chain or sales chain to timely perform their business plans or to timely perform under agreements with us. We may, from time to time, become involved in these proceedings, at substantial cost to the Company.
The Company is exposed to customs and trade regulation risk in the countries in which we do business and countries from which or to which we import or export goods. Such trade regulations can be complex and conflicting, as different countries use trade regulation to promote conflicting policy objectives. Compliance with these laws and regulations presents challenges which could result in future
18
liabilities (for example, alleged violation of those laws or when laws conflict between countries). The Company may face increased tariffs and trade costs, loss of revenue, loss of customers, fines, penalties, increased costs, the need for renegotiation of agreements, and other business disruptions. Trade regulations, supply chain regulations, and other regulatory compliance in different jurisdictions may conflict with one another or with contractual terms with our various counterparties. In such circumstances, our compliance with U.S. laws and regulations may subject us to risk of fines, penalties, or contractual liability in other jurisdictions. Our efforts to actively manage such risks may not always be successful and this could lead to negative impacts on revenue or earnings. In addition, trade regulations, export controls, and other laws adversely impact our ability to do business in certain countries, e.g., Iran, Syria, Russia, China and Venezuela.
In response to additional sanctions enacted by governments in the European Union, the United States, the United Kingdom, Switzerland, and other countries regarding the armed conflict in Ukraine, we ceased new investments in Russia and have curtailed our activities there. During the third quarter of 2022, we sold our business in Belarus and entered into an agreement to sell our business in Russia. The sale is subject to various government approvals in Russia and other jurisdictions. The Russian government continues to enact new laws impacting the exit of western companies from Russia, including some instances of expropriation of western businesses. We may incur additional costs as a result of conditions in Russia if we are unable to complete the transaction to sell our Russian business on the terms of the agreements.
Geopolitical events continue to pose supply chain risks. The Company’s ability to manufacture equipment and perform services could be impaired from such disruptions and the Company could be exposed to liabilities resulting from additional interruption or delay in its ability to perform due to factors such as materials shortages, inflationary pressures, and limited manpower. We may face loss of workers, labor shortages, litigation, fines and/or other adverse consequences resulting from ongoing labor impacts. The combined impact of supply chain and labor market disruptions along with the inflationary impacts of pandemic monetary and regulatory policies could have material adverse impacts on our financial results.
Disputes may arise regarding application of force majeure and other contract provisions concerning allocation of responsibility among customers, the Company, and suppliers, resulting in material added cost and/or litigation. Our customers may attempt to cancel or delay projects, cancel contracts, or may invoke force majeure clauses. Our customers may also seek to delay or may default on their payments to us. As a result, the Company may be exposed to additional costs, liabilities and risks which could materially adversely impact our financial performance and results. These potential operational and service delays could result in contractual or other legal claims from our customers. At this time, it is not possible to quantify all these risks, but the combination of these factors could have a material impact on our financial results.
16. Subsequent Event
On April 9, 2024, NOV completed the divestiture of its Pole Products business. Pole Products is a leading manufacturer of premium spun-cast concrete, tapered steel, and innovative fiberglass poles for diverse applications.
On April 25, 2024, the Company announced that its Board of Directors authorized and approved a share repurchase program for up to $
19
Item 2. Management’s Discussion and Analysis of Financial Condition and Results of Operations
Introduction
NOV Inc. (“NOV” or the “Company”) is a leading independent equipment and technology provider to the global energy industry. Originally founded in 1862, NOV and its predecessor companies have spent 162 years helping transform oil and gas field development and improving its cost-effectiveness, efficiency, safety, and environmental impact. Over the past few decades, the Company has pioneered and refined key technologies to improve the economic viability of frontier resources, including unconventional and deepwater oil and gas. More recently, by applying its deep expertise and technology, the company has helped advance the transition toward sustainable energy.
NOV’s extensive proprietary technology portfolio supports the industry’s full-field drilling, completion, and production needs. With unmatched cross-segment capabilities, scope, and scale, NOV continues to develop and introduce technologies that further enhance the economics and efficiencies of energy production, with a focus on automation, predictive analytics, and condition-based maintenance.
NOV serves major-diversified, national, and independent service companies, contractors, and energy producers in 61 countries. Effective January 1, 2024, NOV consolidated its reporting structure into two segments: Energy Products and Services, and Energy Equipment. Segment disclosures pertaining to prior periods have been restated to reflect the change in reportable segments.
Results of operations are presented in accordance with accounting principles generally accepted in the United States (“GAAP”). Certain reclassifications have been made to prior period financial information in order to conform with current period presentation. The Company discloses Adjusted EBITDA (defined as operating profit excluding depreciation, amortization, gains and losses on sales of fixed assets and, when applicable, Other Items) in its periodic earnings press releases and other public disclosures to provide investors additional information about the results of ongoing operations. See Non-GAAP Financial Measures and Reconciliations in Results of Operations for an explanation of our use of non-GAAP financial measures and reconciliations to their corresponding measures calculated in accordance with GAAP.
Energy Products and Services
The Company’s Energy Products and Services segment provides a variety of technologies used primarily to perform drilling and well completion operations and offers services that optimize their performance.
Energy Products and Services designs, manufactures, rents, and sells equipment and products for drilling, intervention, completion, and production activities, including: drill bits, downhole tools, premium drill pipe, drilling fluids, managed pressure drilling, integral and weld-on connectors for conductor strings and surface casing, completion tools, and artificial lift systems.
The segment delivers services, software, and digital solutions to improve drilling and completion operational performance. Services include tubular inspection and coating services, solids control and waste management equipment and services, and managed pressure drilling solutions. Software and digital services and solutions offer drilling and completion optimization and remote monitoring capabilities via downhole and surface instrumentation, wired drill pipe services, software controls and applications, and data management and analytics services at the edge and in the cloud.
The segment also designs, manufactures, and delivers high-end composite pipe, tanks, and structures engineered to solve both corrosion and weight challenges in a wide variety of applications, including oil and gas, chemical, industrial, wastewater, fuel handling, marine and offshore, and rare earth mineral extraction .
Energy Products and Services serves oil and gas companies drilling contractors, oilfield service companies, oilfield equipment rental companies and developers of geothermal energy. Demand for the segment’s products and services primarily depends on the level of oilfield drilling activity by oil and gas companies, drilling contractors, and oilfield service companies. Demand for the segment’s composite solutions serving applications outside of oil and gas are driven by industrial activity, infrastructure spend, and population growth.
Energy Equipment
The Company’s Energy Equipment segment manufactures and supports the capital equipment and integrated systems needed for oil and gas exploration and production, both onshore and offshore, as well as for other marine-based and industrial markets.
The segment designs, manufactures, and integrates technologies for drilling and producing oil and gas wells. This includes equipment and technologies needed for drilling, including land rigs, offshore drilling equipment packages, drilling rig components, and software control systems that mechanize and automate the drilling process and rig functionality; hydraulic fracture stimulation, including pressure
20
pumping trucks, blenders, sanders, hydration units, injection units, flowline, and manifolds; well intervention, including coiled tubing units, coiled tubing, and wireline units and tools; cementing products for pumping, mixing, transport, and storage; onshore production, including fluid processing, and surface transfer as well as progressive cavity pumps; offshore production, including integrated production systems and subsea production technologies; and aftermarket support of these technologies, providing spare parts, service, and repair.
Energy Equipment primarily serves contract drillers, oilfield service companies, and oil and gas companies. Demand for the segment’s products primarily depends on capital spending plans by drilling contractors, service companies, and oil and gas companies; and secondarily on the overall level of oilfield drilling, completions, and workover activity which drives demand for equipment, spare parts, service, and repair for the segment’s large installed base of equipment.
The segment also serves marine and offshore markets, where it designs and builds equipment for wind turbine installation and cable lay vessels, and offers heavy lift cranes and jacking systems; industrial markets, where the segment provides pumps and mixers for a wide breadth of industrial end markets; and other energy transition markets, where it is applying its gas processing expertise to provide solutions that aid in hydrogen production and carbon sequestration.
Critical Accounting Policies and Estimates
In our annual report on Form 10-K for the year ended December 31, 2023, we identified our most critical accounting policies. In preparing the financial statements, we make assumptions, estimates and judgments that affect the amounts reported. We periodically evaluate our estimates and judgments that are most critical in nature which are related to revenue recognition under long-term construction contracts, impairment of goodwill and other indefinite-lived intangible assets, and income taxes. Our estimates are based on historical experience and on our future expectations that we believe are reasonable. The combination of these factors forms the basis for making judgments about the carrying values of assets and liabilities that are not readily apparent from other sources. Actual results are likely to differ from our current estimates and those differences may be material.
EXECUTIVE SUMMARY
For the first quarter ended March 31, 2024, the Company generated revenues of $2.16 billion, an increase of 10 percent compared to the first quarter of 2023. Net income was $119 million, or 5.5 percent of sales, a decrease of $7 million compared to the first quarter of 2023 primarily due to higher tax rate and lower income from unconsolidated entities. Operating profit was $162 million, or 7.5 percent of sales. The company recorded a net pre-tax credit of $3 million within Other Items. Adjusted EBITDA (operating profit excluding depreciation, amortization, gains and losses on sales of fixed assets and, when applicable, Other Items) increased 24 percent year-over-year to $241 million, or 11.2 percent of sales.
Segment Performance
Energy Products and Services
Energy Products and Services generated revenues of $1,017 million in the first quarter of 2024, an increase of eight percent from the first quarter of 2023. Operating profit was $121 million, or 11.9 percent of sales. Adjusted EBITDA increased $20 million from the prior year to $174 million, or 17.1 percent of sales. Growing demand from international and offshore markets in addition to market share gains in North America helped drive improved revenue and profitability.
Energy Equipment
Energy Equipment generated revenues of $1,178 million in the first quarter of 2024, an increase of 12 percent from the first quarter of 2023. Operating profit was $95 million, or 8.1 percent of sales, and included a credit of $4 million in Other Items. Adjusted EBITDA increased $25 million from the prior year to $119 million, or 10.1 percent of sales. Improved revenue and profitability were primarily the result of strong execution on the segment's capital equipment backlog and improved demand for aftermarket products and services.
New orders booked during the quarter totaled $390 million, representing a book-to-bill of 77 percent when compared to the $507 million of orders shipped from backlog. Outlook for capital equipment remains positive with a sizeable order the segment expected to book in the first quarter slipping into the early part of the second quarter while final adjustments are made to product specifications. As of March 31, 2024, backlog for capital equipment orders for Energy Equipment was $3,955 million, an increase of $115 million from the first quarter of 2023.
21
Oil & Gas Equipment and Services Market and Outlook
Despite the recent volatility in commodity prices, management believes the industry is in the early stages of an extended recovery that began in 2021 with the gradual reopening of global economies following the COVID-19 pandemic. Improving economic activity, driven by pent-up consumer and industrial demand and government economic stimulus, drove higher consumption of commodities, pulled significant volumes of oil and gas out of global inventories, and exposed diminished productive capacity resulting from years of underinvestment in the oil and gas industry.
Geopolitical risks, among other macro environment uncertainties, may drive volatility and could pressure commodity prices near-term; however, management believes diminished global oil and gas production capacity and rising energy security risks will continue to spur increased oilfield activity and demand for the Company’s equipment and technology.
NOV remains committed to improving organizational efficiencies while focusing on the development and commercialization of innovative products and services, including technologies to reduce the environmental impact of oil and gas operations and technologies to accelerate the energy transition that are responsive to the longer-term needs of NOV’s customers. We believe this strategy will further advance the Company’s competitive position in all market conditions.
Operating Environment Overview
The Company’s results are dependent on, among other things, the level of worldwide oil and gas drilling, well remediation activity, the prices of crude oil and natural gas, capital spending by exploration and production companies and drilling contractors, worldwide oil and gas inventory levels and, to a lesser degree, the level of investment in wind, solar and geothermal energy products. Key industry indicators for the first quarter of 2024 and 2023, and the fourth quarter of 2023 include the following:
|
|
|
|
|
|
|
|
|
|
|
% increase (decrease) |
|
||||||||
|
|
|
|
|
|
|
|
|
|
|
1Q24 v |
|
|
1Q24 v |
|
|||||
|
|
1Q24* |
|
|
1Q23* |
|
|
4Q23* |
|
|
1Q23 |
|
|
4Q23 |
|
|||||
Active Drilling Rigs: |
|
|
|
|
|
|
|
|
|
|
|
|
|
|
|
|||||
U.S. |
|
|
623 |
|
|
|
761 |
|
|
|
622 |
|
|
|
(18.1 |
%) |
|
|
0.2 |
% |
Canada |
|
|
209 |
|
|
|
223 |
|
|
|
182 |
|
|
|
(6.3 |
%) |
|
|
14.8 |
% |
International |
|
|
965 |
|
|
|
915 |
|
|
|
965 |
|
|
|
5.5 |
% |
|
|
— |
% |
Worldwide |
|
|
1,797 |
|
|
|
1,899 |
|
|
|
1,769 |
|
|
|
(5.4 |
%) |
|
|
1.6 |
% |
|
|
|
|
|
|
|
|
|
|
|
|
|
|
|
|
|||||
West Texas Intermediate |
|
$ |
77.56 |
|
|
$ |
76.08 |
|
|
$ |
78.41 |
|
|
|
1.9 |
% |
|
|
(1.1 |
%) |
|
|
|
|
|
|
|
|
|
|
|
|
|
|
|
|
|||||
Natural Gas Prices ($/mmbtu) |
|
$ |
2.13 |
|
|
$ |
2.65 |
|
|
$ |
2.74 |
|
|
|
(19.6 |
%) |
|
|
(22.3 |
%) |
* Averages for the quarters indicated. See sources below.
The Company is also becoming increasingly engaged with energy transition related opportunities and is currently involved in projects related to wind energy, geothermal power, rare earth metal extraction, biogas production, and carbon sequestration. Additionally, the Company is investing in developing technologies and solutions that will support other energy transition related industry verticals. Management expects to see continued growth in these areas as low carbon power becomes a larger portion of the global energy supply.
22
The following table details the U.S., Canadian, and international rig activity and West Texas Intermediate Crude Oil prices for the past nine quarters ended March 31, 2024, on a quarterly basis:
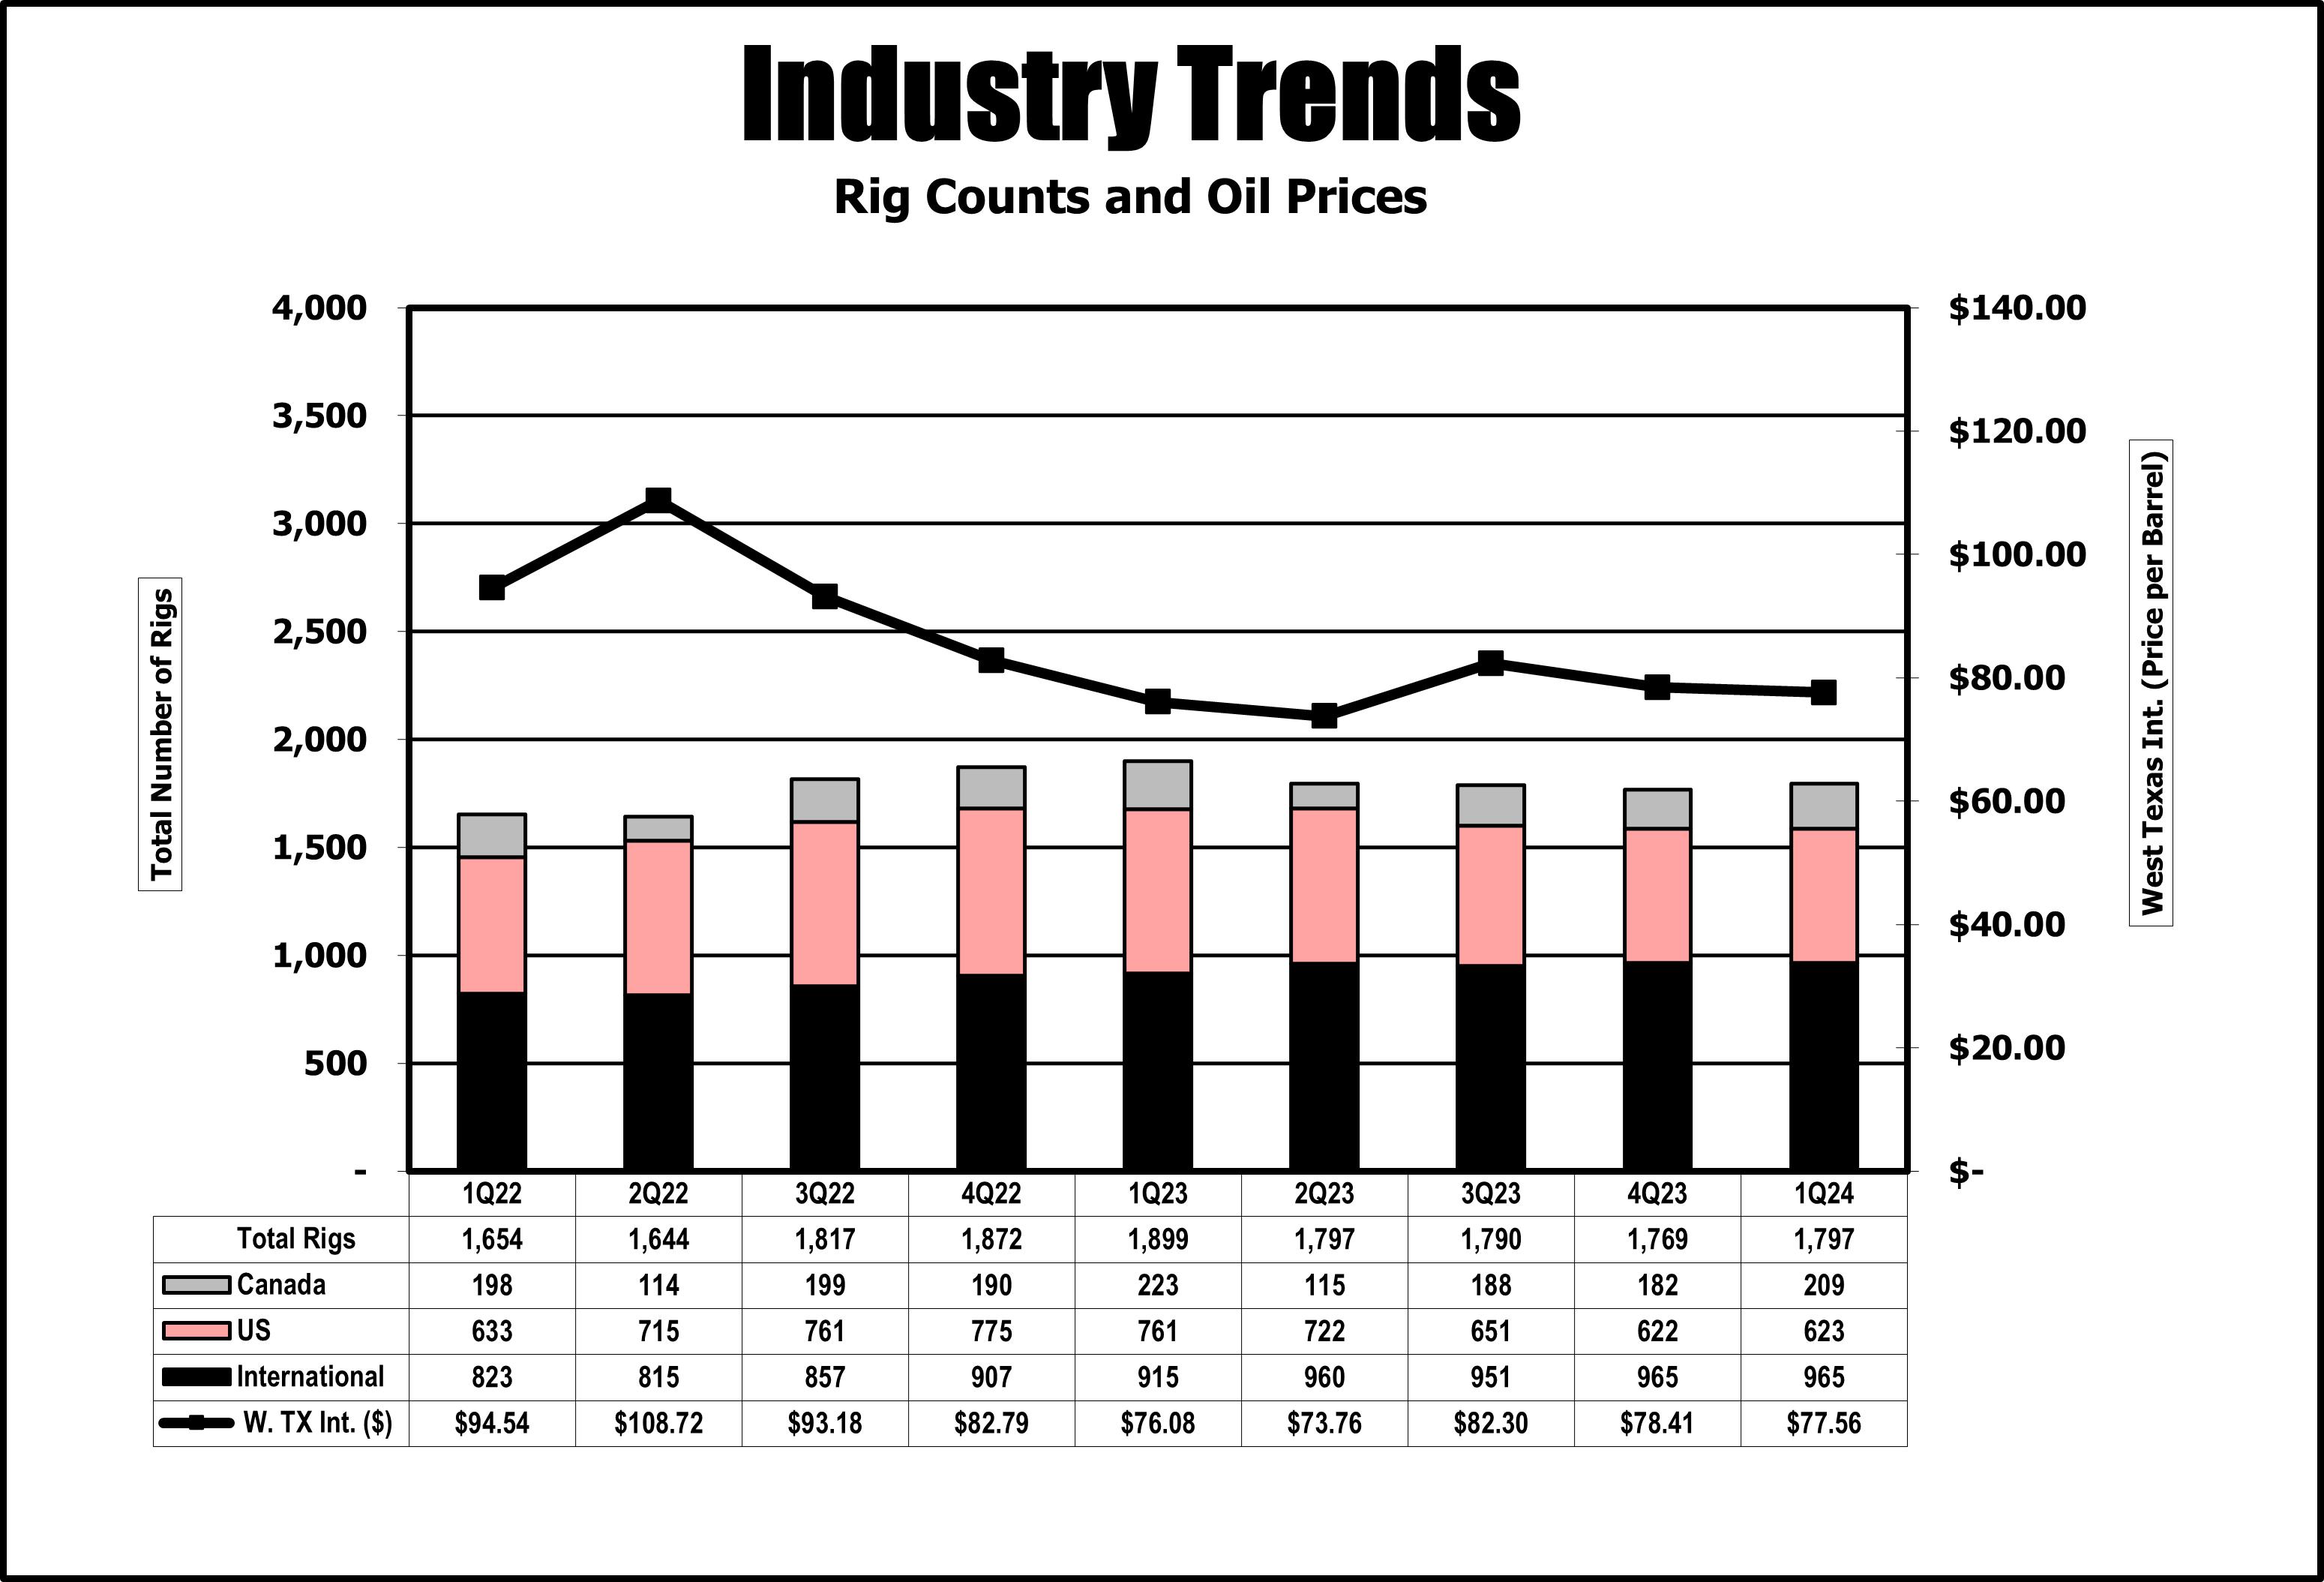
Source: Rig count: Baker Hughes, Inc. (www.bakerhughes.com); West Texas Intermediate Crude Oil and Natural Gas Prices: US Department of Energy, Energy Information Administration (www.eia.doe.gov).
The worldwide quarterly average rig count increased 2 percent (from 1,769 to 1,797) in the first quarter of 2024 compared to the fourth quarter of 2023, mainly attributable to Canada. The average per barrel price of West Texas Intermediate Crude Oil decreased 1 percent (from $78.41 per barrel to $77.56 per barrel) and natural gas prices decreased 22 percent (from $2.74 per mmbtu to $2.13 per mmbtu) in the first quarter of 2024 compared to the fourth quarter of 2023.
At April 12, 2024, there were 758 rigs actively drilling in North America, comprised of U.S. and Canada, which decreased 9 percent from the first quarter average of 832 rigs. The price for West Texas Intermediate Crude Oil was $85.66 per barrel at April 12, 2024, an increase of 10 percent from the first quarter of 2024 average. The price for natural gas was $1.77 per mmbtu at April 12, 2024, a decrease of 17 percent from the first quarter of 2024 average.
23
Results of Operations
Financial results by operating segment are as follows (in millions):
|
|
Three Months Ended |
|
|||||
|
|
March 31, |
|
|||||
|
|
2024 |
|
|
2023 |
|
||
Revenue: |
|
|
|
|
|
|
||
Energy Products and Services |
|
$ |
1,017 |
|
|
$ |
941 |
|
Energy Equipment |
|
|
1,178 |
|
|
|
1,052 |
|
Eliminations |
|
|
(40 |
) |
|
|
(31 |
) |
Total revenue |
|
$ |
2,155 |
|
|
$ |
1,962 |
|
|
|
|
|
|
|
|
||
Operating profit: |
|
|
|
|
|
|
||
Energy Products and Services |
|
$ |
121 |
|
|
$ |
112 |
|
Energy Equipment |
|
|
95 |
|
|
|
71 |
|
Eliminations and corporate costs |
|
|
(54 |
) |
|
|
(57 |
) |
Total operating profit |
|
$ |
162 |
|
|
$ |
126 |
|
Energy Products and Services
three months ended March 31, 2024 and 2023. Revenue from Energy Products and Services was $1,017 million for the three months ended March 31, 2024, compared to $941 million for the three months ended March 31, 2023, an increase of $76 million or 8 percent. Operating profit from Energy Products and Services was $121 million for the three months ended March 31, 2024 compared to an operating profit of $112 million for the three months ended March 31, 2023, an increase of $9 million. Growing demand from international and offshore markets, market share gains in North America and an acquisition during the quarter helped drive improved revenue and profitability.
Energy Equipment
three months ended March 31, 2024 and 2023. Revenue from Energy Equipment was $1,178 million for the three months ended March 31, 2024, compared to $1,052 million for the three months ended March 31, 2023, an increase of $126 million or 12 percent. Operating profit from Energy Equipment was $95 million for the three months ended March 31, 2024 compared to an operating profit of $71 million for the three months ended March 31, 2023, an increase of $24 million. Improved revenue and profitability were primarily the result of strong execution on the segment's capital equipment backlog and improved demand for aftermarket products and services.
The Energy Equipment segment monitors its capital equipment backlog to plan its business. New orders are added to backlog only when the Company receives a firm written order for major completion and production components or a contract related to a construction project. The capital equipment backlog was $3,955 million at March 31, 2024, an increase of $115 million from backlog of $3,840 million at March 31, 2023. Although numerous factors can affect the timing of revenue out of backlog (including, but not limited to, customer change orders and supplier accelerations or delays), the Company reasonably expects approximately 36 percent of backlog to become revenue during the rest of 2024 and the remainder thereafter. At March 31, 2024, approximately 43 percent of the capital equipment backlog was for offshore products and approximately 93 percent of the capital equipment backlog was destined for international markets.
Eliminations and corporate costs
Eliminations and corporate costs were $54 million for the three months ended March 31, 2024, compared to $57 million for the three months ended March 31, 2023. Sales from one segment to another generally are priced at estimated equivalent commercial selling prices; however, segments originating an external sale are credited with the full profit to the company. Eliminations include intercompany transactions conducted between the two reporting segments that are eliminated in consolidation. Intrasegment transactions are eliminated within each segment.
Other expense, net
Other expense, net was $10 million for the three months ended March 31, 2024, compared to $16 million for the three months ended March 31, 2023. The change in expense was primarily due to fluctuations in foreign currencies.
24
Provision for income taxes
The effective tax rate for the three months ended March 31, 2024 was 26.7%, compared to 13.8% for the same period in 2023. The effective tax rate for 2024 was negatively impacted by a mix of earnings in higher tax rate jurisdictions, losses in certain jurisdictions with no tax benefit, and a shortfall related to previously recognized stock compensation deductibility, partially offset by the reduction of valuation allowances related to U.S. and state deferred tax assets. The effective tax rate for 2023 was positively impacted by the utilization of previously unrealized loss carryforwards and tax credits as well as favorable adjustments related to changes in certain exchange rates, partially offset by losses in certain jurisdictions with no tax benefit.
Non-GAAP Financial Measures and Reconciliations
This Form 10-Q contains certain non-GAAP financial measures that management believes are useful tools for internal use and the investment community in evaluating NOV’s overall financial performance. These non-GAAP financial measures are broadly used to value and compare companies in the oilfield services and equipment industry. Not all companies define these measures in the same way. In addition, these non-GAAP financial measures are not a substitute for financial measures prepared in accordance with GAAP and should therefore be considered only as supplemental to such GAAP financial measures.
The Company defines Adjusted EBITDA as operating profit excluding depreciation, amortization, gains and losses on sales of fixed assets and, when applicable, Other Items. Adjusted EBITDA % is a ratio showing Adjusted EBITDA as a percentage of sales. Management believes this is important information to provide because it is used by management to evaluate the Company’s operational performance and trends between periods and manage the business. Management also believes this information may be useful to investors and analysts to gain a better understanding of the Company’s results of ongoing operations. Adjusted EBITDA and Adjusted EBITDA % are not intended to replace GAAP financial measures, such as Net Income and Operating Profit %.
25
The following tables set forth the reconciliation of Adjusted EBITDA to its most comparable GAAP financial measure (in millions):
|
|
Three Months Ended |
|
|||||||||
|
|
March 31, |
|
|
December 31, |
|
||||||
|
|
2024 |
|
|
2023 |
|
|
2023 |
|
|||
Operating profit: |
|
|
|
|
|
|
|
|
|
|||
Energy Products and Services |
|
$ |
121 |
|
|
$ |
112 |
|
|
$ |
94 |
|
Energy Equipment |
|
|
95 |
|
|
|
71 |
|
|
|
121 |
|
Eliminations and corporate costs |
|
|
(54 |
) |
|
|
(57 |
) |
|
|
(54 |
) |
Total operating profit |
|
$ |
162 |
|
|
$ |
126 |
|
|
$ |
161 |
|
|
|
|
|
|
|
|
|
|
|
|||
Operating profit %: |
|
|
|
|
|
|
|
|
|
|||
Energy Products and Services |
|
|
11.9 |
% |
|
|
11.9 |
% |
|
|
8.8 |
% |
Energy Equipment |
|
|
8.1 |
% |
|
|
6.7 |
% |
|
|
9.3 |
% |
Eliminations and corporate costs |
|
|
- |
|
|
|
- |
|
|
|
- |
|
Total operating profit % |
|
|
7.5 |
% |
|
|
6.4 |
% |
|
|
6.9 |
% |
|
|
|
|
|
|
|
|
|
|
|||
Other items, net: |
|
|
|
|
|
|
|
|
|
|||
Energy Products and Services |
|
$ |
— |
|
|
$ |
— |
|
|
$ |
50 |
|
Energy Equipment |
|
|
(4 |
) |
|
|
(4 |
) |
|
|
(1 |
) |
Corporate |
|
|
1 |
|
|
|
— |
|
|
|
6 |
|
Total other items |
|
$ |
(3 |
) |
|
$ |
(4 |
) |
|
$ |
55 |
|
|
|
|
|
|
|
|
|
|
|
|||
(Gain)/loss on sales of fixed assets: |
|
|
|
|
|
|
|
|
|
|||
Energy Products and Services |
|
$ |
(1 |
) |
|
$ |
(3 |
) |
|
$ |
1 |
|
Energy Equipment |
|
|
— |
|
|
|
(2 |
) |
|
|
— |
|
Corporate |
|
|
— |
|
|
|
1 |
|
|
|
— |
|
Total (gain)/loss on sales of fixed assets |
|
$ |
(1 |
) |
|
$ |
(4 |
) |
|
$ |
1 |
|
|
|
|
|
|
|
|
|
|
|
|||
Depreciation & amortization: |
|
|
|
|
|
|
|
|
|
|||
Energy Products and Services |
|
$ |
54 |
|
|
$ |
45 |
|
|
$ |
48 |
|
Energy Equipment |
|
|
28 |
|
|
|
29 |
|
|
|
27 |
|
Corporate |
|
|
1 |
|
|
|
3 |
|
|
|
2 |
|
Total depreciation & amortization |
|
$ |
83 |
|
|
$ |
77 |
|
|
$ |
77 |
|
|
|
|
|
|
|
|
|
|
|
|||
Adjusted EBITDA: |
|
|
|
|
|
|
|
|
|
|||
Energy Products and Services |
|
$ |
174 |
|
|
$ |
154 |
|
|
$ |
193 |
|
Energy Equipment |
|
|
119 |
|
|
|
94 |
|
|
|
147 |
|
Eliminations and corporate costs |
|
|
(52 |
) |
|
|
(53 |
) |
|
|
(46 |
) |
Total Adjusted EBITDA |
|
$ |
241 |
|
|
$ |
195 |
|
|
$ |
294 |
|
|
|
|
|
|
|
|
|
|
|
|||
Adjusted EBITDA %: |
|
|
|
|
|
|
|
|
|
|||
Energy Products and Services |
|
|
17.1 |
% |
|
|
16.4 |
% |
|
|
18.0 |
% |
Energy Equipment |
|
|
10.1 |
% |
|
|
8.9 |
% |
|
|
11.3 |
% |
Corporate |
|
|
- |
|
|
|
- |
|
|
|
- |
|
Total Adjusted EBITDA % |
|
|
11.2 |
% |
|
|
9.9 |
% |
|
|
12.5 |
% |
|
|
|
|
|
|
|
|
|
|
|||
Reconciliation of Adjusted EBITDA: |
|
|
|
|
|
|
|
|
|
|||
GAAP net income attributable to Company |
|
$ |
119 |
|
|
$ |
126 |
|
|
$ |
598 |
|
Noncontrolling interests |
|
|
2 |
|
|
|
(1 |
) |
|
|
(3 |
) |
Provision (benefit) for income taxes |
|
|
44 |
|
|
|
20 |
|
|
|
(460 |
) |
Interest expense |
|
|
24 |
|
|
|
21 |
|
|
|
23 |
|
Interest income |
|
|
(8 |
) |
|
|
(8 |
) |
|
|
(7 |
) |
Equity income in unconsolidated affiliates |
|
|
(29 |
) |
|
|
(48 |
) |
|
|
(18 |
) |
Other expense, net |
|
|
10 |
|
|
|
16 |
|
|
|
28 |
|
(Gain)/loss on Sales of fixed assets |
|
|
(1 |
) |
|
|
(4 |
) |
|
|
1 |
|
Depreciation and amortization |
|
|
83 |
|
|
|
77 |
|
|
|
77 |
|
Other items, net |
|
|
(3 |
) |
|
|
(4 |
) |
|
|
55 |
|
Total Adjusted EBITDA |
|
$ |
241 |
|
|
$ |
195 |
|
|
$ |
294 |
|
26
Liquidity and Capital Resources
Overview
At March 31, 2024, the Company had cash and cash equivalents of $468 million and total debt of $1,808 million. At December 31, 2023, cash and cash equivalents were $816 million and total debt was $1,725 million. As of March 31, 2024, approximately $453 million of the $468 million of cash and cash equivalents was held by our foreign subsidiaries and the earnings associated with this cash could be subject to foreign withholding taxes and incremental U.S. taxation if transferred among countries or repatriated to the U.S. If opportunities to invest in the U.S. are greater than available cash balances that are not subject to income tax, rather than repatriating cash, the Company may choose to borrow against its revolving credit facility.
The Company has a revolving credit facility with a borrowing capacity of $2.0 billion through October 30, 2024, and a borrowing capacity of $1.8 billion from October 31, 2024, to October 30, 2025. The Company has the right to increase the commitments under this agreement to an aggregate amount of up to $3.0 billion upon the consent of only those lenders holding any such increase. Interest under the multicurrency facility is based upon SOFR, NIBOR or CDOR plus 1.25% subject to a ratings-based grid or the U.S. prime rate. The credit facility contains a financial covenant regarding maximum debt-to-capitalization ratio of 60%. As of March 31, 2024, the Company was in compliance with a debt-to-capitalization ratio of 24.5% and had $50 million of outstanding borrowings under the facility, resulting in $1.95 billion of available funds.
Additionally, a consolidated joint venture of the Company borrowed $120 million against a $150 million bank line of credit for the construction of a facility in Saudi Arabia. Interest under the bank line of credit is based upon SOFR plus 1.40%. The bank line of credit contains a financial covenant regarding maximum debt-to-equity ratio of 75%. As of March 31, 2024, the joint venture was in compliance. The facility construction was completed in the fourth quarter of 2022, and the joint venture will not have future borrowings on the line of credit. The line of credit repayment schedule began in December 2022 with final payment no later than June 2032. As of March 31, 2024, the Company had $104 million in borrowings related to this line of credit. The Company has $10 million in payments related to this line of credit due in the next twelve months.
The Company’s outstanding debt at March 31, 2024 consisted of $1,091 million in 3.95% Senior Notes, $496 million in 3.60% Senior Notes, and other debt of $221 million. The Company was in compliance with all covenants at March 31, 2024. Long-term lease liabilities totaled $564 million at March 31, 2024.
The Company had $472 million of outstanding letters of credit at March 31, 2024, primarily in Norway and the United States, that are under various bilateral letter of credit facilities. Letters of credit are issued as bid bonds, advanced payment bonds and performance bonds.
The following table summarizes our net cash used in continuing operating activities, continuing investing activities and continuing financing activities for the periods presented (in millions):
|
|
Three Months Ended |
|
|||||
|
|
March 31, |
|
|||||
|
|
2024 |
|
|
2023 |
|
||
Net cash used in operating activities |
|
$ |
(78 |
) |
|
$ |
(202 |
) |
Net cash used in investing activities |
|
|
(311 |
) |
|
|
(52 |
) |
Net cash provided by (used in) financing activities |
|
|
43 |
|
|
|
(41 |
) |
Significant uses of cash during the first three months of 2024
Other
The effect of the change in exchange rates on cash flows was a decrease of $2 million for the first three months of 2024, and immaterial for the first three months of 2023.
27
We believe that cash on hand, cash generated from operations and amounts available under our credit facilities and from other sources of debt will be sufficient to fund operations, lease payments, working capital needs, capital expenditure requirements, dividends and financing obligations.
Through a return of capital framework, we expect to return at least 50 percent of excess free cash flow (defined as cash flow from operations, less capital expenditures and other investments, including acquisitions) through a combination of steady, quarterly base dividends, opportunistic stock buybacks, and an annual supplemental dividend to true-up to shareholders on an annual basis. Associated with the plan, our Board of Directors authorized a share repurchase program for up to $1.0 billion of the currently outstanding shares of our common stock over a period of 36 months, and we have announced that we expect to increase our quarterly cash dividend on its common stock from $0.05 per share to $0.075 per share, a 50 percent increase. The first quarterly dividend of $0.075 per share is anticipated to be paid out during the quarter ended June 30, 2024. Subject to the approval of our Board of Directors, the Company also intends to declare a supplemental dividend during the second quarter ended June 30, 2025. The amount of such supplemental dividend is expected to be a minimum of 50% of the our Excess Free Cash Flow less capital returned to shareholders via base dividends and share repurchases during 2024. The declaration and payment of any future dividend is subject to the sole discretion of the our Board of Directors and will depend on our earnings, financial condition, capital requirements, level of indebtedness, applicable statutory and contractual restrictions and other considerations that the Board of Directors deems relevant.
Under the share repurchase program, we may repurchase shares from time to time through open market purchases, in privately negotiated transactions or by other means, including through the use of trading plans intended to qualify under Rule 10b5-1 under the Securities Exchange Act of 1934 (the “Exchange Act”), as amended, in accordance with applicable securities laws and other restrictions, including Rule 10b-18. The timing and total amount of any stock repurchases will depend upon business, economic and market conditions, corporate and regulatory requirements, prevailing stock prices and other considerations.
We may pursue additional acquisition candidates, but the timing, size or success of any acquisition effort and the related potential capital commitments cannot be predicted. We continue to expect to fund future cash acquisitions primarily with cash flow from operations and borrowings, including the unborrowed portion of the revolving credit facility or new debt issuances, but may also issue additional equity either directly or in connection with acquisitions. There can be no assurance that additional financing for acquisitions will be available at terms acceptable to us.
Forward-Looking Statements
The Private Securities Litigation Reform Act of 1995 provides safe harbor provisions for forward-looking information. Some of the information in this document contains, or has incorporated by reference, forward-looking statements. Statements that are not historical facts, including statements about our beliefs and expectations, are forward-looking statements. Forward-looking statements typically are identified by use of terms such as “may,” “believe,” “plan,” “will,” “expect,” “anticipate,” “estimate,” “should,” “forecast,” and similar words, although some forward-looking statements are expressed differently. We may also provide oral or written forward-looking information in other materials we release to the public. Forward-looking information involves risk and uncertainties and reflects our best judgment based on current information. You should be aware that our actual results could differ materially from results anticipated in the forward-looking statements due to a number of factors, including but not limited to changes in oil and gas prices, customer demand for our products and worldwide economic activity, including matters related to recent Russian sanctions. Given these uncertainties, current or prospective investors are cautioned not to place undue reliance on any such forward-looking statements. We undertake no obligation to update any such factors or forward-looking statements to reflect future events or developments. You should also consider carefully the statements under “Risk Factors,” as disclosed in our Annual Report on Form 10-K for the year-end December 31, 2023, as updated in Part II, Item 1A of our Quarterly Reports on Form 10-Q, which address additional factors that could cause our actual results to differ from those set forth in the forward-looking statements, and additional disclosures we make in our press releases and Forms 10-Q, and 8-K. We also suggest that you listen to our quarterly earnings release conference calls with financial analysts.
28
Item 3. Quantitative and Qualitative Disclosures About Market Risk
We are exposed to changes in foreign currency exchange rates and interest rates. Additional information concerning each of these matters follows:
Foreign Currency Exchange Rates
We have extensive operations in foreign countries. The net assets and liabilities of these operations are exposed to changes in foreign currency exchange rates, although such fluctuations have a muted effect on net income since the functional currency for the majority of them is the local currency. These operations also have net assets and liabilities not denominated in the functional currency, which exposes us to changes in foreign currency exchange rates that impact income. We recorded a foreign exchange loss in our income statement of $6 million in the first three months of 2024, compared to a $9 million foreign exchange loss in the same period of the prior year. Gains and losses are primarily due to exchange rate fluctuations related to monetary asset balances denominated in currencies other than the functional currency and adjustments to our hedged positions as a result of changes in foreign currency exchange rates. Currency exchange rate fluctuations may create losses in future periods to the extent we maintain net monetary assets and liabilities not denominated in the functional currency of the NOV operation.
Some of our revenues in foreign countries are denominated in U.S. dollars, and therefore, changes in foreign currency exchange rates impact our earnings to the extent that costs associated with those U.S. dollar revenues are denominated in the local currency. Similarly, some of our revenues are denominated in foreign currencies, but have associated U.S. dollar costs, which also give rise to foreign currency exchange rate exposure. In order to mitigate that risk, we may utilize foreign currency forward contracts to better match the currency of our revenues and associated costs. We do not use foreign currency forward contracts for trading or speculative purposes.
The Company had other financial market risk sensitive instruments (cash balances, overdraft facilities, accounts receivable and accounts payable) denominated in foreign currencies with transactional exposures totaling $475 million and translation exposures totaling $309 million as of March 31, 2024. The Company estimates that a hypothetical 10% movement of all applicable foreign currency exchange rates on the transactional exposures could affect net income by $37 million and the translational exposures could affect Other Comprehensive Income by $31 million.
The counterparties to forward contracts are major financial institutions. The credit ratings and concentration of risk of these financial institutions are monitored on a continuing basis. Because these contracts are net-settled the Company’s credit risk with the counterparties is limited to the foreign currency rate differential at the end of the contract.
Interest Rate Risk
At March 31, 2024, borrowings consisted of $1,091 million in 3.95% Senior Notes, $496 million in 3.60% Senior Notes, and other debt of $221 million. At March 31, 2024, there were no outstanding letters of credit issued under the credit facility, resulting in $1.95 billion of funds available under this credit facility. Additionally, the Company’s joint venture has a $150 million bank line of credit for the construction of a facility in Saudi Arabia. Interest under the bank line of credit is based upon SOFR plus 1.40%. Occasionally a portion of borrowings under our credit facility could be denominated in multiple currencies which could expose us to market risk with exchange rate movements. These instruments carry interest at a pre-agreed upon percentage point spread from either SOFR, NIBOR or CDOR, or at the U.S. prime rate. Under our credit facility, we may, at our option, fix the interest rate for certain borrowings based on a spread over SOFR, NIBOR or CDOR for one month to six months. Our objective is to maintain a portion of our debt in variable rate borrowings for the flexibility obtained regarding early repayment without penalties and lower overall cost as compared with fixed-rate borrowings.
Item 4. Controls and Procedures
As of the end of the period covered by this report, we carried out an evaluation, under the supervision and with the participation of the Company’s management, including the Company’s Chief Executive Officer and Chief Financial Officer, of the effectiveness of the design and operation of the Company’s disclosure controls and procedures. The Company’s disclosure controls and procedures are designed to provide reasonable assurance that the information required to be disclosed by the Company in the reports it files under the Exchange Act is accumulated and communicated to the Company’s management, including the Company’s Chief Executive Officer and Chief Financial Officer, as appropriate, to allow timely decisions regarding required disclosures and is recorded, processed, summarized and reported within the time period specified in the rules and forms of the Securities and Exchange Commission. Based upon that evaluation, the Company’s Chief Executive Officer and Chief Financial Officer concluded that the Company’s disclosure controls and procedures are effective as of the end of the period covered by this report at a reasonable assurance level.
There has been no change in our internal control over financial reporting (as defined in Rule 13a-15(f) under the Exchange Act) that occurred during our last fiscal quarter that has materially affected, or is reasonably likely to materially affect, our internal control over financial reporting.
29
PART II - OTHER INFORMATION
Item 1A. Risk Factors
As of the date of this filing, the Company and its operations continue to be subject to the risk factors previously disclosed in Part I, Item 1A "Risk Factors" in our 2023 Annual Report on Form 10-K for the fiscal year ended December 31, 2023.
Item 2. Purchases of Equity Securities by the Issuer and Affiliated Purchasers
|
|
|
|
|
|
|
|
|
|
|
|
|
||||
Period |
|
Total number |
|
|
Average |
|
|
Total number of |
|
|
Approximate dollar |
|
||||
January 1 through January 31, 2024 |
|
|
— |
|
|
|
— |
|
|
|
— |
|
|
|
— |
|
February 1 through February 29, 2024 |
|
|
836,773 |
|
|
$ |
17.43 |
|
|
|
— |
|
|
|
— |
|
March 1 through March 31, 2024 |
|
|
— |
|
|
|
— |
|
|
|
— |
|
|
|
— |
|
Total(1) |
|
|
836,773 |
|
|
$ |
17.43 |
|
|
|
— |
|
|
|
|
|
(1) The 836,773 shares listed as “purchased” were withheld from employees' vesting of restricted stock grants, as required for income taxes, and retired. These shares were not part of a publicly announced program to purchase common stock.
Item 4. Mine Safety Disclosures
Information regarding mine safety and other regulatory actions at our mines is included in Exhibit 95 to this Form 10-Q.
Item 6. Exhibits
Reference is hereby made to the Exhibit Index commencing on page 31.
30
INDEX TO EXHIBITS
3.1 |
|
Seventh Amended and Restated Certificate of Incorporation of NOV Inc. (Exhibit 3.1) (1) |
|
|
|
3.2 |
|
|
|
|
|
10.1 |
|
Amendment to 5-Year Credit Agreement, dated as of March 18, 2024 (Exhibit 10.1) (3) |
|
|
|
10.2 |
|
|
|
|
|
10.3 |
|
|
|
|
|
10.4 |
|
Form of Employee Nonqualified Stock Option Grant Agreement (3) |
|
|
|
31.1 |
|
|
|
|
|
31.2 |
|
|
|
|
|
32.1 |
|
Certification pursuant to Section 906 of the Sarbanes-Oxley Act of 2002. (3) |
|
|
|
32.2 |
|
Certification pursuant to Section 906 of the Sarbanes-Oxley Act of 2002. (3) |
|
|
|
95 |
|
Mine Safety Information pursuant to section 1503 of the Dodd-Frank Act. (3) |
|
|
|
101.INS |
|
Inline XBRL Instance Document – the instance document does not appear in the Interactive Data File because its XBRL tags are embedded within the Inline XBRL document. |
|
|
|
101.SCH |
|
Inline XBRL Taxonomy Extension Schema Document |
|
|
|
101.CAL |
|
Inline XBRL Taxonomy Extension Calculation Linkbase Document |
|
|
|
101.DEF |
|
Inline XBRL Taxonomy Extension Definition Linkbase Document |
|
|
|
101.LAB |
|
Inline XBRL Taxonomy Extension Label Linkbase Document |
|
|
|
101.PRE |
|
Inline XBRL Taxonomy Extension Presentation Linkbase Document |
|
|
|
104 |
|
Cover Page Interactive Data File (formatted as inline XBRL and contained in Exhibit 101) |
* Compensatory plan or arrangement for management or others.
We hereby undertake, pursuant to Regulation S-K, Item 601(b), paragraph (4) (iii), to furnish to the U.S. Securities and Exchange Commission, upon request, all constituent instruments defining the rights of holders of our long-term debt not filed herewith.
31
SIGNATURE
Pursuant to the requirements of the Securities Exchange Act of 1934, the registrant has duly caused this report to be signed on its behalf by the undersigned thereunto duly authorized.
Date: April 26, 2024 |
By: |
|
/s/ Christy H. Novak |
|
Christy H. Novak |
||
|
Vice President, Corporate Controller & Chief Accounting Officer |
||
|
(Duly Authorized Officer, Principal Accounting Officer) |
||
32