UNITED STATES
SECURITIES AND EXCHANGE COMMISSION
Washington, D.C. 20549
FORM
(Mark One)
For the quarterly period ended:
For the transition period from _____________ to _____________
Commission File No.
(Exact name of registrant as specified in its charter)
(State or other jurisdiction of incorporation or organization) | (I.R.S. Employer Identification No.) |
|
|
(
(Registrant’s telephone number, including area code)
Securities registered pursuant to Section 12(b) of the Act:
Title of each Class |
| Trading Symbol(s) |
| Name of each Exchange on which registered |
Indicate by check mark whether the registrant (1) has filed all reports required to be filed by Section 13 or 15(d) of the Securities Exchange Act of 1934 during the preceding 12 months (or for such shorter period that the registrant was required to file such reports), and (2) has been subject to such filing requirements for the past 90 days.
Indicate by check mark whether the registrant has submitted electronically every Interactive Data File required to be submitted pursuant to Rule 405 of Regulation S-T (§ 232.405 of this chapter) during the preceding 12 months (or for such shorter period that the registrant was required to submit such files).
Indicate by check mark whether the registrant is a large accelerated filer, an accelerated filer, a non-accelerated filer, a smaller reporting company or an emerging growth company. See the definitions of “large accelerated filer,” “accelerated filer,” “smaller reporting company” and “emerging growth company” in Rule 12b-2 of the Exchange Act.
Large accelerated filer ☐ | Accelerated filer ☐ |
Smaller reporting company | |
| Emerging growth company |
If an emerging growth company, indicate by check mark if the registrant has elected not to use the extended transition period for complying with any new or revised financial accounting standards provided pursuant to Section 13(a) of the Exchange Act. ◻
Indicate by check mark whether the registrant is a shell company (as defined in Rule 12b-2 of the Exchange Act). Yes
Indicate the number of shares outstanding of each of the issuer’s classes of common stock as of the latest practicable date.
Title of Class |
| Number of Shares Outstanding on February 5, 2024 |
Common Stock, $0.001 par value |
|
1 In November 2019, we became a fully remote company. Accordingly, we do not currently have principal executive offices.
TABLE OF CONTENTS
2
PART 1 — FINANCIAL INFORMATION
Item 1. Condensed Consolidated Financial Statements
Research Solutions, Inc. and Subsidiaries
Condensed Consolidated Balance Sheets
|
| December 31, |
| ||||
|
| 2023 |
| June 30, | |||
| (unaudited) | 2023 | |||||
Assets |
|
| |||||
Current assets: |
|
|
|
| |||
Cash and cash equivalents | $ | | $ | | |||
Accounts receivable, net of allowance of $ |
| |
| | |||
Prepaid expenses and other current assets |
| |
| | |||
Prepaid royalties |
| |
| | |||
Total current assets |
| |
| | |||
Non-current assets: |
|
|
|
| |||
Property and equipment, net of accumulated depreciation of $ |
| |
| | |||
Intangible assets, net of accumulated amortization of $ | | | |||||
Goodwill (provisional) | | | |||||
Deposits and other assets |
| |
| | |||
Total assets | $ | | $ | | |||
|
|
|
| ||||
Liabilities and Stockholders’ Equity |
|
|
|
| |||
Current liabilities: |
|
| |||||
Accounts payable and accrued expenses | $ | | $ | | |||
Deferred revenue |
| |
| | |||
Total current liabilities |
| |
| | |||
Non-current liabilities: |
|
|
|
| |||
Contingent earnout liability |
| |
| | |||
Total liabilities |
| |
| | |||
|
|
|
| ||||
Commitments and contingencies |
|
|
|
| |||
|
|
|
| ||||
Stockholders’ equity: |
|
|
|
| |||
Preferred stock; $ |
| |
| | |||
Common stock; $ |
| |
| | |||
Additional paid-in capital |
| |
| | |||
Accumulated deficit |
| ( |
| ( | |||
Accumulated other comprehensive loss |
| ( |
| ( | |||
Total stockholders’ equity |
| |
| | |||
Total liabilities and stockholders’ equity | $ | | $ | | |||
See notes to condensed consolidated financial statements
3
Research Solutions, Inc. and Subsidiaries
Condensed Consolidated Statements of Operations and Other Comprehensive Income (Loss)
(Unaudited)
Three Months Ended | Six Months Ended | ||||||||||||
December 31, | December 31, | ||||||||||||
|
| 2023 |
| 2022 |
| 2023 |
| 2022 | |||||
| |||||||||||||
Revenue: |
|
|
|
|
|
|
| ||||||
Platforms | $ | | $ | | $ | | $ | | |||||
Transactions |
| |
| |
| |
| | |||||
Total revenue |
| |
| |
| |
| | |||||
|
|
|
|
|
|
|
| ||||||
Cost of revenue: |
|
|
|
|
|
|
|
| |||||
Platforms |
| |
| |
| |
| | |||||
Transactions |
| |
| |
| |
| | |||||
Total cost of revenue |
| |
| |
| |
| | |||||
Gross profit |
| |
| |
| |
| | |||||
|
|
|
|
|
|
|
| ||||||
Operating expenses: |
|
|
|
|
|
|
|
| |||||
Selling, general and administrative |
| |
| |
| |
| | |||||
Depreciation and amortization |
| |
| |
| |
| | |||||
Total operating expenses |
| |
| |
| |
| | |||||
Loss from operations |
| ( |
| ( |
| ( |
| ( | |||||
|
|
|
|
|
|
|
| ||||||
Other income |
| |
| |
| |
| | |||||
|
|
|
|
|
|
|
| ||||||
Loss from operations before provision for income taxes |
| ( |
| ( |
| ( |
| ( | |||||
Provision for income taxes |
| ( |
| ( |
| ( |
| ( | |||||
|
|
|
|
|
|
|
| ||||||
Net loss | ( |
| ( |
| ( |
| ( | ||||||
|
|
|
|
|
|
|
| ||||||
Other comprehensive income (loss): |
|
|
|
| |||||||||
Foreign currency translation |
| |
| |
| |
| | |||||
Comprehensive loss | $ | ( | $ | ( | $ | ( | $ | ( | |||||
Loss per common share: | |||||||||||||
Net loss per share, basic and diluted | ( | ( | $ | ||||||||||
Weighted average common shares outstanding, basic and diluted | | | | | |||||||||
See notes to condensed consolidated financial statements
4
Research Solutions, Inc. and Subsidiaries
Condensed Consolidated Statements of Changes in Stockholders’ Equity
For the Three and Six Months Ended December 31, 2023
(Unaudited)
Additional | Other | Total | |||||||||||||||
Common Stock | Paid-in | Accumulated | Comprehensive | Stockholders’ | |||||||||||||
|
| Shares |
| Amount |
| Capital |
| Deficit |
| Loss |
| Equity | |||||
| |||||||||||||||||
Balance, September 30, 2023 |
| | $ | | $ | | $ | ( | $ | ( | $ | | |||||
|
|
|
|
|
|
|
|
|
|
|
| ||||||
Fair value of vested stock options |
| — |
| — |
| |
| — |
| — |
| | |||||
|
|
|
|
|
|
|
|
|
|
|
| ||||||
Fair value of vested restricted common stock |
| |
| |
| |
| — |
| — |
| | |||||
Repurchase of common stock | ( |
| ( |
| ( |
| — |
| — |
| ( | ||||||
Common stock issued for acquisition of Scite | | | | — | — | | |||||||||||
|
|
|
|
|
| ||||||||||||
Modification cost of accelerated vesting of restricted common stock | — |
| — | |
| — |
| — | | ||||||||
|
|
|
| ||||||||||||||
Net loss for the period |
| — |
| — |
| — |
| ( |
| — |
| ( | |||||
|
|
|
|
|
|
|
|
|
|
|
| ||||||
Foreign currency translation |
| — |
| — |
| — |
| — |
| |
| | |||||
Balance, December 31, 2023 |
| |
| $ | |
| $ | |
| $ | ( |
| $ | ( |
| $ | |
|
|
|
|
|
|
|
|
|
|
|
| ||||||
Balance, July 1, 2023 |
| | $ | | $ | | $ | ( | $ | ( | $ | | |||||
|
|
|
|
|
|
|
|
|
|
|
| ||||||
Fair value of vested stock options |
| — |
| — |
| |
| — |
| — |
| | |||||
|
|
|
|
|
|
|
|
|
|
|
| ||||||
Fair value of vested restricted common stock |
| |
| |
| |
| — |
| — |
| | |||||
|
|
|
|
|
|
|
|
|
|
|
| ||||||
Repurchase of common stock |
| ( |
| ( |
| ( |
| — |
| — |
| ( | |||||
Common stock issued upon exercise of stock options |
| |
| | ( |
| — |
| — |
| — | ||||||
Common stock issued for acquisition of Scite | | | | — | — | | |||||||||||
Modification cost of accelerated vesting of restricted common stock | — | — | | — | — | | |||||||||||
|
|
|
|
|
|
| |||||||||||
Net loss for the period |
| — |
| — | — |
| ( |
| — |
| ( | ||||||
|
|
|
|
|
|
| |||||||||||
Foreign currency translation |
| — |
| — |
| — |
| — |
| |
| | |||||
Balance, December 31, 2023 |
| | $ | | $ | | $ | ( | $ | ( | $ | | |||||
See notes to condensed consolidated financial statements
5
Research Solutions, Inc. and Subsidiaries
Condensed Consolidated Statements of Changes in Stockholders’ Equity
For the Three and Six Months Ended December 31, 2022
(Unaudited)
Additional | Other | Total | |||||||||||||||
Common Stock | Paid-in | Accumulated | Comprehensive | Stockholders’ | |||||||||||||
|
| Shares |
| Amount |
| Capital |
| Deficit |
| Loss |
| Equity | |||||
| |||||||||||||||||
Balance, September 30, 2022 |
| | $ | | $ | | $ | ( | $ | ( | $ | | |||||
|
|
|
|
|
|
|
|
|
|
|
| ||||||
Fair value of vested stock options |
| — |
| — |
| |
| — |
| — |
| | |||||
|
|
|
|
|
|
|
|
|
|
|
| ||||||
Fair value of vested restricted common stock |
| |
| |
| |
| — |
| — |
| | |||||
|
|
|
|
|
|
|
|
|
|
|
| ||||||
Repurchase of common stock | ( |
| ( |
| ( |
| — |
| — |
| ( | ||||||
| |||||||||||||||||
Common stock issued upon exercise of stock options | |
| | ( |
| — |
| — |
| — | |||||||
|
|
|
| ||||||||||||||
Net loss for the period |
| — |
| — |
| — |
| ( |
| — |
| ( | |||||
|
|
|
|
|
|
|
|
|
|
|
| ||||||
Foreign currency translation |
| — |
| — |
| — |
| — |
| |
| | |||||
|
|
|
|
|
|
|
|
|
|
|
| ||||||
Balance, December 31, 2022 |
| |
| $ | |
| $ | |
| $ | ( |
| $ | ( |
| $ | |
|
|
|
|
|
|
|
|
|
|
|
| ||||||
Balance, July 1, 2022 |
| | $ | |
| $ | |
| $ | ( |
| $ | ( |
| $ | | |
|
|
|
|
|
|
|
|
|
|
|
| ||||||
Fair value of vested stock options |
| — |
| — |
| |
| — |
| — |
| | |||||
|
|
|
|
|
|
|
|
|
|
|
| ||||||
Fair value of vested restricted common stock |
| |
| |
| |
| — |
| — |
| | |||||
|
|
|
|
|
|
|
|
|
|
|
| ||||||
Fair value of vested unrestricted common stock |
| |
| |
| |
| — |
| — |
| | |||||
|
|
|
|
|
|
|
| ||||||||||
Repurchase of common stock |
| ( |
| ( |
| ( |
| — |
| — |
| ( | |||||
|
|
|
| ||||||||||||||
Common stock issued upon exercise of stock options | |
| | ( | — | — | — | ||||||||||
|
|
| |||||||||||||||
Net loss for the period |
| — |
| — |
| — |
| ( |
| — |
| ( | |||||
|
|
|
|
|
|
|
|
|
|
| |||||||
Foreign currency translation |
| — |
| — |
| — |
| — |
| |
| | |||||
Balance, December 31, 2022 |
| | $ | | $ | | $ | ( | $ | ( | $ | | |||||
See notes to condensed consolidated financial statements
6
Research Solutions, Inc. and Subsidiaries
Condensed Consolidated Statements of Cash Flows
(Unaudited)
Six Months Ended | |||||||
December 31, | |||||||
|
| 2023 |
| 2022 | |||
| |||||||
Cash flow from operating activities: |
|
|
|
| |||
Net loss | $ | ( | $ | ( | |||
Adjustment to reconcile net income (loss) to net cash provided by (used in) operating activities: |
|
|
|
| |||
Depreciation and amortization |
| |
| | |||
Fair value of vested stock options |
| |
| | |||
Fair value of vested restricted common stock |
| |
| | |||
Fair value of vested unrestricted common stock | | | |||||
Modification cost of accelerated vesting of restricted common stock | | | |||||
Changes in operating assets and liabilities: |
|
|
|
| |||
Accounts receivable |
| ( |
| | |||
Prepaid expenses and other current assets |
| ( |
| ( | |||
Prepaid royalties |
| |
| | |||
Accounts payable and accrued expenses |
| |
| ( | |||
Deferred revenue |
| ( |
| | |||
Net cash provided by (used in) operating activities |
| ( |
| | |||
|
|
|
| ||||
Cash flow from investing activities: |
|
|
|
| |||
Purchase of property and equipment |
| ( |
| ( | |||
Payment for acquisition of Resolute, net of cash acquired | ( | | |||||
Payment for acquisition of Scite, net of cash acquired | ( | | |||||
Payment for non-refundable deposit for asset acquisition | | ( | |||||
Net cash used in investing activities |
| ( |
| ( | |||
|
|
|
| ||||
Cash flow from financing activities: |
| ||||||
Common stock repurchase | ( | ( | |||||
Payment of contingent acquisition consideration | ( | | |||||
Net cash used in financing activities |
| ( |
| ( | |||
|
|
|
| ||||
Effect of exchange rate changes |
| |
| | |||
Net increase (decrease) in cash and cash equivalents |
| ( |
| | |||
Cash and cash equivalents, beginning of period |
| |
| | |||
Cash and cash equivalents, end of period | $ | | $ | | |||
|
|
|
| ||||
Supplemental disclosures of cash flow information: |
|
|
|
| |||
Cash paid for income taxes | $ | | $ | | |||
|
|
|
| ||||
Non-cash investing and financing activities: |
|
|
|
| |||
Contingent consideration accrual on asset acquisition | $ | | $ | | |||
See notes to condensed consolidated financial statements
7
RESEARCH SOLUTIONS, INC. AND SUBSIDIARIES
NOTES TO CONDENSED CONSOLIDATED FINANCIAL STATEMENTS
Six Months Ended December 31, 2023 and 2022 (Unaudited)
Note 1. Organization, Nature of Business and Basis of Presentation
Organization
Research Solutions, Inc. (the “Company,” “Research Solutions,” “we,” “us” or “our”) was incorporated in the State of Nevada on November 2, 2006, and is a publicly traded holding company with
Nature of Business
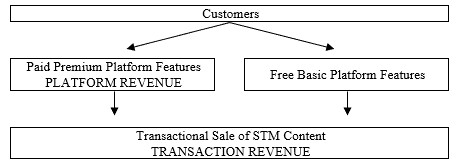
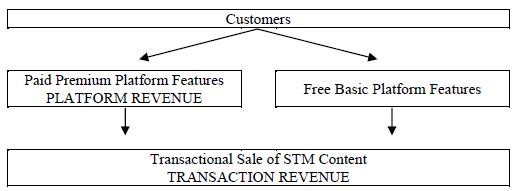
We provide software and related services to help research intensive organizations save time and money. We offer various software platforms (“Platform” or “Platforms”) that are typically sold to corporate, academic, government and individual researchers as cloud-based software-as-a-service (“SaaS”) via auto-renewing license agreements. Corporate, academic, and government customers typically sign up under annual agreements. Individual researchers can sign up under an annual or a month-to-month agreement and are typically billed monthly. Our Platforms also facilitate the sale of published scientific, technical, and medical (“STM”) content sold as individual articles (“Transactions”) either stand alone or via one or more of the research Platform solutions we provide. When one or more of the Platform solutions are used to purchase Transactions, customers pay for those transactions through monthly billing or via credit card for individual researchers. Our Platforms enable life science and other research-intensive organizations to accelerate their research and development activities through our advanced discovery tools (i.e. search), tools to access and buy STM articles required to support their research (i.e. acquire), as well as tools that manage that content across the enterprise and on an individual basis (i.e. manage). The Platforms typically deliver an ROI to the customer by reducing the amount of time it takes a research organization to find, acquire and manage content, in addition to also driving down the ultimate cost per article over time.
Platforms
Our cloud-based SaaS Platforms consist of proprietary software and Internet-based interfaces sold to customers through an annual or monthly subscription fee. Legacy functionality falls into three areas.
Discover – These solutions facilitate search (discovery) across virtually all STM articles available. The solutions we offer include free (basic) search solutions and advanced search tools like the Resolute.ai and scite.ai products. These tools allow for searching and identifying relevant research and then purchasing that research through one of our other solutions. In addition, these tools increasingly enable users to find insights in other datasets adjacent to STM content, such as Clinical Trial, Patent, Life Science & MedTech Regulatory information, Competitor and Technology landscape insights in addition to searching the customer’s internal datasets. The advanced search solutions are sold through a seat, enterprise, or individual license.
Acquire – Our Article Galaxy (AG) solution allows for research organizations to load their entitlements (subscriptions, discount or token packages, and their existing library of articles) and AG manages those entitlements in the background enabling the researchers to focus on acquiring articles they need quickly and efficiently at the lowest possible cost. When used in conjunction with our discovery Platforms, customers can initiate orders, route orders based on the lowest cost to acquire, obtain spend and usage reporting, automate authentication, and connect seamlessly to in-house and third-party software systems.
Manage – Our References solution allows users to access the article inside the Platform including setting up personal folders or team folders and allows researchers to markup and take notes on the articles in a supported browser on a desktop or tablet.
8
We use Artificial Intelligence (“AI”) in several parts of the research workflow today and will continually add capability as we move forward. Today we offer an AI based recommendation engine in our Discover, Acquire, and Manage Platform solutions. We also offer an AI based “assistant” in some of our solutions to allow the researcher to ask questions about articles, groups of articles (folders), and more. We also have the capability to provide full text search on STM content in the scite.ai Platform where the publisher gives us the rights to do so.
Using Resolute.ai and scite.ai technology, we plan to release several new Platform solutions to enhance the research workflows described above and add new solutions to support the analysis functions that exist in our typical customer base.
Our Platforms are deployed as a single, multi-tenant system across our entire customer base. Customers securely access the Platform through online web interfaces and via web service APIs that enable customers to leverage Platform features and functionality from within in-house and third-party software systems. The Platform can also be configured to satisfy a customer’s individual preferences. We leverage our Platform efficiencies in scalability, stability and development costs to fuel rapid innovation and to gain a competitive advantage.
Transactions
We provide our researchers with a single source to the universe of published STM content that includes over
Core to many of our Platform solutions is providing our customers with ways to find and download digital versions of STM articles that are critical to their research. Customers submit orders for the articles they need which we source and electronically deliver to them generally in under an hour; in most cases under one minute. This service is generally known in the industry as single article delivery or document delivery. We also obtain the necessary permission licenses from the content publisher or other rights holder so that our customer’s use complies with applicable copyright laws. We have arrangements with hundreds of content publishers that allow us to distribute their content. The majority of these publishers provide us with electronic access to their content, which allows us to electronically deliver single articles to our customers often in a matter of minutes. While a vast majority of the articles are available in electronic form, the Company also has workflows to deliver older paper-based articles through relationships we have built with libraries around the world.
Principles of Consolidation
The accompanying financial statements are consolidated and include the accounts of the Company and its wholly-owned subsidiaries. Intercompany balances and transactions have been eliminated in consolidation.
Basis of Presentation
The accompanying condensed consolidated financial statements are unaudited. These unaudited interim condensed consolidated financial statements have been prepared in accordance with accounting principles generally accepted in the United States (“GAAP”) and applicable rules and regulations of the Securities and Exchange Commission (“SEC”) regarding interim financial reporting. Certain information and note disclosures normally included in the financial statements prepared in accordance with GAAP have been condensed or omitted pursuant to such rules and regulations. Accordingly, these interim condensed consolidated financial statements should be read in conjunction with the consolidated financial statements and notes thereto contained in the Company’s Annual Report on Form 10-K for the fiscal year ended June 30, 2023 filed with the SEC. The condensed consolidated balance sheet as of June 30, 2023 included herein was derived from the audited consolidated financial statements as of that date, but does not include all disclosures, including notes, required by GAAP.
9
In the opinion of management, the accompanying unaudited condensed consolidated financial statements contain all adjustments necessary to fairly present the Company’s financial position and results of operations for the interim periods reflected. Except as noted, all adjustments contained herein are of a normal recurring nature. Results of operations for the fiscal periods presented herein are not necessarily indicative of fiscal year-end results.
Note 2. Summary of Significant Accounting Policies
Use of Estimates
The preparation of financial statements in conformity with GAAP requires management to make estimates and assumptions that affect the reported amounts of assets and liabilities and disclosures of contingent assets and liabilities at the date of the financial statements and the reported amounts of revenue and expenses during the reporting periods. Actual results could differ from these estimates.
These estimates and assumptions include estimates for reserves of uncollectible accounts, accruals for potential liabilities, assumptions made in valuing equity instruments issued for services or acquisitions, impairment related to intangible assets, useful lives of finite-lived intangible assets, and realization of deferred tax assets.
Concentration of Credit Risk
Financial instruments, which potentially subject the Company to concentrations of credit risk, consist of cash and cash equivalents and accounts receivable. The Company places its cash with high quality financial institutions and at times may exceed the FDIC $
Cash denominated in Euros and British Pounds with an aggregate US Dollar equivalent of $
The Company has no customers that represent 10% of revenue or more for the three and six months ended December 31, 2023 and 2022.
The Company has no customers that accounted for greater than 10% of accounts receivable at December 31, 2023 and June 30, 2023.
The following table summarizes vendor concentrations:
Three Months Ended |
| Six Months Ended |
| ||||||||||
December 31, |
| December 31, |
| ||||||||||
| 2023 |
|
| 2022 | 2023 |
|
| 2022 | |||||
Vendor A | | % | | % | | % | | % | |||||
Vendor B | | % | | % | | % | | % | |||||
Revenue Recognition
The Company accounts for revenue in accordance with Financial Accounting Standard Board’s (“FASB”) Accounting Standards Codification (“ASC”) Topic 606, Revenue from Contracts with Customers (Topic 606), (“ASC 606”). The underlying principle of ASC 606 is to recognize revenue to depict the transfer of goods or services to customers at the amount expected to be collected.
Revenues are recognized when control of the promised goods or services are transferred to a customer, in an amount that reflects the consideration that the Company expects to receive in exchange for those goods or services. The Company derives its revenues from
10
features of our cloud-based SaaS research intelligence platforms (Platforms) and the transactional sale of STM content managed, sourced and delivered through the Platform (Transactions).
The Company applies the following five steps in order to determine the appropriate amount of revenue to be recognized as it fulfills its obligations under each of its agreements:
| ● | identify the contract with a customer; |
| ● | identify the performance obligations in the contract; |
| ● | determine the transaction price; |
| ● | allocate the transaction price to performance obligations in the contract; and |
| ● | recognize revenue as the performance obligation is satisfied. |
Platforms
We charge a subscription fee that allows customers to access and utilize certain premium features of our Platforms. Revenue is recognized ratably over the term of the subscription agreement, which is typically one year, provided all other revenue recognition criteria have been met. Billings or payments received in advance of revenue recognition are recorded as deferred revenue.
Transactions
We charge a transactional service fee for the electronic delivery of single articles, and a corresponding copyright fee for the permitted use of the content. We recognize revenue from single article delivery services upon delivery to the customer provided all other revenue recognition criteria have been met.
Revenue by Geographical Region
The following table summarizes revenue by geographical region:
Three Months Ended |
| |||||||||||
December 31, |
| |||||||||||
2023 |
| 2022 | ||||||||||
United States | $ | |
| | % | $ | | | % | |||
Europe |
| |
| | % |
| |
| | % | ||
Rest of World |
| |
| | % |
| |
| | % | ||
Total | $ | |
| | % | $ | |
| | % | ||
11
Six Months Ended | ||||||||||||
December 31, | ||||||||||||
2023 |
| 2022 | ||||||||||
United States | $ | |
| | % | $ | | | % | |||
Europe |
| |
| | % |
| |
| | % | ||
Rest of World |
| |
| | % |
| |
| | % | ||
Total | $ | |
| | % | $ | |
| | % | ||
Accounts Receivable by Geographical Region
The following table summarizes accounts receivable by geographical region:
As of December 31, 2023 |
| As of June 30, 2023 | ||||||||||
United States |
| $ | |
| | % | $ | | | % | ||
Europe |
| |
| | % |
| |
| | % | ||
Rest of World |
| |
| | % |
| |
| | % | ||
Total | $ | |
| | % | $ | |
| | % | ||
Business Combinations
The Company accounts for its business combinations using the acquisition method of accounting where the purchase consideration is allocated to the tangible and intangible assets acquired, and liabilities assumed, based on their respective fair values as of the acquisition date. The excess of the fair value of the purchase consideration over the estimated fair values of the net assets acquired is recorded as goodwill. When determining the fair values of assets acquired and liabilities assumed, management makes significant estimates and assumptions, especially with respect to intangible assets. Critical estimates in valuing intangible assets include, but are not limited to, expected future cash flows, which includes consideration of future growth and margins, future changes in technology, brand awareness and discount rates. Fair value estimates are based on the assumptions that management believes a market participant would use in pricing the asset or liability.
Intangible Assets
Amortizable finite-lived identifiable intangible assets consist of a developed technology and customer relationships acquired in the acquisition of ResoluteAI effective July 28, 2023 and Scite effective December 1, 2023 (See Note 5), and are stated at cost less accumulated amortization. The developed technology and customer relationships are being amortized over the estimated average useful lives of
Goodwill
Goodwill consists of the excess of the cost of ResoluteAI and Scite (see Note 5) over the fair value of amounts assigned to assets acquired and liabilities assumed. Under the guidance of ASC 350, goodwill is not amortized, rather it is tested for impairment annually, and will be tested for impairment between annual tests if an event occurs or circumstances change that would indicate the carrying amount may be impaired. An impairment loss generally would be recognized when the carrying amount of the reporting unit’s net assets exceeds the estimated fair value of the reporting unit and would be measured as the excess carrying value of goodwill over the derived fair value of goodwill. The Company’s policy is to perform an annual impairment testing for its reporting units on June 30 of each fiscal year.
12
Deferred Revenue
Contract liabilities, such as deferred revenue, exist where the Company has the obligation to transfer services to a customer for which the entity has received consideration, or when the consideration is due, from the customer.
Cash payments received or due in advance of performance are recorded as deferred revenue. Deferred revenue is primarily comprised of cloud-based software subscriptions which are generally billed in advance. The deferred revenue balance is presented as a current liability on the Company's consolidated balance sheets.
Cost of Revenue
Platforms
Cost of Platform revenue consists primarily of personnel costs of our operations team, and to a lesser extent managed hosting providers and other third-party service and data providers.
Transactions
Cost of Transaction revenue consists primarily of the respective copyright fee for the permitted use of the content, less a discount in most cases, and to a much lesser extent, personnel costs of our operations team and third-party service providers.
Stock-Based Compensation
The Company periodically issues stock options and restricted stock awards to employees and non-employees for services. The Company accounts for such grants issued and vesting based on ASC 718, whereby the value of the award is measured on the date of grant and recognized as compensation expense on the straight-line basis over the vesting period. The Company recognizes the fair value of stock-based compensation within its Statements of Operations with classification depending on the nature of the services rendered.
Under ASC 718, Repurchase or Cancellation of equity awards, the amount of cash or other assets transferred (or liabilities incurred) to repurchase an equity award shall be charged to equity, to the extent that the amount paid does not exceed the fair value of the equity instruments repurchased at the repurchase date. Any excess of the repurchase price over the fair value of the instruments repurchased shall be recognized as additional compensation cost.
Foreign Currency
The accompanying condensed consolidated financial statements are presented in United States dollars, the functional currency of the Company. Capital accounts of foreign subsidiaries are translated into US Dollars from foreign currency at their historical exchange rates when the capital transactions occurred. Assets and liabilities are translated at the exchange rate as of the balance sheet date. Income and expenditures are translated at the average exchange rate of the period. Although the majority of our revenue and costs are in US dollars, the costs of Reprints Desk Latin America and ResSoL LA are in Mexican Pesos. As a result, currency exchange fluctuations may impact our revenue and the costs of our operations. We currently do not engage in any currency hedging activities.
Gains and losses from foreign currency transactions, which result from a change in exchange rates between the functional currency and the currency in which a foreign currency transaction is denominated, are included in selling, general and administrative expenses and amounted to gains of $
13
The following table summarizes the exchange rates used:
Six Months Ended |
| Year Ended | ||||||
December 31, |
| June 30, | ||||||
|
| 2023 |
| 2022 |
| 2023 |
| 2022 |
Period end Euro : US Dollar exchange rate | | | | | ||||
Average period Euro : US Dollar exchange rate |
| |
| | |
| | |
Period end GBP : US Dollar exchange rate | | | | | ||||
Average period GBP : US Dollar exchange rate |
| |
| | |
| | |
|
|
|
|
|
|
| ||
Period end Mexican Peso : US Dollar exchange rate |
| |
| | |
| | |
Average period Mexican Peso : US Dollar exchange rate |
| |
| | |
| | |
Net Income (Loss) Per Share
Basic net income (loss) per share is computed by dividing net income (loss) by the weighted average number of common shares outstanding for the period, excluding shares of unvested restricted common stock. Shares of restricted stock are included in the basic weighted average number of common shares outstanding from the time they vest. Diluted earnings per share is computed by dividing the net income applicable to common stockholders by the weighted average number of common shares outstanding plus the number of additional common shares that would have been outstanding if all dilutive potential common shares had been issued, using the treasury stock method. Shares of restricted stock are included in the diluted weighted average number of common shares outstanding from the date they are granted. Potential common shares are excluded from the computation when their effect is antidilutive. At December 31, 2023 potentially dilutive securities include options to acquire
Basic and diluted net loss per common share is the same for the three and six months ended December 31, 2023 and 2022 because all stock options, warrants, and unvested restricted common stock are anti-dilutive.
Recently Issued Accounting Pronouncements
In June 2016, the FASB issued ASU 2016-13, Measurement of Credit Losses on Financial Instruments. ASU 2016-13 requires entities to use a forward-looking approach based on current expected credit losses (“CECL”) to estimate credit losses on certain types of financial instruments, including trade receivables. This may result in the earlier recognition of allowances for losses. ASU 2016-13 is effective for the Company beginning July 1, 2023, and early adoption is permitted. The Company adopted this standard effective July 1, 2023, and there was no material impact of adopting this standard on the Company’s financial statements and related disclosures.
Other recent accounting pronouncements issued by the FASB, including its Emerging Issues Task Force, the American Institute of Certified Public Accountants, and the Securities and Exchange Commission did not or are not believed by management to have a material impact on the Company’s present or future consolidated financial statements.
Note 3. Line of Credit
The Company entered into a Loan and Security Agreement with Silicon Valley Bank (“SVB”) on July 23, 2010, which, as amended, provides for a revolving line of credit for the lesser of $
14
Pursuant to the Amended and Restated Loan and Security Agreement dated October 31, 2017 among the Company, Reprints Desk, Inc. and SVB (the “SVB LSA”), the Company was required to direct account debtors to deliver or transmit all proceeds of accounts remitted to the Company and its subsidiaries into a lockbox account as specified by SVB, and to maintain its and its subsidiaries’ primary operating and other deposit accounts with SVB.
There were
SVB Bridge Bank agreed that the Company can lower its cash balance threshold requirement associated with the SVB LSA, reducing the required balances of its and its subsidiaries’ primary operating and other accounts with SVB, and the Company continues to evaluate the SVB LSA. The Company has established additional banking relationships with Bank of America, N.A. and PNC Bank, N.A. At December 31, 2023, the Company held cash at Bank of America, N.A. of $
Subsequent to September 30, 2023, FCB informed the Company of certain defaults under the SVB LSA resulting from the Company’s violation of certain covenants regarding retaining operating cash with SVB, obtaining deposit account control agreements with respect to such accounts and failing to maintain the required adjusted quick ratio. The Company became aware of additional technical defaults following FCB’s outreach, and such defaults substantially related to the Company’s moves to promptly diversify its cash position following the collapse of Silicon Valley Bank in March of 2023. On November 14, 2023, the Company, Reprints Desk and FCB entered into a Fifth Amendment to Amended and Restated Loan and Security Agreement, Consent and Forbearance Agreement (the “Fifth Amendment”) pursuant to which, among other matters, FCB agreed to forbear from exercising its remedies under the SVB LSA in connection with the existing events of default, and agreed to waive the existing events of default provided the Company regains compliance with the adjusted quick ratio covenant and the operating accounts covenants by January 30, 2024, no other events of defaults have occurred and no forbearance termination events (as listed in the Fifth Amendment) have occurred.
Note 4. Stockholders’ Equity
Stock Options
In December 2007, we established the 2007 Equity Compensation Plan (the “2007 Plan”) and in November 2017 we established the 2017 Omnibus Incentive Plan (the “2017 Plan”), collectively (the “Plans”). The Plans were approved by our board of directors and stockholders. The purpose of the Plans is to grant stock and options to purchase our common stock, and other incentive awards, to our employees, directors and key consultants. On November 10, 2016, the maximum number of shares of common stock that may be issued pursuant to awards granted under the 2007 Plan increased from
15
under the 2007 Plan, and all incentive stock award grants after the adoption of the 2017 Plan on November 21, 2017 were made under the 2017 Plan.
The majority of awards issued under the Plan vest immediately or over , with a
The following table summarizes vested and unvested stock option activity:
All Options | Vested Options | Unvested Options | |||||||||||||
|
|
| Weighted |
|
| Weighted |
|
| Weighted | ||||||
Average | Average | Average | |||||||||||||
Exercise | Exercise | Exercise | |||||||||||||
Shares | Price | Shares | Price | Shares | Price | ||||||||||
Outstanding at June 30, 2023 |
| |
| $ | |
| |
| $ | |
| |
| $ | |
Granted |
| |
| |
| — |
| — |
| |
| | |||
Options vesting |
| — |
| — |
| |
| |
| ( |
| | |||
Exercised |
| ( |
| |
| ( |
| |
| — |
| — | |||
Forfeited |
| — |
| — |
| — |
| — |
| — |
| — | |||
Outstanding at December 31, 2023 |
| | $ | |
| | $ | |
| | $ | | |||
The weighted average remaining contractual life of all options outstanding as of December 31, 2023 was
During the six months ended December 31, 2023, the Company granted
16
The following table presents the information regarding stock options outstanding and exercisable as of December 31, 2023:
Option |
|
| Remaining |
| |||
Exercise | Options | Contractual | Options | ||||
Price | Outstanding | Life (in years) | Exercisable | ||||
$ | |
| |
|
| | |
|
| |
|
| | ||
|
| |
|
| | ||
|
| |
|
| | ||
|
| |
|
| | ||
|
| |
|
| | ||
|
| |
|
| | ||
|
| |
|
| | ||
|
| |
|
| | ||
|
| |
|
| | ||
| | | |||||
| | | |||||
| | | |||||
| | | |||||
| | | |||||
|
| |
|
| | ||
| | | |||||
| | | |||||
| | | |||||
| | | |||||
| | | |||||
| | | |||||
| | — | |||||
| | | |||||
| | | |||||
| | | |||||
Total |
Restricted Common Stock
Prior to July 1, 2023, the Company issued
17
During the six months ended December 31, 2023, the Company issued an additional
•
•
•
•
•
Upon a change of control, vesting will accelerate with respect to that portion of the award that would vest if the target 30-day VWAP was achieved at the level above the per share price in such change of control transaction. For example, if we granted an award of
As the vesting of the
The following table summarizes restricted common stock activity:
|
|
|
| Weighted | ||||
Average | ||||||||
Number of | Grant Date | |||||||
Shares | Fair Value | Fair Value | ||||||
Non-vested, June 30, 2023 |
| | $ | | $ | | ||
Granted |
| |
| |
| | ||
Vested |
| ( |
| ( |
| | ||
Forfeited |
| — |
| — |
| — | ||
Non-vested, December 31, 2023 |
| | $ | | $ | | ||
18
Common Stock Repurchases
Effective as of February 9, 2021, the Compensation Committee of our Board of Directors authorized the repurchase, during calendar year 2021 on the last day of each trading window and otherwise in accordance with our insider trading policies, of up to $
During the six months ended December 31, 2023, the Company repurchased
Shares repurchased are retired and deducted from common stock for par value and from additional paid in capital for the excess over par value. Direct costs incurred to acquire the shares are included in the total cost of the shares.
Note 5. Acquisitions
FIZ
On September 28, 2022, Reprints Desk entered into an asset purchase agreement with FIZ Karlsruhe – Leibniz-Institut für Informationsinfrastruktur GmbH (“FIZ”). FIZ delivers STM content pursuant to various contracts with its customers through its AutoDoc platform. FIZ agreed to assign and transfer to Reprints Desk certain of these contracts effective January 1, 2023 (the “Sold Contracts”).
On September 30, 2022, Reprints Desk made a non-refundable payment of $
The current contingent consideration for the Base Amount Plus and the Bonus Amount is recorded as a short-term liability on the balance sheet. At December 31, 2023, the Base Amount, the Base Amount Plus and the Bonus Amount were recorded as intangible assets on the balance sheet with an estimated average useful life of
ResoluteAI
On July 28, 2023, the Company acquired
The Company utilized the acquisition method of accounting for the acquisition in accordance with ASC 805, Business Combinations. The Company allocated the purchase price to ResoluteAI’s tangible assets, identifiable intangible assets, and assumed liabilities at their estimated fair values as of the date of acquisition. The excess of the purchase price paid by the Company over the estimated fair value of identified tangible and intangible assets has been recorded as provisional goodwill.
19
The total purchase consideration for ResoluteAI, net of cash acquired, was approximately $
The Company’s allocation of the purchase price at December 31, 2023 included $
The preliminary allocation of purchase price to the assets acquired and liabilities assumed was based upon the estimated fair values at the date of acquisition. As of December 31, 2023, the Company has not completed its analysis for estimating the fair value of the assets acquired and liabilities assumed.
Scite
On December 1, 2023, the Company acquired
The total purchase consideration for Scite, net of cash acquired, was approximately $
The Company’s allocation of the purchase price at December 31, 2023 included $
The preliminary allocation of purchase price to the assets acquired and liabilities assumed was based upon the estimated fair values at the date of acquisition. As of December 31, 2023, the Company has not completed its analysis for estimating the fair value of the assets acquired and liabilities assumed.
20
The following sets out the unaudited pro forma operating results for the three and six months ended December 31, 2023 and 2022 for the Company had the acquisition occurred as of July 1, 2022. These amounts include amortization of intangible assets:
Pro Forma (Unaudited) | Pro Forma (Unaudited) | |||||||||||
Three Months ended December 31, | Six Months ended December 31, | |||||||||||
|
| 2023 |
| 2022 |
| 2023 |
| 2022 | ||||
| ||||||||||||
Revenue | $ | | $ | | $ | | $ | | ||||
Cost of revenue |
| |
| |
| |
| | ||||
Gross profit |
| |
| |
| |
| | ||||
|
|
|
|
|
|
|
| |||||
Total operating expenses |
| |
| |
| |
| | ||||
Loss from operations |
| ( |
| ( |
| ( |
| ( | ||||
|
|
|
|
|
|
|
| |||||
Other income |
| |
| |
| |
| | ||||
|
|
|
|
|
|
|
| |||||
Income (loss) from operations before provision for income taxes |
| |
| ( |
| ( |
| ( | ||||
Provision for income taxes |
| ( |
| ( |
| ( |
| ( | ||||
|
|
|
|
|
|
|
| |||||
Pro Forma Net loss | $ | ( | $ | ( | $ | ( | $ | ( | ||||
Pro Forma Net loss per weighted average share, basic and diluted | ( | ( | ( | |||||||||
Note 6. Contingencies
Inflation Risk
The Company does not believe that inflation has had a material effect on its operations to date, other than its impact on the general economy. However, there is a risk that the Company’s operating costs could become subject to inflationary and interest rate pressures in the future, which would have the effect of increasing the Company’s operating costs, and which would put additional stress on the Company’s working capital resources.
Note 7. Subsequent Events
On January 5, 2024, the Company issued
21
Item 2. Management’s Discussion and Analysis of Financial Condition and Results of Operations
Cautionary Notice Regarding Forward-Looking Statements
The following discussion and analysis of our financial condition and results of operations for the three and six months ended December 31, 2023 and 2022 should be read in conjunction with our consolidated financial statements and related notes to those financial statements that are included elsewhere in this report. Our discussion includes forward-looking statements based upon current expectations that involve risks and uncertainties, such as our plans, objectives, expectations, and intentions. Actual results and the timing of events could differ materially from those anticipated in these forward-looking statements as a result of a number of factors, including those set forth under “Risk Factors” in our Annual Report on Form 10-K for the fiscal year ended June 30, 2023.
We use words such as “anticipate,” “estimate,” “plan,” “project,” “continuing,” “ongoing,” “expect,” “believe,” “intend,” “may,” “will,” “should,” “could,” and similar expressions to identify forward-looking statements. All forward-looking statements included in this report are based on information available to us on the date hereof and, except as required by law, we assume no obligation to update any such forward-looking statements.
Overview
Research Solutions was incorporated in the State of Nevada on November 2, 2006, and is a publicly traded holding company with five wholly owned subsidiaries as of December 31, 2023: Reprints Desk, Inc., a Delaware corporation, including its wholly owned subsidiary Resolute Innovation, Inc., a Delaware corporation, Scite, LLC., a Delaware Limited Liability Company, Reprints Desk Latin America S. de R.L. de C.V, an entity organized under the laws of Mexico, and RESSOL LA, S. DE R.L. DE C.V., an entity organized under the laws of Mexico.
We provide software and related services to help research intensive organizations save time and money. We offer various software platforms (“Platform” or “Platforms”) that are typically sold to corporate, academic, government and individual researchers as cloud-based software-as-a-service (“SaaS”) via auto-renewing license agreements. Corporate, academic, and government customers typically sign up under annual agreements. Individual researchers can sign up under an annual or a month-to-month agreement and are typically billed monthly. Our Platforms also facilitate the sale of published scientific, technical, and medical (“STM”) content sold as individual articles (“Transactions”) either stand alone or via one or more of the research Platform solutions we provide. When one or more of the Platform solutions are used to purchase Transactions, customers pay for those transactions through monthly billing or via credit card for individual researchers. Our Platforms enable life science and other research-intensive organizations to accelerate their research and development activities through our advanced discovery tools (i.e. search), tools to access and buy STM articles required to support their research (i.e. acquire), as well as tools that manage that content across the enterprise and on an individual basis (i.e. manage). The Platforms typically deliver an ROI to the customer by reducing the amount of time it takes a research organization to find, acquire and manage content, in addition to also driving down the ultimate cost per article over time.
Platforms
Our cloud-based SaaS Platforms consist of proprietary software and Internet-based interfaces sold to customers through an annual or monthly subscription fee. Legacy functionality falls into three areas.
Discover – These solutions facilitate search (discovery) across virtually all STM articles available. The solutions we offer include free (basic) search solutions and advanced search tools like the Resolute.ai and scite.ai products. These tools allow for searching and identifying relevant research and then purchasing that research through one of our other solutions. In addition, these tools increasingly enable users to find insights in other datasets adjacent to STM content, such as Clinical Trial, Patent, Life Science & MedTech Regulatory information, Competitor and Technology landscape insights in addition to searching the customer’s internal datasets. The advanced search solutions are sold through a seat, enterprise, or individual license.
22
Acquire – Our Article Galaxy (AG) solution allows for research organizations to load their entitlements (subscriptions, discount or token packages, and their existing library of articles) and AG manages those entitlements in the background enabling the researchers to focus on acquiring articles they need quickly and efficiently at the lowest possible cost. When used in conjunction with our discovery Platforms, customers can initiate orders, route orders based on the lowest cost to acquire, obtain spend and usage reporting, automate authentication, and connect seamlessly to in-house and third-party software systems.
Manage – Our References solution allows users to access the article inside the Platform including setting up personal folders or team folders and allows researchers to markup and take notes on the articles in a supported browser on a desktop or tablet.
We use Artificial Intelligence (“AI”) in several parts of the research workflow today and will continually add capability as we move forward. Today we offer an AI based recommendation engine in our Discover, Acquire, and Manage Platform solutions. We also offer an AI based “assistant” in some of our solutions to allow the researcher to ask questions about articles, groups of articles (folders), and more. We also have the capability to provide full text search on STM content in the scite.ai Platform where the publisher gives us the rights to do so.
Using Resolute.ai and scite.ai technology, we plan to release several new Platform solutions to enhance the research workflows described above and add new solutions to support the analysis functions that exist in our typical customer base.
Our Platforms are deployed as a single, multi-tenant system across our entire customer base. Customers securely access the Platform through online web interfaces and via web service APIs that enable customers to leverage Platform features and functionality from within in-house and third-party software systems. The Platform can also be configured to satisfy a customer’s individual preferences. We leverage our Platform efficiencies in scalability, stability and development costs to fuel rapid innovation and to gain a competitive advantage.
Transactions
We provide our researchers with a single source to the universe of published STM content that includes over 100 million existing STM articles and over 2 to 4 million newly published STM articles each year. STM content is sold to our customers on a per transaction basis. Researchers and knowledge workers in life science and other research-intensive organizations generally require single copies of published STM journal articles for use in their research activities. These individuals are our primary users and while they typically purchase the articles via one of our Platform solutions, we do have some customers that just order articles from us on behalf of end-users in their organizations.
Core to many of our Platform solutions is providing our customers with ways to find and download digital versions of STM articles that are critical to their research. Customers submit orders for the articles they need which we source and electronically deliver to them generally in under an hour; in most cases under one minute. This service is generally known in the industry as single article delivery or document delivery. We also obtain the necessary permission licenses from the content publisher or other rights holder so that our customer’s use complies with applicable copyright laws. We have arrangements with hundreds of content publishers that allow us to distribute their content. The majority of these publishers provide us with electronic access to their content, which allows us to electronically deliver single articles to our customers often in a matter of minutes. While a vast majority of the articles are available in electronic form, the Company also has workflows to deliver older paper-based articles through relationships we have built with libraries around the world.
Inflation Risk
We do not believe that inflation has had a material effect on its operations to date, other than its impact on the general economy. However, there is a risk that our operating costs could become subject to inflationary and interest rate
23
pressures in the future, which would have the effect of increasing our operating costs, and which would put additional stress on our working capital resources.
Critical Accounting Policies and Estimates
The preparation of our consolidated financial statements in conformity with accounting principles generally accepted in the United States, or GAAP, requires us to make estimates and assumptions that affect the reported amounts of assets, liabilities, revenue and expenses, and related disclosure of contingent assets and liabilities. When making these estimates and assumptions, we consider our historical experience, our knowledge of economic and market factors and various other factors that we believe to be reasonable under the circumstances. Actual results may differ under different estimates and assumptions.
The accounting estimates and assumptions discussed in this section are those that we consider to be the most critical to an understanding of our financial statements because they inherently involve significant judgments and uncertainties.
Revenue Recognition
We account for revenue in accordance with ASU 2014-09, Revenue from Contracts with Customers (Topic 606), (“ASC 606”). The underlying principle of ASC 606 is to recognize revenue to depict the transfer of goods or services to customers at the amount expected to be collected.
Revenues are recognized when control of the promised goods or services are transferred to a customer, in an amount that reflects the consideration that we expect to receive in exchange for those goods or services. We derive our revenues from two sources: annual licenses that allow customers to access and utilize certain premium features of our cloud-based SaaS research intelligence platforms (Platforms) and the transactional sale of STM content managed, sourced and delivered through the Platform (Transactions).
We apply the following five steps in order to determine the appropriate amount of revenue to be recognized as we fulfill our obligations under each of our agreements:
| ● | identify the contract with a customer; |
| ● | identify the performance obligations in the contract; |
| ● | determine the transaction price; |
| ● | allocate the transaction price to performance obligations in the contract; and |
| ● | recognize revenue as the performance obligation is satisfied. |
24
Platforms
We charge a subscription fee that allows customers to access and utilize certain premium features of our Platforms. Revenue is recognized ratably over the term of the subscription agreement, which is typically one year, provided all other revenue recognition criteria have been met. Billings or payments received in advance of revenue recognition are recorded as deferred revenue.
Transactions
We charge a transactional service fee for the electronic delivery of single articles, and a corresponding copyright fee for the permitted use of the content. We recognize revenue from single article delivery services upon delivery to the customer provided all other revenue recognition criteria have been met.
Stock-Based Compensation
The fair value of our stock options is estimated using the Black-Scholes-Merton Option Pricing model, which uses certain assumptions related to risk-free interest rates, expected volatility, expected life of the stock options or restricted stock, and future dividends. Compensation expense is recorded based upon the value derived from the Black-Scholes-Merton Option Pricing model and based on actual experience. The assumptions used in the Black-Scholes-Merton Option Pricing model could materially affect compensation expense recorded in future periods.
Recent Accounting Pronouncements
Please refer to footnote 2 to the condensed consolidated financial statements contained elsewhere in this Form 10-Q for a discussion of Recent Accounting Pronouncements.
Quarterly Information (Unaudited)
The following table sets forth unaudited and quarterly financial data for the most recent eight quarters:
| Dec. 31, | Sept. 30, |
| June 30, | Mar. 31, |
| Dec. 31, |
| Sept. 30, |
| June 30, |
| Mar. 31, | |||||||||||
2023 |
| 2023 |
| 2023 |
| 2023 |
| 2022 |
| 2022 |
| 2022 |
| 2022 | ||||||||||
Revenue: |
|
|
|
|
|
|
|
|
|
|
|
|
|
| ||||||||||
Platforms | $ | 3,125,584 | $ | 2,600,192 | $ | 2,303,375 | $ | 2,249,632 | $ | 2,110,272 | $ | 2,019,967 | $ | 1,886,845 | $ | 1,786,224 | ||||||||
Transactions |
| 7,188,158 |
| 7,460,779 |
| 7,656,342 |
| 8,092,794 |
| 6,606,394 |
| 6,664,676 |
| 6,675,164 |
| 6,971,128 | ||||||||
Total revenue |
| 10,313,742 |
| 10,060,971 |
| 9,959,717 |
| 10,342,426 |
| 8,716,666 |
| 8,684,643 |
| 8,562,009 |
| 8,757,352 | ||||||||
Cost of revenue: |
|
|
|
|
|
|
|
|
|
|
|
|
|
|
|
| ||||||||
Platforms |
| 486,185 |
| 382,615 |
| 275,110 |
| 268,630 |
| 253,073 |
| 230,473 |
| 240,214 |
| 219,051 | ||||||||
Transactions |
| 5,343,755 |
| 5,646,791 |
| 5,764,064 |
| 6,046,523 |
| 5,059,766 |
| 5,104,922 |
| 5,038,653 |
| 5,299,804 | ||||||||
Total cost of revenue |
| 5,829,940 |
| 6,029,406 |
| 6,039,174 |
| 6,315,153 |
| 5,312,839 |
| 5,335,395 |
| 5,278,867 |
| 5,518,855 | ||||||||
Gross profit: |
|
|
|
|
|
|
|
|
|
|
|
|
| |||||||||||
Platforms |
| 2,639,399 |
| 2,217,577 |
| 2,028,265 |
| 1,981,002 |
| 1,857,199 |
| 1,789,494 |
| 1,646,631 |
| 1,567,173 | ||||||||
Transactions |
| 1,844,403 |
| 1,813,988 |
| 1,892,278 |
| 2,046,271 |
| 1,546,628 |
| 1,559,754 |
| 1,636,511 |
| 1,671,324 | ||||||||
Total gross profit |
| 4,483,802 |
| 4,031,565 |
| 3,920,543 |
| 4,027,273 |
| 3,403,827 |
| 3,349,248 |
| 3,283,142 |
| 3,238,497 | ||||||||
Operating expenses: |
|
|
|
|
|
|
|
|
|
|
|
|
|
|
|
| ||||||||
Sales and marketing |
| 804,927 |
| 685,016 |
| 455,030 |
| 642,624 |
| 666,608 |
| 521,216 |
| 691,368 |
| 543,496 | ||||||||
Technology and product dev. |
| 1,336,558 |
| 1,244,579 |
| 991,093 |
| 953,677 |
| 922,132 |
| 875,290 |
| 1,049,430 |
| 971,959 | ||||||||
General and administrative |
| 2,023,848 |
| 2,542,868 |
| 1,649,333 |
| 1,871,590 |
| 1,613,664 |
| 1,519,424 |
| 1,663,671 |
| 1,629,371 | ||||||||
Depreciation and amortization |
| 155,749 |
| 59,620 |
| 22,163 |
| 18,332 |
| 6,342 |
| 5,812 |
| 5,507 |
| 4,988 | ||||||||
Stock-based comp. expense |
| 596,455 |
| 591,814 |
| 585,384 |
| 480,458 |
| 608,703 |
| 175,361 |
| 225,501 |
| 399,234 | ||||||||
Foreign currency transaction loss (gain) |
| (13,738) |
| 6,620 |
| (37,743) |
| (72,547) |
| (84,179) |
| 72,516 |
| 91,279 |
| 29,394 | ||||||||
Total operating expenses |
| 4,903,799 |
| 5,130,517 |
| 3,665,260 |
| 3,894,134 |
| 3,733,270 |
| 3,169,619 |
| 3,726,756 |
| 3,578,442 | ||||||||
Other income (expenses and income taxes) |
| 366,369 |
| 110,909 |
| 120,463 |
| 103,703 |
| 73,913 |
| 34,936 |
| 5,347 |
| (585) | ||||||||
Net income (loss) |
| (53,628) |
| (988,043) |
| 375,746 |
| 236,842 |
| (255,530) |
| 214,565 |
| (438,267) |
| (340,530) | ||||||||
Basic income (loss) per common share: |
|
|
|
|
|
|
|
|
|
|
|
|
|
|
|
| ||||||||
Net income (loss) per share | $ | - | $ | (0.04) | $ | 0.01 | $ | 0.01 | $ | (0.01) | $ | 0.01 | $ | (0.02) | $ | (0.01) | ||||||||
Basic weighted average common shares outstanding |
| 28,092,945 |
| 27,052,445 |
| 26,981,813 |
| 26,929,314 |
| 26,816,550 |
| 26,718,171 |
| 26,576,054 |
| 26,512,195 | ||||||||
Diluted income (loss) per common share: |
|
|
|
|
|
|
|
|
|
|
|
|
|
|
|
| ||||||||
Net income (loss) per share | $ | - | $ | (0.04) | $ | 0.01 | $ | 0.01 | $ | (0.01) | $ | 0.01 | $ | (0.02) | $ | (0.01) | ||||||||
Diluted weighted average common shares outstanding |
| 28,092,945 |
| 27,052,445 |
| 30,058,791 |
| 29,791,719 |
| 26,815,550 |
| 27,779,841 |
| 26,576,054 |
| 26,512,195 | ||||||||
25
Comparison of the Three and Six Months Ended December 31, 2023 and 2022
Results of Operations
Three Months Ended December 31, |
| |||||||||||
| 2023 |
| 2022 |
| $ Change |
| % Change |
| ||||
Revenue: |
|
|
|
|
|
|
|
| ||||
Platforms | $ | 3,125,584 | $ | 2,110,272 | $ | 1,015,312 |
| 48.1 | % | |||
Transactions |
| 7,188,158 |
| 6,606,394 |
| 581,764 |
| 8.8 | % | |||
Total revenue |
| 10,313,742 |
| 8,716,666 |
| 1,597,076 |
| 18.3 | % | |||
Cost of revenue: |
|
|
|
|
|
|
|
| ||||
Platforms |
| 486,185 |
| 253,073 |
| 233,112 |
| 92.1 | % | |||
Transactions |
| 5,343,755 |
| 5,059,766 |
| 283,989 |
| 5.6 | % | |||
Total cost of revenue |
| 5,829,940 |
| 5,312,839 |
| 517,101 |
| 9.7 | % | |||
Gross profit: |
|
|
|
|
|
|
|
| ||||
Platforms |
| 2,639,399 |
| 1,857,199 |
| 782,200 |
| 42.1 | % | |||
Transactions |
| 1,844,403 |
| 1,546,628 |
| 297,775 |
| 19.3 | % | |||
Total gross profit |
| 4,483,802 |
| 3,403,827 |
| 1,079,975 |
| 31.7 | % | |||
Operating expenses: |
|
|
|
|
|
|
|
| ||||
Sales and marketing |
| 804,927 |
| 666,608 |
| 138,319 |
| 20.7 | % | |||
Technology and product development |
| 1,336,558 |
| 922,132 |
| 414,426 |
| 44.9 | % | |||
General and administrative |
| 2,023,848 |
| 1,613,664 |
| 410,184 |
| 25.4 | % | |||
Depreciation and amortization |
| 155,749 |
| 6,342 |
| 149,407 |
| 2,355.8 | % | |||
Stock-based compensation expense |
| 596,455 |
| 608,703 |
| (12,248) |
| (2.0) | % | |||
Foreign currency transaction gain |
| (13,738) |
| (84,179) |
| 70,441 |
| 83.7 | % | |||
Total operating expenses |
| 4,903,799 |
| 3,733,270 |
| 1,170,529 |
| 31.4 | % | |||
Loss from operations |
| (419,997) |
| (329,443) |
| (90,554) |
| (27.5) | % | |||
Other income |
| 376,426 |
| 74,695 |
| 301,731 |
| 404.0 | % | |||
Loss from operations before provision for income taxes |
| (43,571) |
| (254,748) |
| 211,177 |
| 82.9 | % | |||
Provision for income taxes |
| (10,057) |
| (782) |
| (9,275) |
| (1,186.1) | % | |||
Net loss | $ | (53,628) | $ | (255,530) |
| 201,902 |
| 79.0 | % | |||
26
Six Months Ended December 31, |
| ||||||||||||
| 2023 |
| 2022 |
| $ Change |
| % Change |
| |||||
Revenue: |
|
|
|
|
|
|
|
| |||||
Platforms | $ | 5,725,776 | $ | 4,130,239 | $ | 1,595,537 |
| 38.6 | % | ||||
Transactions |
| 14,648,937 |
| 13,271,070 |
| 1,377,867 |
| 10.4 | % | ||||
Total revenue |
| 20,374,713 |
| 17,401,309 |
| 2,973,404 |
| 17.1 | % | ||||
Cost of revenue: |
|
|
|
|
|
|
|
| |||||
Platforms |
| 868,799 |
| 483,546 |
| 385,253 |
| 79.7 | % | ||||
Transactions |
| 10,990,546 |
| 10,164,688 |
| 825,858 |
| 8.1 | % | ||||
Total cost of revenue |
| 11,859,345 |
| 10,648,234 |
| 1,211,111 |
| 11.4 | % | ||||
Gross profit: |
|
|
|
|
|
|
|
| |||||
Platforms |
| 4,856,977 |
| 3,646,693 |
| 1,210,284 |
| 33.2 | % | ||||
Transactions |
| 3,658,391 |
| 3,106,382 |
| 552,009 |
| 17.8 | % | ||||
Total gross profit |
| 8,515,368 |
| 6,753,075 |
| 1,762,293 |
| 26.1 | % | ||||
Operating expenses: |
|
|
|
|
|
|
|
| |||||
Sales and marketing |
| 1,489,943 |
| 1,187,824 |
| 302,119 |
| 25.4 | % | ||||
Technology and product development |
| 2,581,137 |
| 1,797,422 |
| 783,715 |
| 43.6 | % | ||||
General and administrative |
| 4,566,717 |
| 3,133,088 |
| 1,433,629 |
| 45.8 | % | ||||
Depreciation and amortization |
| 215,369 |
| 12,154 |
| 203,215 |
| 1,672.0 | % | ||||
Stock-based compensation expense |
| 1,188,269 |
| 784,064 |
| 404,205 |
| 51.6 | % | ||||
Foreign currency transaction gain |
| (7,118) |
| (11,663) |
| 4,545 |
| 39.0 | % | ||||
Total operating expenses |
| 10,034,317 |
| 6,902,889 |
| 3,131,428 |
| 45.4 | % | ||||
Loss from operations |
| (1,518,949) |
| (149,814) |
| (1,369,135) |
| 913.9 | % | ||||
Other income |
| 516,737 |
| 113,764 |
| 402,973 |
| 354.2 | % | ||||
Loss from operations before provision for income taxes |
| (1,002,212) |
| (36,050) |
| (966,162) |
| (2,680.1) | % | ||||
Provision for income taxes |
| (39,459) |
| (4,915) |
| (34,544) |
| (702.8) | % | ||||
Net loss | $ | (1,041,671) | $ | (40,965) |
| (1,000,706) |
| (2,442.8) | % | ||||
Revenue
Three Months Ended December 31, |
| |||||||||||
| 2023 |
| 2022 |
| $ Change |
| % Change |
| ||||
Revenue: |
|
|
|
|
|
|
|
| ||||
Platforms | $ | 3,125,584 | $ | 2,110,272 | $ | 1,015,312 |
| 48.1 | % | |||
Transactions |
| 7,188,158 |
| 6,606,394 |
| 581,764 |
| 8.8 | % | |||
Total revenue | $ | 10,313,742 | $ | 8,716,666 | $ | 1,597,076 |
| 18.3 | % | |||
27
Total revenue increased $1,597,076, or 18.3%, for the three months ended December 31, 2023 compared to the prior year, due to the following:
Category |
| Impact | Key Drivers | |||
Platforms |
| ↑ | $ | 1,015,312 | Increased due to additional deployments to new and existing customers, expansion from existing customers and additional revenue from the ResoluteAI and Scite transactions. Revenue is recognized ratably over the term of the subscription agreement, which is typically one year for commercial customers and monthly for individual subscribers, provided all other revenue recognition criteria have been met. Billings or payments received in advance of revenue recognition are recorded as deferred revenue. | |
Transactions |
| ↑ | $ | 581,764 | Increased primarily due to organic higher paid order volume and additional paid order volume due to the FIZ asset acquisition. | |
Six Months Ended December 31, |
| ||||||||||||
| 2023 |
| 2022 |
| $ Change |
| % Change |
| |||||
Revenue: |
|
|
|
|
|
|
|
| |||||
Platforms | $ | 5,725,776 | $ | 4,130,239 | $ | 1,595,537 |
| 38.6 | % | ||||
Transactions |
| 14,648,937 |
| 13,271,070 |
| 1,377,867 |
| 10.4 | % | ||||
Total revenue | $ | 20,374,713 | $ | 17,401,309 | $ | 2,973,404 |
| 17.1 | % | ||||
Total revenue increased $2,973,404, or 17.1%, for the six months ended December 31, 2023 compared to the prior year, due to the following:
Category |
| Impact | Key Drivers | |||
Platforms |
| ↑ | $ | 1,595,537 | Increased due to additional deployments to new and existing customers, expansion from existing customers and additional revenue from the ResoluteAI and Scite transactions. Revenue is recognized ratably over the term of the subscription agreement, which is typically one year for commercial customers and monthly for individual subscribers, provided all other revenue recognition criteria have been met. Billings or payments received in advance of revenue recognition are recorded as deferred revenue. | |
Transactions |
| ↑ | $ | 1,377,867 | Increased primarily due to organic higher paid order volume and additional paid order volume due to the FIZ asset acquisition. | |
Cost of Revenue
Three Months Ended December 31, |
| |||||||||||
| 2023 |
| 2022 |
| $ Change |
| % Change |
| ||||
Cost of Revenue: |
|
|
|
|
|
|
|
| ||||
Platforms | $ | 486,185 | $ | 253,073 | $ | 233,112 |
| 92.1 | % | |||
Transactions |
| 5,343,755 |
| 5,059,766 |
| 283,989 |
| 5.6 | % | |||
Total cost of revenue | $ | 5,829,940 | $ | 5,312,839 | $ | 517,101 |
| 9.7 | % | |||
Three Months Ended |
| ||||||
December 31, | |||||||
| 2023 |
| 2022 |
| % Change * |
| |
As a percentage of revenue: |
|
|
|
|
|
| |
Platforms |
| 15.6 | % | 12.0 | % | 3.6 | % |
Transactions |
| 74.3 | % | 76.6 | % | (2.3) | % |
Total |
| 56.5 | % | 61.0 | % | (4.5) | % |
28
* | The difference between current and prior period cost of revenue as a percentage of revenue |
Total cost of revenue as a percentage of revenue decreased 4.5%, from 61% for the previous year to 56.5%, for the three months ended December 31, 2023.
| Impact as percentage |
| ||||
Category | of revenue | Key Drivers | ||||
Platforms |
| ↑ |
| 3.3 | % | Increased primarily due to proportionally greater hosting costs from ResoluteAI. |
Transactions |
| ↓ |
| 2.3 | % | Decreased primarily due to higher copyright margins. |
Six Months Ended December 31, |
| ||||||||||||
| 2023 |
| 2022 |
| $ Change |
| % Change |
| |||||
Cost of Revenue: |
|
|
|
|
|
|
|
| |||||
Platforms | $ | 868,799 | $ | 483,546 | $ | 385,253 |
| 79.7 | % | ||||
Transactions |
| 10,990,546 |
| 10,164,688 |
| 825,858 |
| 8.1 | % | ||||
Total cost of revenue | $ | 11,859,345 | $ | 10,648,234 | $ | 1,211,111 |
| 11.4 | % | ||||
Six Months Ended |
| |||||||
December 31, |
| |||||||
| 2023 |
| 2022 |
| % Change * |
| ||
As a percentage of revenue: |
|
|
|
|
|
| ||
Platforms |
| 15.2 | % | 11.7 | % | 3.5 | % | |
Transactions |
| 75.0 | % | 76.6 | % | (1.6) | % | |
Total |
| 58.2 | % | 61.2 | % | (3.0) | % | |
* | The difference between current and prior period cost of revenue as a percentage of revenue |
Total cost of revenue as a percentage of revenue decreased 3%, from 61.2% for the previous year to 58.2%, for the six months ended December 31, 2023.
| Impact as percentage |
| ||||
Category | of revenue | Key Drivers | ||||
Platforms |
| ↑ |
| 3.5 | % | Increased primarily due to proportionally greater hosting costs from ResoluteAI. |
Transactions |
| ↓ |
| 1.6 | % | Decreased primarily due to higher copyright margins. |
Gross Profit
Three Months Ended December 31, |
| |||||||||||
| 2023 |
| 2022 |
| $ Change |
| % Change |
| ||||
Gross Profit: |
|
|
|
|
|
|
|
| ||||
Platforms | $ | 2,639,399 | $ | 1,857,199 | $ | 782,200 |
| 42.1 | % | |||
Transactions |
| 1,844,403 |
| 1,546,628 |
| 297,775 |
| 19.3 | % | |||
Total gross profit | $ | 4,483,802 | $ | 3,403,827 | $ | 1,079,975 |
| 31.7 | % | |||
Three Months Ended |
| ||||||
December 31, | |||||||
| 2023 |
| 2022 |
| % Change* |
| |
As a percentage of revenue: |
|
|
|
|
|
| |
Platforms |
| 84.4 | % | 88.0 | % | (3.6) | % |
Transactions |
| 25.7 | % | 23.4 | % | 2.3 | % |
Total |
| 43.5 | % | 39.0 | % | 4.5 | % |
* | The difference between current and prior period gross profit as a percentage of revenue |
29
Six Months Ended December 31, |
| ||||||||||||
| 2023 |
| 2022 |
| $ Change |
| % Change |
| |||||
Gross Profit: |
|
|
|
|
|
|
|
| |||||
Platforms | $ | 4,856,977 | $ | 3,646,693 | $ | 1,210,284 |
| 33.2 | % | ||||
Transactions |
| 3,658,391 |
| 3,106,382 |
| 552,009 |
| 17.8 | % | ||||
Total gross profit | $ | 8,515,368 | $ | 6,753,075 | $ | 1,762,293 |
| 26.1 | % | ||||
Six Months Ended |
| |||||||
December 31, |
| |||||||
| 2023 |
| 2022 |
| % Change* |
| ||
As a percentage of revenue: |
|
|
|
|
|
| ||
Platforms |
| 84.8 | % | 88.3 | % | (3.5) | % | |
Transactions |
| 25.0 | % | 23.4 | % | 1.6 | % | |
Total |
| 41.8 | % | 38.8 | % | 3.0 | % | |
* | The difference between current and prior period gross profit as a percentage of revenue |
Operating Expenses
Three Months Ended December 31, |
| |||||||||||
| 2023 |
| 2022 |
| $ Change |
| % Change |
| ||||
Operating Expenses: |
|
|
|
|
|
|
|
| ||||
Sales and marketing | $ | 804,927 | $ | 666,608 | $ | 138,319 |
| 20.7 | % | |||
Technology and product development |
| 1,336,558 |
| 922,132 |
| 414,426 |
| 44.9 | % | |||
General and administrative |
| 2,023,848 |
| 1,613,664 |
| 410,184 |
| 25.4 | % | |||
Depreciation and amortization |
| 155,749 |
| 6,342 |
| 149,407 |
| 2,355.8 | % | |||
Stock-based compensation expense |
| 596,455 |
| 608,703 |
| (12,248) |
| (2.0) | % | |||
Foreign currency transaction gain |
| (13,738) |
| (84,179) |
| 70,441 |
| 83.7 | % | |||
Total operating expenses | $ | 4,903,799 | $ | 3,733,270 | $ | 1,170,529 |
| 31.4 | % | |||
Category |
| Impact | Key Drivers | |||
Sales and marketing |
| ↑ | $ | 138,319 | Increased primarily due to greater personnel costs from the ResoluteAI and Scite transactions, partially offset by lower consulting expenses. | |
Technology and product development |
| ↑ | $ | 414,426 | Increased due to greater software development personnel costs, primarily from the onboarding personnel from ResoluteAI and Scite, but also due to organic growth in personnel cost. | |
General and administrative |
| ↑ | $ | 410,184 | Increased due to greater legal expenses and personnel costs, primarily from the onboarding of Resolute AI and Scite, partially offset by lower travel expenses. Greater legal expenses include proxy-related and acquisition-related costs. | |
Six Months Ended December 31, |
| ||||||||||||
| 2023 |
| 2022 |
| $ Change |
| % Change |
| |||||
Operating Expenses: |
|
|
|
|
|
|
|
| |||||
Sales and marketing | $ | 1,489,943 | $ | 1,187,824 | $ | 302,119 |
| 25.4 | % | ||||
Technology and product development |
| 2,581,137 |
| 1,797,422 |
| 783,715 |
| 43.6 | % | ||||
General and administrative |
| 4,566,717 |
| 3,133,088 |
| 1,433,629 |
| 45.8 | % | ||||
Depreciation and amortization |
| 215,369 |
| 12,154 |
| 203,215 |
| 1,672.0 | % | ||||
Stock-based compensation expense |
| 1,188,269 |
| 784,064 |
| 404,205 |
| 51.6 | % | ||||
Foreign currency transaction gain |
| (7,118) |
| (11,663) |
| 4,545 |
| 39.0 | % | ||||
Total operating expenses | $ | 10,034,317 | $ | 6,902,889 | $ | 3,131,428 |
| 45.4 | % | ||||
30
Category |
| Impact | Key Drivers | |||
Sales and marketing |
| ↑ | $ | 302,119 | Increased primarily due to greater personnel costs, including costs from the ResoluteAI and Scite transactions, and marketing discretionary spend partially offset by lower consulting expenses. | |
Technology and product development |
| ↑ | $ | 783,715 | Increased due to greater software development personnel costs, primarily from the onboarding personnel from ResoluteAI and Scite. ,but also due to organic growth in personnel cost. | |
General and administrative |
| ↑ | $ | 1,433,629 | Increased due to greater legal expenses and personnel costs, primarily from the onboarding of Resolute AI and Scite, partially offset by lower travel expenses. Greater legal expenses include proxy-related and acquisition-related costs. Greater personnel costs include separation costs paid to a former officer as result of the resolution of the proxy matter. | |
Net Income (Loss)
Three Months Ended December 31, |
| |||||||||||
| 2023 |
| 2022 |
| $ Change |
| % Change |
| ||||
Net Income (Loss): |
|
|
|
|
|
|
|
| ||||
Net income (loss): | $ | (53,628) | $ | (255,530) | $ | 201,902 |
| 79.0 | % | |||
Net loss decreased $255,530 or 79%, for the three months ended December 31, 2023 compared to the prior year, primarily due to gross profit, partially offset by increased operating expenses as described above.
Six Months Ended December 31, |
| ||||||||||||
| 2023 |
| 2022 |
| $ Change |
| % Change |
| |||||
Net Income (Loss): |
|
|
|
|
|
|
|
| |||||
Net income (loss): | $ | (1,041,671) | $ | (40,965) | $ | (1,000,706) |
| (2,442.8) | % | ||||
Net loss increased $1,000,706 or 2,442%, for the six months ended December 31, 2023 compared to the prior year, primarily due to increased operating expenses, partially offset by increased gross profit as described above.
Liquidity and Capital Resources
Six Months Ended December 31, | ||||||
2023 | 2022 | |||||
Consolidated Statements of Cash Flow Data: |
| |||||
Net cash provided by (used in) operating activities | $ | (426,888) | $ | 1,023,585 | ||
Net cash used in investing activities |
| (10,079,509) |
| (316,326) | ||
Net cash used in financing activities |
| (346,943) |
| (48,729) | ||
Effect of exchange rate changes |
| 5,666 |
| 859 | ||
Net increase (decrease) in cash and cash equivalents |
| (10,847,674) |
| 659,389 | ||
Cash and cash equivalents, beginning of period |
| 13,545,333 |
| 10,603,175 | ||
Cash and cash equivalents, end of period | $ | 2,697,659 | $ | 11,262,564 | ||
Liquidity
As of December 31, 2023, we had cash and cash equivalents of $2,697,659, compared to $13,545,333 as of June 30, 2023, a decrease of $10,847,674. This decrease was primarily due to cash used in investing activities.
31
Operating Activities
Net cash used in operating activities was $426,888 for the six months ended December 31, 2023 and resulted primarily from an increase in accounts receivable of $681,502 and an increase in deferred revenue of $241,545, partially offset by a decrease in prepaid royalties of $121,100.
Net cash provided by operating activities was $1,023,585 for the six months ended December 31, 2022 and resulted primarily from a decrease in prepaid royalties of $805,436, an increase in fair value of vested restricted common stock of $482,327 and an increase in deferred revenue of $428,999, partially offset by a decrease in accounts payable and accrued expenses of $974,931.
Investing Activities
Net cash used in investing activities was $10,079,509 for the six months ended December 31, 2023 and resulted primarily from the payment for the Scite acquisition of $7,305,493 and the payment for the ResoluteAI acquisition of $2,718,253.
Net cash used in investing activities was $316,326 for the six months ended December 31, 2022 and resulted primarily from the payment for non-refundable deposit for asset acquisition of $297,450.
Financing Activities
Net cash used in financing activities was $346,943 for the six months ended December 31, 2023 and resulted from the payment of contingent acquisition consideration of $278,195 and the repurchase of common stock of $68,748.
Net cash used in financing activities was $48,729 for the six months ended December 31, 2022 and resulted from the repurchase of common stock of $48,729.
We entered into a Loan and Security Agreement with Silicon Valley Bank (“SVB”) on July 23, 2010, which, as amended, provides for a revolving line of credit for the lesser of $2,500,000, or 80% of eligible accounts receivable. The line of credit matures on February 28, 2024, and is subject to certain financial and performance covenants with which we were in compliance as of December 31, 2023. Financial covenants include maintaining an adjusted quick ratio of unrestricted cash and net accounts receivable, divided by current liabilities plus debt less deferred revenue of at least 1.15 to 1.0. The line of credit bears interest at an annual rate equal to the greater of 1% above the prime rate and 5.0%. The interest rate on the line of credit was 9.5% as of December 31, 2023. The line of credit was secured by our consolidated assets.
There were no outstanding borrowings under the line as of December 31, 2023 and June 30, 2023, respectively. As of December 31, 2023, there was approximately $2,426,000 of available credit. On March 27, 2023, First Citizens BancShares, Inc. (“FCB”) entered into an agreement with the Federal Deposit Insurance Corporation (FDIC) to purchase all of the assets and liabilities of SVB. We have confirmed that the Loan and Security Agreement remains in effect post this transaction and that, we continue to have access to the revolving line of credit.
SVB Bridge Bank agreed that we can lower our cash balance threshold requirement associated with the SVB LSA, reducing the required balances of its and its subsidiaries’ primary operating and other accounts with SVB, and we continue to evaluate the SVB LSA. We have established additional banking relationships with Bank of America, N.A. and PNC Bank, N.A. At December 31, 2023, we held cash at Bank of America, N.A. of $124,044 and at PNC Bank, N.A. of $136,730.
Subsequent to September 30, 2023, FCB informed us of certain defaults under the SVB LSA resulting from our violation of certain covenants regarding retaining operating cash with SVB, obtaining deposit account control agreements with respect to such accounts and failing to maintain the required adjusted quick ratio. We became aware of additional technical defaults following FCB’s outreach, and such defaults substantially related to our moves to promptly diversify its cash position following the collapse of Silicon Valley Bank in March of 2023. On November 14, 2023, we entered into a
32
Fifth Amendment to Amended and Restated Loan and Security Agreement, Consent and Forbearance Agreement (the “Fifth Amendment”) with FCB, pursuant to which, among other matters, FCB agreed to forbear from exercising its remedies under the SVB LSA in connection with the existing events of default, and agreed to waive the existing events of default provided we regain compliance with the adjusted quick ratio covenant and the operating accounts covenants by January 30, 2024, no other events of defaults have occurred and no forbearance termination events (as listed in the Fifth Amendment) have occurred.
Non-GAAP Measure – Adjusted EBITDA
In addition to our GAAP results, we present Adjusted EBITDA as a supplemental measure of our performance. However, Adjusted EBITDA is not a recognized measurement under GAAP and should not be considered as an alternative to net income, income from operations or any other performance measure derived in accordance with GAAP or as an alternative to cash flow from operating activities as a measure of liquidity. We define Adjusted EBITDA as net income (loss), plus interest expense, other income (expense), foreign currency transaction loss, provision for income taxes, depreciation and amortization, stock-based compensation, income from discontinued operations and gain on sale of discontinued operations. Management considers our core operating performance to be that which our managers can affect in any particular period through their management of the resources that affect our underlying revenue and profit generating operations that period. Non-GAAP adjustments to our results prepared in accordance with GAAP are itemized below. You are encouraged to evaluate these adjustments and the reasons we consider them appropriate for supplemental analysis. In evaluating Adjusted EBITDA, you should be aware that in the future we may incur expenses that are the same as or similar to some of the adjustments in this presentation. Our presentation of Adjusted EBITDA should not be construed as an inference that our future results will be unaffected by unusual or non-recurring items.
Set forth below is a reconciliation of Adjusted EBITDA to net income (loss) for the three and six months ended December 31, 2023 and 2022:
| Three Months Ended | ||||||||
| December 31, | ||||||||
2023 |
| 2022 |
| $ Change | |||||
Net income (loss) | $ | (53,628) | $ | (255,530) | $ | 201,902 | |||
Add (deduct): |
|
|
|
| |||||
Other (income) expense |
| (376,426) |
| (74,695) |
| (301,731) | |||
Foreign currency transaction loss (gain) |
| (13,738) |
| (84,179) |
| 70,441 | |||
Provision for income taxes |
| 10,057 |
| 782 |
| 9,275 | |||
Depreciation and amortization |
| 155,749 |
| 6,342 |
| 149,407 | |||
Stock-based compensation |
| 596,455 |
| 608,703 |
| (12,248) | |||
Adjusted EBITDA | $ | 318,469 | $ | 201,423 | $ | 117,046 | |||
| Six Months Ended | |||||||||
| December 31, | |||||||||
2023 |
| 2022 |
| $ Change | ||||||
Net income (loss) | $ | (1,041,671) | $ | (40,965) | $ | (1,000,706) | ||||
Add (deduct): |
|
|
|
| ||||||
Other (income) expense |
| (516,737) |
| (113,764) |
| (402,973) | ||||
Foreign currency transaction loss (gain) |
| (7,118) |
| (11,663) |
| 4,545 | ||||
Provision for income taxes |
| 39,459 |
| 4,915 |
| 34,544 | ||||
Depreciation and amortization |
| 215,369 |
| 12,154 |
| 203,215 | ||||
Stock-based compensation |
| 1,188,269 |
| 784,064 |
| 404,205 | ||||
Adjusted EBITDA | $ | (122,429) | $ | 634,741 | $ | (757,170) | ||||
We present Adjusted EBITDA because we believe it assists investors and analysts in comparing our performance across reporting periods on a consistent basis by excluding items that we do not believe are indicative of our core operating performance. In addition, we use Adjusted EBITDA in developing our internal budgets, forecasts and strategic plan; in analyzing the effectiveness of our business strategies in evaluating potential acquisitions; and in making compensation
33
decisions and in communications with our board of directors concerning our financial performance. Adjusted EBITDA has limitations as an analytical tool, which includes, among others, the following:
| ● | Adjusted EBITDA does not reflect our cash expenditures, or future requirements, for capital expenditures or contractual commitments; |
| ● | Adjusted EBITDA does not reflect changes in, or cash requirements for, our working capital needs; |
| ● | Adjusted EBITDA does not reflect interest expense, or the cash requirements necessary to service interest or principal payments, on our debts; and |
| ● | Although depreciation and amortization are non-cash charges, the assets being depreciated and amortized will often have to be replaced in the future, and Adjusted EBITDA does not reflect any cash requirements for such replacements. |
Off-Balance Sheet Arrangements
We do not have any off-balance sheet arrangements.
Item 3. Quantitative and Qualitative Disclosures About Market Risk
Not required.
Item 4. Controls and Procedures
Evaluation of Disclosure Controls and Procedures
Our management, with the participation of our Chief Executive Officer and Chief Financial Officer, evaluated the effectiveness of our disclosure controls and procedures as of the end of the period covered by this Quarterly Report on Form 10-Q. For purposes of this section, the term disclosure controls and procedures means controls and other procedures of an issuer that are designed to ensure that information required to be disclosed by the issuer in the reports that it files or submits under the Securities Exchange Act of 1934, as amended (the “Exchange Act”), is recorded, processed, summarized and reported within the time periods specified in the SEC’s rules and forms. Disclosure controls and procedures include, without limitation, controls and procedures designed to ensure that information required to be disclosed by an issuer in the reports that it files or submits under the Exchange Act is accumulated and communicated to the issuer’s management, including its principal executive and principal financial officers, or persons performing similar functions, as appropriate to allow timely decisions regarding required disclosure.
Based upon that evaluation, our Chief Executive Officer and Chief Financial Officer have concluded that, as of December 31, 2023, the end of the period covered by this report, our disclosure controls and procedures were effective at a reasonable assurance level.
Inherent Limitations on the Effectiveness of Controls
Management does not expect that our disclosure controls and procedures or our internal control over financial reporting will prevent or detect all errors and all fraud. A control system, no matter how well conceived and operated, can provide only reasonable, not absolute, assurance that the objectives of the control systems are met. Further, the design of a control system must reflect the fact that there are resource constraints, and the benefits of controls must be considered relative to their costs. Because of the inherent limitations in a cost-effective control system, no evaluation of internal control over financial reporting can provide absolute assurance that misstatements due to error or fraud will not occur or that all control issues and instances of fraud, if any, have been or will be detected.
34
These inherent limitations include the realities that judgments in decision-making can be faulty and that breakdowns can occur because of a simple error or mistake. Controls can also be circumvented by the individual acts of some persons, by collusion of two or more people, or by management override of the controls. The design of any system of controls is based in part on certain assumptions about the likelihood of future events, and there can be no assurance that any design will succeed in achieving its stated goals under all potential future conditions. Projections of any evaluation of controls effectiveness to future periods are subject to risks. Over time, controls may become inadequate because of changes in conditions or deterioration in the degree of compliance with policies or procedures.
Changes in Internal Control Over Financial Reporting
In addition, our management with the participation of our principal executive officer and principal financial officer have determined that no change in our internal control over financial reporting (as that term is defined in Rules 13(a)-15(f) and 15(d)-15(f) of the Exchange Act) occurred during the quarter ended December 31, 2023 that has materially affected, or is reasonably likely to materially affect, our internal control over financial reporting.
PART II — OTHER INFORMATION
Item 1A. Risk Factors.
There have been no material changes from the risk factors disclosed in the Company's Annual Report on Form 10-K for the year ended June 30, 2023.
Item 2. Unregistered Sales of Equity Securities and Use of Proceeds
Effective as of February 9, 2021, the Compensation Committee of our Board of Directors authorized the repurchase, during calendar year 2021 on the last day of each trading window and otherwise in accordance with our insider trading policies, of up to $400,000 of outstanding common stock (at prices no greater than $4.00 per share) from our employees to satisfy their tax obligations in connection with the vesting of stock incentive awards. The Compensation Committee of our Board of Directors subsequently approved the extension of the repurchases under the same terms through the end of fiscal year 2024. The actual number of shares repurchased will be determined by applicable employees in their discretion, and will depend on their evaluation of market conditions and other factors. As of June 30, 2023, $151,095 remained under the current authorization to repurchase our outstanding common stock from our employees.
During the three months ended December 31, 2023, we repurchased 8,501 shares of our common stock from employees at an average market price of approximately $2.66 per share for an aggregate amount of $22,613. As of December 31, 2023, $82,347 remains under the current authorization to repurchase our outstanding common stock from our employees.
Shares repurchased are retired and deducted from common stock for par value and from additional paid in capital for the excess over par value. Direct costs incurred to acquire the shares are included in the total cost of the shares.
35
The following table summarizes repurchases of our common stock on a monthly basis:
|
|
| Total Number of Shares |
| Approximate Dollar Value | |||||
Total Number | Average | Purchased as Part of | of Shares that May Yet Be | |||||||
of Shares | Price Paid | Publicly Announced | Purchased Under the | |||||||
Period | Purchased1 | per Share | Plans or Programs | Plans or Programs | ||||||
October 1-31, 2023 |
| — |
| — |
| — | $ | 104,960 | ||
November 1-30, 2023 |
| — |
| — |
| — | $ | 104,960 | ||
December 1-31, 2023 |
| 8,501 | $ | 2.66 |
| — | $ | 82,347 | ||
Total |
| 8,501 | $ | 2.66 |
| — |
| — | ||
1 Consists of shares of common stock purchased from an employee to satisfy tax obligations in connection with the vesting of stock incentive awards.
Item 6. Exhibits
EXHIBIT INDEX
Exhibit | Description |
2.1 | |
2.2 | |
3.1.1 | |
3.1.2 | |
3.2 | |
31.1 | Rule 13a-14(a)/15d-14(a) Certification of Chief Executive Officer |
31.2 | Rule 13a-14(a)/15d-14(a) Certification of Chief Financial Officer |
32.1 | |
32.2 | |
101.INS | INLINE XBRL Instance Document |
101.SCH | XBRL Taxonomy Extension Schema |
101.CAL | XBRL Taxonomy Extension Calculation Linkbase |
101.DEF | XBRL Taxonomy Extension Definition Linkbase |
101.LAB | XBRL Taxonomy Extension Label Linkbase |
101.PRE | XBRL Taxonomy Extension Presentation Linkbase |
104 | Cover Page Interactive Data File – The cover page interactive data file does not appear in the Interactive Data File because its XBRL tags are embedded within the Inline XBRL document |
* Furnished herewith
36
SIGNATURES
Pursuant to the requirements of the Securities Exchange Act of 1934, the registrant has duly caused this report to be signed on its behalf by the undersigned thereunto duly authorized.
| RESEARCH SOLUTIONS, INC. | |
|
| |
| By: | /s/ Roy W. Olivier |
|
| Roy W. Olivier |
Date: February 12, 2024 |
| Chief Executive Officer and President (Principal Executive Officer) |
| ||
| By: | /s/ William Nurthen |
|
| William Nurthen |
Date: February 12, 2024 |
| Chief Financial Officer (Principal Financial and Accounting Officer) |
37