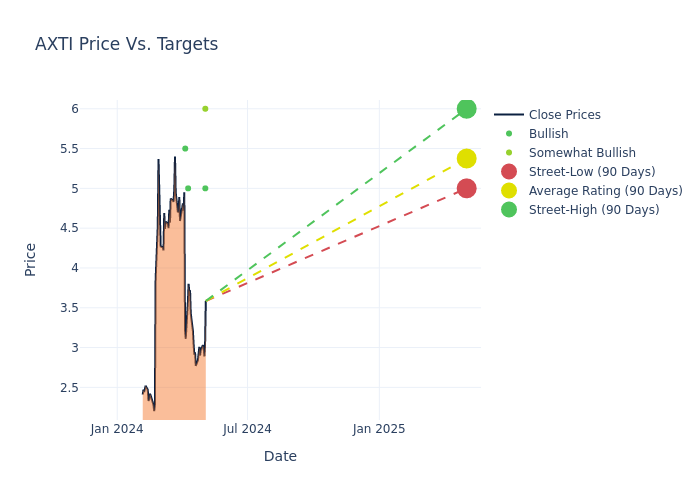
In the preceding three months, 10 analysts have released ratings for AXT (NASDAQ:AXTI), presenting a wide array of perspectives from bullish to bearish.
In the table below, you'll find a summary of their recent ratings, revealing the shifting sentiments over the past 30 days and comparing them to the previous months.
| Bullish | Somewhat Bullish | Indifferent | Somewhat Bearish | Bearish | |
|---|---|---|---|---|---|
| Total Ratings | 7 | 3 | 0 | 0 | 0 |
| Last 30D | 1 | 1 | 0 | 0 | 0 |
| 1M Ago | 3 | 1 | 0 | 0 | 0 |
| 2M Ago | 0 | 0 | 0 | 0 | 0 |
| 3M Ago | 3 | 1 | 0 | 0 | 0 |
Analysts have set 12-month price targets for AXT, revealing an average target of $5.11, a high estimate of $6.00, and a low estimate of $3.75. This current average has increased by 40.38% from the previous average price target of $3.64.

Exploring Analyst Ratings: An In-Depth Overview
The standing of AXT among financial experts becomes clear with a thorough analysis of recent analyst actions. The summary below outlines key analysts, their recent evaluations, and adjustments to ratings and price targets.
| Analyst | Analyst Firm | Action Taken | Rating | Current Price Target | Prior Price Target |
|---|---|---|---|---|---|
| Matt Bryson | Wedbush | Maintains | Outperform | $6.00 | - |
| Charles Shi | Needham | Maintains | Buy | $5.00 | - |
| Richard Shannon | Craig-Hallum | Raises | Buy | $5.00 | $3.75 |
| Charles Shi | Needham | Maintains | Buy | $5.00 | - |
| Matt Bryson | Wedbush | Maintains | Outperform | $6.00 | $6.00 |
| Dave Kang | B. Riley Securities | Raises | Buy | $5.50 | $3.80 |
| Richard Shannon | Craig-Hallum | Raises | Buy | $3.75 | $2.25 |
| Matt Bryson | Wedbush | Maintains | Outperform | $6.00 | - |
| Charles Shi | Needham | Maintains | Buy | $5.00 | - |
| Dave Kang | B. Riley Securities | Raises | Buy | $3.80 | $2.40 |
Key Insights:
- Action Taken: Analysts adapt their recommendations to changing market conditions and company performance. Whether they 'Maintain', 'Raise' or 'Lower' their stance, it reflects their response to recent developments related to AXT. This information provides a snapshot of how analysts perceive the current state of the company.
- Rating: Analyzing trends, analysts offer qualitative evaluations, ranging from 'Outperform' to 'Underperform'. These ratings convey expectations for the relative performance of AXT compared to the broader market.
- Price Targets: Analysts navigate through adjustments in price targets, providing estimates for AXT's future value. Comparing current and prior targets offers insights into analysts' evolving expectations.
Analyzing these analyst evaluations alongside relevant financial metrics can provide a comprehensive view of AXT's market position. Stay informed and make data-driven decisions with the assistance of our Ratings Table.
Stay up to date on AXT analyst ratings.
If you are interested in following small-cap stock news and performance you can start by tracking it here.
Delving into AXT's Background
AXT Inc is a developer and producer of compound and single-element semiconductor substrates, also known as wafers. The dominant substrates used in producing semiconductor chips and other electronic circuits are made from silicon. It is engaged in the design, development, manufacture, and distribution of high-performance compound semiconductor substrates and the sale of materials. The company provides alternative or specialty materials in the form of substrates or wafers, including compound and single-element substrates. Its compound substrates combine indium with phosphorous or gallium with arsenic. Geographically firm has its business presence across the region of Europe, Japan, Taiwan, China, North America, and the Asia Pacific from which China derives its maximum revenue to the company.
Breaking Down AXT's Financial Performance
Market Capitalization Analysis: Below industry benchmarks, the company's market capitalization reflects a smaller scale relative to peers. This could be attributed to factors such as growth expectations or operational capacity.
Revenue Growth: AXT's revenue growth over a period of 3 months has faced challenges. As of 31 December, 2023, the company experienced a revenue decline of approximately -23.76%. This indicates a decrease in the company's top-line earnings. When compared to others in the Information Technology sector, the company faces challenges, achieving a growth rate lower than the average among peers.
Net Margin: AXT's financial strength is reflected in its exceptional net margin, which exceeds industry averages. With a remarkable net margin of -18.59%, the company showcases strong profitability and effective cost management.
Return on Equity (ROE): AXT's ROE is below industry averages, indicating potential challenges in efficiently utilizing equity capital. With an ROE of -1.89%, the company may face hurdles in achieving optimal financial returns.
Return on Assets (ROA): AXT's ROA falls below industry averages, indicating challenges in efficiently utilizing assets. With an ROA of -1.08%, the company may face hurdles in generating optimal returns from its assets.
Debt Management: With a below-average debt-to-equity ratio of 0.28, AXT adopts a prudent financial strategy, indicating a balanced approach to debt management.
The Significance of Analyst Ratings Explained
Analyst ratings serve as essential indicators of stock performance, provided by experts in banking and financial systems. These specialists diligently analyze company financial statements, participate in conference calls, and engage with insiders to generate quarterly ratings for individual stocks.
Some analysts publish their predictions for metrics such as growth estimates, earnings, and revenue to provide additional guidance with their ratings. When using analyst ratings, it is important to keep in mind that stock and sector analysts are also human and are only offering their opinions to investors.
This article was generated by Benzinga's automated content engine and reviewed by an editor.
