Rocket Lab Blasts Off With Golden Cross: Time To Buckle Up?
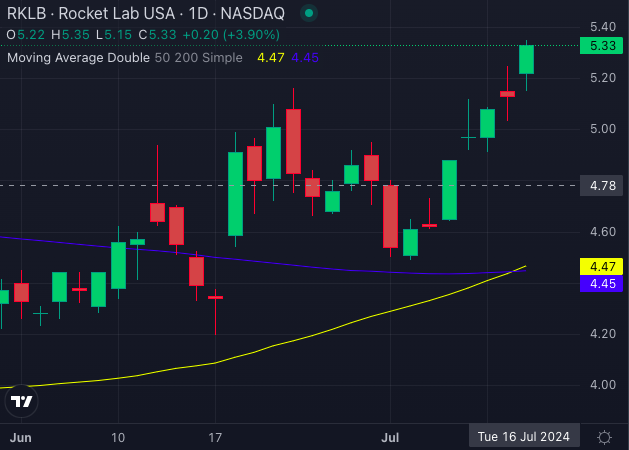
Rocket Lab USA, Inc. (NASDAQ:RKLB) is rocketing to new heights, catching the eyes of investors with its bullish technical signals. This space company, known for its launch services and space systems solutions, is now seeing its stock making a Golden Cross – a key indicator suggesting more bullish movement ahead.

Chart created using Benzinga Pro
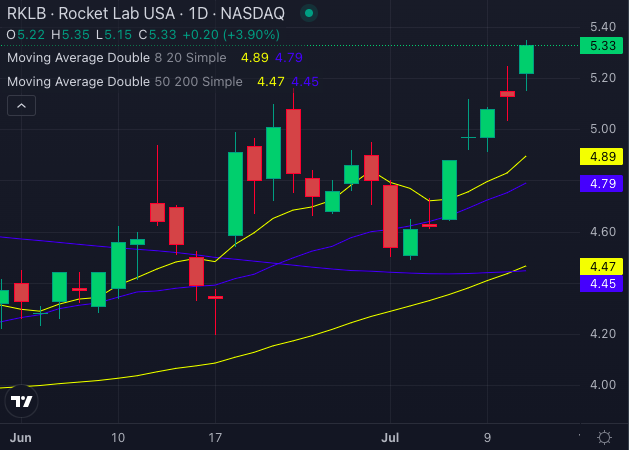
Rocket Lab’s share price currently sits at $5.33, comfortably above its 5, 20, and 50-day exponential moving averages. This trend is not just a blip; it’s a sign of strong bullish momentum. The stock is experiencing buying pressure, a positive indicator for future gains.

Chart created using Benzinga Pro
Here’s the breakdown of RKLB’s stellar performance:
- 8-day SMA: RKLB’s share price at $5.33 vs. $4.89 – a clear bullish signal.
- 20-day SMA: Trading at $5.33 while the SMA stands at $4.79 – another bullish cue.
- 50-day SMA: RKLB at $5.33 compared to the 50-day SMA of $4.47 – yet another bullish indicator.
- 200-day SMA: Rocket Lab’s price of $5.33 surpasses the 200-day SMA of $4.45 – a strong bullish signal.

Chart created using Benzinga Pro
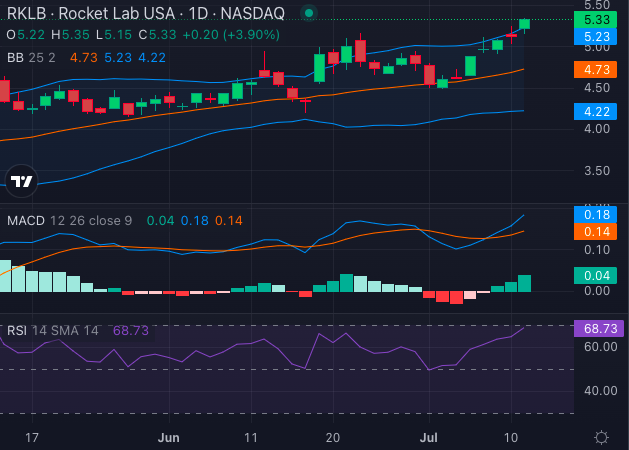
The MACD indicator, standing at 0.18, further supports this bullish outlook. Meanwhile, Rocket Lab’s RSI at 68.73 suggests the stock is overbought, adding to the buzz.
Bollinger Bands paint a similarly bullish picture:
- 25-Day Bands: The range is $4.22 – $5.23, with the stock price of $5.33 breaking above.
Rocket Lab’s innovative strides in spacecraft design, manufacturing, and its reusable orbital-class rockets are pushing it into the spotlight. With a clientele spanning commercial, aerospace prime contractors, and government customers, Rocket Lab is positioned to soar higher.
For those eyeing space stocks, Rocket Lab’s Golden Cross might be the signal to buckle up for a potentially exciting ride.
Is this a new dawn for Rocket Lab? Only time will tell, but the technicals are certainly pointing towards a bullish trajectory.
Read Next:
Photo: Shutterstock
