SEC Form 6-K filed by Brightstar Lottery PLC Trading under the Legal Name to begin a
$BRSL
Services-Misc. Amusement & Recreation
Consumer Discretionary
UNITED STATES
SECURITIES AND EXCHANGE COMMISSION
WASHINGTON, D.C. 20549
FORM 6-K
REPORT OF FOREIGN PRIVATE ISSUER
PURSUANT TO RULE 13a-16 OR 15d-16 UNDER THE
SECURITIES EXCHANGE ACT OF 1934
For the month of July 2025
Commission File Number 001-36906
BRIGHTSTAR LOTTERY PLC
(Translation of registrant’s name into English)
10 Finsbury Square, Third Floor
London, EC2A 1AF
United Kingdom
(Address of principal executive offices)
Indicate by check mark whether the registrant files or will file annual reports under cover of Form 20-F or Form 40-F:
| Form 20-F | x | Form 40-F | o | |||||||||||||||||
1
Table of Contents
TABLE OF CONTENTS
| Page | |||||||||||
2
Table of Contents
FORWARD-LOOKING STATEMENTS
This Form 6-K may contain forward-looking statements (including within the meaning of the Private Securities Litigation Reform Act of 1995) concerning Brightstar Lottery PLC and its consolidated subsidiaries (“Brightstar” or the “Company”) and other matters. These statements may discuss goals, intentions, and expectations as to future plans and strategies, expected growth, transactions, including the impacts on Brightstar of the sale of the Gaming & Digital business (“IGT Gaming”) to a holding company (the “Buyer”) owned by funds managed by affiliates of Apollo Global Management, Inc. (NYSE: APO) (the “Apollo Funds”) and the calculation of gain on sale and use of net proceeds therefrom, trends, events, products and services, customer relationships, dividends, results of operations, and/or financial condition or measures, including our expectations on future revenue, operating income, cash from and used in operations, capital expenditures guidance, and FY’25 EUR/USD assumption, or otherwise, based on current beliefs of the management of the Company as well as assumptions made by, and information currently available to, such management. Forward-looking statements may be accompanied by words such as “aim,” “anticipate,” “believe,” “plan,” “could,” “would,” “should,” “shall,” “continue,” “estimate,” “expect,” “forecast,” “future,” “guidance,” “intend,” “may,” “will,” “outlook,” “possible,” “potential,” “predict,” “project,” or the negative or other variations of them. These forward-looking statements speak only as of the date on which such statements are made and are subject to various risks and uncertainties, many of which are outside the Company’s control. Should one or more of these risks or uncertainties materialize, or should any of the underlying assumptions prove incorrect, actual results may differ materially from those predicted in the forward-looking statements and from past results, performance, or achievements. Therefore, you should not place undue reliance on such statements. Factors that could cause actual results to differ materially from those in the forward-looking statements include (but are not limited to) macroeconomic, regulatory and political uncertainty, including as a result of new or increased tariffs, trade wars, and other restrictions on trade between or among countries in which it operates, and related changes in discretionary consumer spending and behavior, fluctuations in foreign currency exchange rates, changes in prevailing interest rates, changing inflation rates, impacts from increased U.S. national deficits, and the other factors and risks described in the Company’s annual report on Form 20-F for the financial year ended December 31, 2024 (including in “Item 3.D. Risk Factors”) and other documents filed or furnished from time to time with the SEC, which are available on the SEC’s website at www.sec.gov and on the investor relations section of the Company’s website at www.brightstarlottery.com. Except as required under applicable law, the Company does not assume any obligation to update these forward-looking statements. You should carefully consider these factors and other risks and uncertainties that may affect the Company’s business, including the discussion provided in Part I, Item 2. Management’s Discussion and Analysis of Financial Condition and Results of Operations. Nothing in this Form 6-K is intended, or is to be construed, as a profit forecast or to be interpreted to mean that the financial performance of Brightstar Lottery PLC for the current or any future financial years will necessarily match or exceed the historical published financial performance of Brightstar Lottery PLC, as applicable. All forward-looking statements contained in this Form 6-K are qualified in their entirety by this cautionary statement. All subsequent written or oral forward-looking statements attributable to Brightstar Lottery PLC, or persons acting on its behalf, are expressly qualified in their entirety by this cautionary statement.
3
Table of Contents
PART I. FINANCIAL INFORMATION
ITEM 1. Condensed Consolidated Financial Statements (Unaudited)
BRIGHTSTAR LOTTERY PLC
INDEX TO CONDENSED CONSOLIDATED FINANCIAL STATEMENTS (UNAUDITED)
Condensed Consolidated Balance Sheets at June 30, 2025 and December 31, 2024 | |||||
Condensed Consolidated Statements of Operations for the three and six months ended June 30, 2025 and 2024 | |||||
Condensed Consolidated Statements of Comprehensive Income for the three and six months ended June 30, 2025 and 2024 | |||||
Condensed Consolidated Statements of Cash Flows for the six months ended June 30, 2025 and 2024 | |||||
Condensed Consolidated Statements of Shareholders’ Equity for the three and six months ended June 30, 2025 and 2024 | |||||
4
Table of Contents
Brightstar Lottery PLC
Condensed Consolidated Balance Sheets
(Unaudited, $ and shares in millions, except per share amounts)
| Notes | June 30, 2025 | December 31, 2024 | ||||||||||||||||||
| Assets | ||||||||||||||||||||
| Current assets: | ||||||||||||||||||||
| Cash and cash equivalents | 1,309 | 584 | ||||||||||||||||||
| Restricted cash and cash equivalents | 92 | 120 | ||||||||||||||||||
| Trade and other receivables, net | 5 | 428 | 468 | |||||||||||||||||
| Inventories, net | 6 | 117 | 113 | |||||||||||||||||
| Other current assets | 153 | 114 | ||||||||||||||||||
| Assets held for sale | 3 | 4,957 | 4,765 | |||||||||||||||||
| Total current assets | 7,057 | 6,165 | ||||||||||||||||||
| Systems, equipment and other assets related to contracts, net | 637 | 581 | ||||||||||||||||||
| Property, plant and equipment, net | 86 | 85 | ||||||||||||||||||
| Operating lease right-of-use assets | 7 | 99 | 102 | |||||||||||||||||
| Goodwill | 2,706 | 2,650 | ||||||||||||||||||
| Intangible assets, net | 90 | 89 | ||||||||||||||||||
| Other non-current assets | 563 | 606 | ||||||||||||||||||
| Total non-current assets | 4,182 | 4,113 | ||||||||||||||||||
| Total assets | 11,238 | 10,278 | ||||||||||||||||||
| Liabilities and shareholders' equity | ||||||||||||||||||||
| Current liabilities: | ||||||||||||||||||||
| Accounts payable | 680 | 718 | ||||||||||||||||||
| Current portion of long-term debt | 9 | 1,861 | 208 | |||||||||||||||||
| Other current liabilities | 605 | 619 | ||||||||||||||||||
| Liabilities held for sale | 3 | 981 | 1,142 | |||||||||||||||||
| Total current liabilities | 4,126 | 2,687 | ||||||||||||||||||
| Long-term debt, less current portion | 9 | 4,688 | 5,153 | |||||||||||||||||
| Deferred income taxes | 206 | 170 | ||||||||||||||||||
| Operating lease liabilities | 7 | 79 | 83 | |||||||||||||||||
| Other non-current liabilities | 126 | 125 | ||||||||||||||||||
| Total non-current liabilities | 5,100 | 5,530 | ||||||||||||||||||
| Total liabilities | 9,226 | 8,217 | ||||||||||||||||||
| Commitments and contingencies | 10 | |||||||||||||||||||
| Shareholders’ equity | ||||||||||||||||||||
| Common stock, par value $0.10 per share; 210 shares issued and 203 shares outstanding at June 30, 2025; 209 shares issued and 202 shares outstanding at December 31, 2024 | 21 | 21 | ||||||||||||||||||
| Additional paid-in capital | 1,852 | 1,931 | ||||||||||||||||||
| Retained deficit | (691) | (660) | ||||||||||||||||||
| Treasury stock, at cost; 7 shares at June 30, 2025 and December 31, 2024 | (156) | (156) | ||||||||||||||||||
| Accumulated other comprehensive income | 12 | 505 | 516 | |||||||||||||||||
| Total Brightstar Lottery PLC’s shareholders’ equity | 1,531 | 1,652 | ||||||||||||||||||
| Non-controlling interests | 481 | 409 | ||||||||||||||||||
| Total shareholders’ equity | 2,012 | 2,061 | ||||||||||||||||||
| Total liabilities and shareholders’ equity | 11,238 | 10,278 | ||||||||||||||||||
The accompanying notes are an integral part of these condensed consolidated financial statements.
5
Table of Contents
Brightstar Lottery PLC
Condensed Consolidated Statements of Operations
(Unaudited, $ and shares in millions, except per share amounts)
| For the three months ended June 30, | For the six months ended June 30, | ||||||||||||||||||||||||||||
| Notes | 2025 | 2024 | 2025 | 2024 | |||||||||||||||||||||||||
| Service revenue | 4 | 588 | 586 | 1,146 | 1,205 | ||||||||||||||||||||||||
| Product sales | 4 | 42 | 27 | 68 | 69 | ||||||||||||||||||||||||
| Total revenue | 4 | 631 | 613 | 1,214 | 1,274 | ||||||||||||||||||||||||
| Cost of services | 321 | 304 | 626 | 608 | |||||||||||||||||||||||||
| Cost of product sales | 35 | 22 | 57 | 48 | |||||||||||||||||||||||||
| Selling, general and administrative | 100 | 96 | 204 | 198 | |||||||||||||||||||||||||
| Research and development | 12 | 11 | 23 | 22 | |||||||||||||||||||||||||
| Restructuring | 21 | — | 21 | — | |||||||||||||||||||||||||
| Other operating expense, net | 3 | 1 | 5 | 1 | |||||||||||||||||||||||||
| Total operating expenses | 492 | 434 | 937 | 877 | |||||||||||||||||||||||||
| Operating income | 139 | 179 | 277 | 397 | |||||||||||||||||||||||||
| Interest expense, net | 9 | 49 | 53 | 94 | 106 | ||||||||||||||||||||||||
| Foreign exchange loss (gain), net | 99 | (4) | 131 | (16) | |||||||||||||||||||||||||
| Other non-operating expense, net | 2 | 3 | 5 | 7 | |||||||||||||||||||||||||
| Total non-operating expenses | 149 | 52 | 231 | 97 | |||||||||||||||||||||||||
| (Loss) income from continuing operations before provision for income taxes | 11 | (10) | 127 | 46 | 300 | ||||||||||||||||||||||||
| Provision for income taxes | 11 | 50 | 43 | 97 | 100 | ||||||||||||||||||||||||
| (Loss) income from continuing operations | (60) | 84 | (52) | 200 | |||||||||||||||||||||||||
| Income from discontinued operations, net of tax | 3 | 40 | — | 92 | 13 | ||||||||||||||||||||||||
| Net (loss) income | (20) | 85 | 40 | 213 | |||||||||||||||||||||||||
| Less: Net income attributable to non-controlling interests from continuing operations | 36 | 41 | 67 | 86 | |||||||||||||||||||||||||
| Less: Net income attributable to non-controlling interests from discontinued operations | 3 | 2 | 2 | 4 | 3 | ||||||||||||||||||||||||
| Net (loss) income attributable to Brightstar Lottery PLC | 13 | (58) | 42 | (31) | 123 | ||||||||||||||||||||||||
| Net (loss) income from continuing operations attributable to Brightstar Lottery PLC per common share - basic | 13 | (0.47) | 0.21 | (0.59) | 0.57 | ||||||||||||||||||||||||
| Net (loss) income from continuing operations attributable to Brightstar Lottery PLC per common share - diluted | 13 | (0.47) | 0.21 | (0.59) | 0.56 | ||||||||||||||||||||||||
| Net (loss) income attributable to Brightstar Lottery PLC per common share - basic | 13 | (0.29) | 0.21 | (0.15) | 0.61 | ||||||||||||||||||||||||
| Net (loss) income attributable to Brightstar Lottery PLC per common share - diluted | 13 | (0.29) | 0.21 | (0.15) | 0.61 | ||||||||||||||||||||||||
| Weighted-average shares - basic | 13 | 203 | 201 | 203 | 201 | ||||||||||||||||||||||||
| Weighted-average shares - diluted | 13 | 203 | 203 | 203 | 203 | ||||||||||||||||||||||||
The accompanying notes are an integral part of these condensed consolidated financial statements.
6
Table of Contents
Brightstar Lottery PLC
Condensed Consolidated Statements of Comprehensive Income
(Unaudited, $ in millions)
| For the three months ended June 30, | For the six months ended June 30, | |||||||||||||||||||||||||||||||
| Notes | 2025 | 2024 | 2025 | 2024 | ||||||||||||||||||||||||||||
| Net (loss) income | (20) | 85 | 40 | 213 | ||||||||||||||||||||||||||||
| Foreign currency translation adjustments, net of tax | 12 | 17 | 1 | 29 | (9) | |||||||||||||||||||||||||||
| Unrealized (loss) gain on hedges, net of tax | 12 | (5) | — | (7) | 2 | |||||||||||||||||||||||||||
| Other comprehensive income (loss), net of tax | 13 | 1 | 22 | (8) | ||||||||||||||||||||||||||||
| Comprehensive (loss) income | (8) | 86 | 62 | 205 | ||||||||||||||||||||||||||||
| Less: Comprehensive income attributable to non-controlling interests | 57 | 40 | 104 | 70 | ||||||||||||||||||||||||||||
| Comprehensive (loss) income attributable to Brightstar Lottery PLC | (65) | 45 | (42) | 135 | ||||||||||||||||||||||||||||
The accompanying notes are an integral part of these condensed consolidated financial statements.
7
Table of Contents
Brightstar Lottery PLC
Condensed Consolidated Statements of Cash Flows
(Unaudited, $ in millions)
| For the six months ended June 30, | ||||||||||||||
| 2025 | 2024 | |||||||||||||
| Cash flows from operating activities | ||||||||||||||
| Net income | 40 | 213 | ||||||||||||
| Less: Income from discontinued operations, net of tax | 92 | 13 | ||||||||||||
| Adjustments to reconcile net income to net cash provided by operating activities from continuing operations: | ||||||||||||||
| Foreign exchange loss (gain), net | 131 | (16) | ||||||||||||
| Amortization of upfront license fees | 101 | 99 | ||||||||||||
| Depreciation | 90 | 84 | ||||||||||||
| Amortization | 18 | 16 | ||||||||||||
| Stock-based compensation | 12 | 18 | ||||||||||||
| Deferred income taxes | (24) | 10 | ||||||||||||
| Other non-cash items, net | 16 | 7 | ||||||||||||
| Changes in operating assets and liabilities, excluding the effects of dispositions: | ||||||||||||||
| Trade and other receivables | 78 | 19 | ||||||||||||
| Inventories | (6) | (6) | ||||||||||||
| Accounts payable | (77) | (69) | ||||||||||||
| Accrued interest payable | 7 | (11) | ||||||||||||
| Accrued income taxes | 89 | 8 | ||||||||||||
| Other assets and liabilities | 49 | (45) | ||||||||||||
| Net cash provided by operating activities from continuing operations | 433 | 315 | ||||||||||||
| Net cash provided by operating activities from discontinued operations | 101 | 148 | ||||||||||||
| Net cash provided by operating activities | 534 | 463 | ||||||||||||
| Cash flows from investing activities | ||||||||||||||
| Capital expenditures | (174) | (74) | ||||||||||||
| Other | (1) | (2) | ||||||||||||
| Net cash used in investing activities from continuing operations | (175) | (76) | ||||||||||||
| Net cash used in investing activities from discontinued operations | (85) | (104) | ||||||||||||
| Net cash used in investing activities | (260) | (180) | ||||||||||||
| Cash flows from financing activities | ||||||||||||||
| Proceeds from long-term debt | 1,112 | — | ||||||||||||
| Net payments of short-term borrowings | — | (16) | ||||||||||||
| Net payments on financial liabilities | (81) | (64) | ||||||||||||
| Net repayments of Revolving Credit Facilities | (105) | (37) | ||||||||||||
| Principal payments on long-term debt | (208) | — | ||||||||||||
| Dividends paid | (81) | (80) | ||||||||||||
| Dividends paid - non-controlling interests | (163) | (159) | ||||||||||||
| Return of capital - non-controlling interests | (47) | (45) | ||||||||||||
| Capital increase - non-controlling interests | 178 | 2 | ||||||||||||
| Other | (23) | (14) | ||||||||||||
| Net cash provided by (used in) financing activities from continuing operations | 581 | (413) | ||||||||||||
| Net cash used in financing activities from discontinued operations | (143) | (20) | ||||||||||||
| Net cash provided by (used in) financing activities | 438 | (433) | ||||||||||||
| Net increase (decrease) in cash and cash equivalents and restricted cash and cash equivalents | 712 | (149) | ||||||||||||
| Effect of exchange rate changes on cash and cash equivalents and restricted cash and cash equivalents | 58 | (31) | ||||||||||||
| Cash and cash equivalents and restricted cash and cash equivalents at the beginning of the period | 775 | 739 | ||||||||||||
| Cash and cash equivalents and restricted cash and cash equivalents at the end of the period | 1,546 | 559 | ||||||||||||
| Less: Cash and cash equivalents and restricted cash and cash equivalents of discontinued operations | 144 | 86 | ||||||||||||
| Cash and cash equivalents and restricted cash and cash equivalents at the end of the period of continuing operations | 1,401 | 473 | ||||||||||||
| Supplemental disclosures of cash flow information for continuing operations: | ||||||||||||||
| Interest paid | 89 | 117 | ||||||||||||
| Income taxes paid | 32 | 82 | ||||||||||||
The accompanying notes are an integral part of these condensed consolidated financial statements.
8
Table of Contents
Brightstar Lottery PLC
Condensed Consolidated Statements of Shareholders’ Equity
(Unaudited, $ in millions)
| Common Stock | Additional Paid-In Capital | Retained Earnings (Deficit) | Treasury Stock | Accumulated Other Comprehensive Income (Loss) | Total Brightstar Lottery PLC Equity | Non- Controlling Interests | Total Equity | ||||||||||||||||||||||||||||||||||||||||
| Balance at December 31, 2024 | 21 | 1,931 | (660) | (156) | 516 | 1,652 | 409 | 2,061 | |||||||||||||||||||||||||||||||||||||||
| Net income | — | — | 27 | — | — | 27 | 33 | 60 | |||||||||||||||||||||||||||||||||||||||
| Other comprehensive (loss) income, net of tax | — | — | — | — | (4) | (4) | 14 | 9 | |||||||||||||||||||||||||||||||||||||||
| Total comprehensive income (loss) | — | — | 27 | — | (4) | 23 | 47 | 70 | |||||||||||||||||||||||||||||||||||||||
| Capital increase | — | — | — | — | — | — | 2 | 2 | |||||||||||||||||||||||||||||||||||||||
| Stock-based compensation | — | 9 | — | — | — | 9 | — | 9 | |||||||||||||||||||||||||||||||||||||||
| Shares issued under stock award plans | — | (2) | — | — | — | (2) | — | (2) | |||||||||||||||||||||||||||||||||||||||
| Return of capital | — | — | — | — | — | — | (19) | (19) | |||||||||||||||||||||||||||||||||||||||
| Dividends declared | — | (40) | — | — | — | (40) | (86) | (126) | |||||||||||||||||||||||||||||||||||||||
| Balance at March 31, 2025 | 21 | 1,898 | (633) | (156) | 512 | 1,642 | 353 | 1,994 | |||||||||||||||||||||||||||||||||||||||
| Net (loss) income | — | — | (58) | — | — | (58) | 38 | (20) | |||||||||||||||||||||||||||||||||||||||
| Other comprehensive (loss) income, net of tax | — | — | — | — | (7) | (7) | 20 | 13 | |||||||||||||||||||||||||||||||||||||||
| Total comprehensive (loss) income | — | — | (58) | — | (7) | (65) | 57 | (8) | |||||||||||||||||||||||||||||||||||||||
| Capital increase | — | — | — | — | — | — | 180 | 180 | |||||||||||||||||||||||||||||||||||||||
| Stock-based compensation | — | 5 | — | — | — | 5 | — | 5 | |||||||||||||||||||||||||||||||||||||||
| Shares issued under stock award plans | — | (10) | — | — | — | (10) | — | (10) | |||||||||||||||||||||||||||||||||||||||
| Return of capital | — | — | — | — | — | — | (28) | (28) | |||||||||||||||||||||||||||||||||||||||
| Dividends declared | — | (41) | — | — | — | (41) | (82) | (122) | |||||||||||||||||||||||||||||||||||||||
| Balance at June 30, 2025 | 21 | 1,852 | (691) | (156) | 505 | 1,531 | 481 | 2,012 | |||||||||||||||||||||||||||||||||||||||
9
Table of Contents
| Common Stock | Additional Paid-In Capital | Retained Earnings (Deficit) | Treasury Stock | Accumulated Other Comprehensive Income | Total Brightstar Lottery PLC Equity | Non- Controlling Interests | Total Equity | ||||||||||||||||||||||||||||||||||||||||
| Balance at December 31, 2023 | 21 | 2,065 | (1,008) | (156) | 521 | 1,443 | 510 | 1,952 | |||||||||||||||||||||||||||||||||||||||
| Net income | — | — | 82 | — | — | 82 | 47 | 128 | |||||||||||||||||||||||||||||||||||||||
| Other comprehensive income (loss), net of tax | — | — | — | — | 8 | 8 | (16) | (9) | |||||||||||||||||||||||||||||||||||||||
| Total comprehensive income | — | — | 82 | — | 8 | 90 | 30 | 120 | |||||||||||||||||||||||||||||||||||||||
| Capital increase | — | — | — | — | — | — | 2 | 2 | |||||||||||||||||||||||||||||||||||||||
| Stock-based compensation | — | 11 | — | — | — | 11 | — | 11 | |||||||||||||||||||||||||||||||||||||||
| Return of capital | — | — | — | — | — | — | (27) | (27) | |||||||||||||||||||||||||||||||||||||||
| Dividends declared | — | (40) | — | — | — | (40) | (161) | (201) | |||||||||||||||||||||||||||||||||||||||
| Balance at March 31, 2024 | 21 | 2,036 | (926) | (156) | 529 | 1,504 | 354 | 1,858 | |||||||||||||||||||||||||||||||||||||||
| Net income | — | — | 42 | — | — | 42 | 43 | 85 | |||||||||||||||||||||||||||||||||||||||
| Other comprehensive income (loss), net of tax | — | — | — | — | 4 | 4 | (3) | 1 | |||||||||||||||||||||||||||||||||||||||
| Total comprehensive income | — | — | 42 | — | 4 | 45 | 40 | 86 | |||||||||||||||||||||||||||||||||||||||
| Stock-based compensation | — | 11 | — | — | — | 11 | — | 11 | |||||||||||||||||||||||||||||||||||||||
| Shares issued under stock award plans | — | (17) | — | — | — | (17) | — | (17) | |||||||||||||||||||||||||||||||||||||||
| Return of capital | — | — | — | — | — | — | (18) | (18) | |||||||||||||||||||||||||||||||||||||||
| Dividends declared | — | (40) | — | — | — | (40) | (2) | (42) | |||||||||||||||||||||||||||||||||||||||
| Balance at June 30, 2024 | 21 | 1,990 | (885) | (156) | 532 | 1,503 | 374 | 1,877 | |||||||||||||||||||||||||||||||||||||||
The accompanying notes are an integral part of these condensed consolidated financial statements.
10
Table of Contents
Brightstar Lottery PLC
Notes to the Condensed Consolidated Financial Statements (Unaudited)
1. Description of Business
In July 2025, we changed our corporate name from International Game Technology PLC to Brightstar Lottery PLC (NYSE: BRSL) (“Brightstar”). We will not distinguish between our prior and current corporate name and will refer to our current corporate name throughout this Form 6-K. As such, unless we expressly indicate or the context requires otherwise, the terms “Brightstar,” “company,” “we,” “us,” and “our” in this filing refer to Brightstar Lottery PLC (the “Parent”) and where appropriate, its consolidated subsidiaries.
Brightstar Lottery is a global leader in lottery delivering entertaining and responsible gaming experiences for players worldwide. Leveraging a wealth of compelling content, continuous investment in innovation, player insights, operational expertise, and leading-edge technology, our solutions deliver unrivalled gaming experiences that engage players and drive growth. As a pure play global lottery company, lottery operations, retail and digital solutions, and award-winning lottery games enable our customers to achieve their goals, fulfill player needs and distribute the benefits to communities. Brightstar Lottery has a well-established local presence and relationships with governments and regulators around the world, creating value by adhering to the highest standards of service, integrity, and responsibility.
On July 26, 2024, the Parent and Everi Holdings Inc. (“Everi”) entered into definitive agreements (the “Transaction Agreements”) whereby IGT Gaming and Everi will be simultaneously acquired by a holding company (“the Buyer”) owned by the Apollo Funds in an all-cash transaction (the “Transaction”). On July 1, 2025, the Company completed the sale. Refer to Note 16 - Subsequent Event herein for additional information.
2. Summary of Significant Accounting Policies
Basis of Preparation
The accompanying condensed consolidated financial statements and notes of the Company are prepared in accordance with accounting principles generally accepted in the United States of America (“GAAP”) for interim financial information. Accordingly, these interim financial statements do not include all of the information and note disclosures required by GAAP for complete financial statements, but reflect all normal recurring adjustments that are, in the opinion of management, necessary for a fair statement of the interim period results. The year-end condensed consolidated balance sheet data was derived from audited financial statements, but does not include all disclosures required by GAAP. These condensed consolidated financial statements should be read in conjunction with the consolidated financial statements and related notes included in our annual report on Form 20-F for the year ended December 31, 2024 filed with the U.S. Securities and Exchange Commission on February 25, 2025 (the “2024 Form 20-F”).
Our condensed consolidated financial statements are stated in millions of United States (“U.S.”) dollars, except per share data or unless otherwise indicated, and are computed based on the amounts in thousands. Certain amounts in columns and rows within tables may not foot due to rounding. Percentages and earnings per share amounts presented are calculated from the underlying unrounded amounts.
We have reflected the financial results of IGT Gaming as discontinued operations in our condensed consolidated statements of operations and reflected the assets and liabilities of IGT Gaming as held for sale in our condensed consolidated balance sheets, for all periods presented. Retrospective reclassifications have been made to prior period financial statements and disclosures to present IGT Gaming as discontinued operations (see Note 3. Discontinued Operations and Assets Held for Sale). Unless otherwise noted, amounts and disclosures included herein relate to our continuing operations.
Use of Estimates
The preparation of our condensed consolidated financial statements requires us to make estimates, judgments, and assumptions which affect the reported amounts of assets, liabilities, equity, revenues and expenses, and related disclosure of contingent liabilities. We evaluate our estimates, judgments, and methodologies on an ongoing basis. We base our estimates on historical experience and on various other assumptions that we believe are reasonable, the results of which form the basis for making judgments about the carrying values of assets, liabilities, and equity, and the amount of revenues and expenses. Accordingly, actual results and outcomes could differ from those estimates.
11
Table of Contents
Significant Accounting Policies
There have been no material changes to our significant accounting policies described in Note 2 - Summary of Significant Accounting Policies, in our 2024 Form 20-F.
Accounting Pronouncements
The Company closely monitors all Accounting Standard Updates (“ASUs”) issued by the Financial Accounting Standards Board (“FASB”) and other authoritative guidance. During the six months ended June 30, 2025, there were no ASUs issued that are expected to have a significant effect on the condensed consolidated financial statements. Additionally, there were no ASUs adopted during the six months ended June 30, 2025 with a significant effect on the condensed consolidated financial statements.
In December 2023, the FASB issued ASU No. 2023-09, Improvements to Income Tax Disclosures (“ASU 2023-09”), which enhances annual disclosure requirements with respect to income taxes. The Company will apply the ASU prospectively by providing the revised disclosures for the period ending December 31, 2025 and will continue to provide the pre-ASU disclosures for the prior periods.
3. Discontinued Operations and Assets Held for Sale
On July 26, 2024, the Parent and Everi entered into the Transaction Agreements whereby IGT Gaming and Everi will be simultaneously acquired in the Transaction. Refer to Note 16 - Subsequent Event herein for additional information.
The criteria for reporting the IGT Gaming disposal group as held for sale were met upon entering into the Transaction Agreements. The Transaction represents a strategic shift that will have a major effect on the Company’s operations and financial results and accordingly, IGT Gaming is presented in the accompanying condensed consolidated financial statements as a discontinued operation for all periods presented.
The following represents the major classes of the IGT Gaming assets and liabilities held for sale:
| June 30, | December 31, | |||||||||||||
| ($ in millions) | 2025 | 2024 | ||||||||||||
| Assets: | ||||||||||||||
| Cash and cash equivalents | 132 | 63 | ||||||||||||
| Trade and other receivables, net | 276 | 321 | ||||||||||||
| Inventories, net | 162 | 153 | ||||||||||||
| Other current assets | 287 | 254 | ||||||||||||
| Systems, equipment and other assets related to contracts, net and Property, plant and equipment, net | 477 | 408 | ||||||||||||
| Goodwill | 1,845 | 1,814 | ||||||||||||
| Intangible assets, net | 1,467 | 1,432 | ||||||||||||
| Other non-current assets | 311 | 321 | ||||||||||||
| Assets held for sale | 4,957 | 4,765 | ||||||||||||
| Liabilities: | ||||||||||||||
| Accounts payable | 128 | 139 | ||||||||||||
| Other current liabilities | 258 | 408 | ||||||||||||
| Deferred income taxes | 153 | 153 | ||||||||||||
| Other non-current liabilities | 442 | 442 | ||||||||||||
| Liabilities held for sale | 981 | 1,142 | ||||||||||||
12
Table of Contents
Shown below is the summarized statement of operations and selected cash flows for the IGT Gaming discontinued operations:
| For the three months ended June 30, | For the six months ended June 30, | |||||||||||||||||||||||||
| ($ in millions) | 2025 | 2024 | 2025 | 2024 | ||||||||||||||||||||||
| Total revenue | 402 | 436 | 796 | 842 | ||||||||||||||||||||||
| Total cost of revenue | 155 | 216 | 290 | 416 | ||||||||||||||||||||||
| Selling, general and administrative | 87 | 102 | 172 | 206 | ||||||||||||||||||||||
Interest expense, net (1) | 19 | 20 | 38 | 39 | ||||||||||||||||||||||
| Other expense, net | 73 | 69 | 149 | 127 | ||||||||||||||||||||||
| Income from discontinued operations before provision for income taxes | 68 | 29 | 146 | 54 | ||||||||||||||||||||||
| Provision for income taxes | 29 | 28 | 55 | 41 | ||||||||||||||||||||||
| Income from discontinued operations, net of tax | 40 | — | 92 | 13 | ||||||||||||||||||||||
| Less: Net income attributable to non-controlling interests from discontinued operations | 2 | 2 | 4 | 3 | ||||||||||||||||||||||
| Income from discontinued operations attributable to Brightstar Lottery PLC | 38 | (2) | 88 | 10 | ||||||||||||||||||||||
(1) Includes interest expense allocated to discontinued operations for contractual and planned repayments related to $2 billion of debt that is required to be repaid as a result of the Transaction, within six months of the closing date, in accordance with our Revolving Credit Facilities and Term Loan Facilities agreements.
Continuing Involvement
The Company will have continuing involvement with IGT Gaming via a transition services agreement (“TSA”). As part of the TSA, the Company will provide various services such as information technology (i.e. data center hosting), human resources (i.e. payroll and benefits), and other back-office services for which the Company will receive compensation. These services generally expire no more than two years after the Transaction closes.
In addition, the Company and IGT Gaming will license or sublicense certain software, brands, and intellectual property to one another, which are subject to expiration based on the underlying contractual or statutory terms.
| For the six months ended June 30, | ||||||||||||||
| Selected Cash Flows from Discontinued Operations ($ millions) | 2025 | 2024 | ||||||||||||
| Depreciation and amortization | — | 154 | ||||||||||||
Cash paid during the period for: | ||||||||||||||
Interest | 49 | 45 | ||||||||||||
Income taxes | 50 | 44 | ||||||||||||
| Capital expenditures | 93 | 110 | ||||||||||||
| Payments on license obligations | 137 | 14 | ||||||||||||
13
Table of Contents
4. Revenue Recognition
Disaggregation of Revenue
The following table summarizes revenue disaggregated by the source of revenue:
| For the three months ended June 30, | For the six months ended June 30, | |||||||||||||||||||||||||
| ($ in millions) | 2025 | 2024 | 2025 | 2024 | ||||||||||||||||||||||
| Operating and facilities management contracts, gross | 629 | 622 | 1,222 | 1,277 | ||||||||||||||||||||||
| Upfront license fee amortization | (53) | (49) | (101) | (99) | ||||||||||||||||||||||
| Operating and facilities management contracts, net | 576 | 573 | 1,121 | 1,178 | ||||||||||||||||||||||
| Systems, software, and other | 12 | 13 | 25 | 27 | ||||||||||||||||||||||
| Service revenue | 588 | 586 | 1,146 | 1,205 | ||||||||||||||||||||||
| Product sales | 42 | 27 | 68 | 69 | ||||||||||||||||||||||
| Total revenue | 631 | 613 | 1,214 | 1,274 | ||||||||||||||||||||||
Contract Balances
Contract assets reflect revenue recognized in advance of invoicing our customer. The amount of contract assets, which is included within Other current assets and Other non-current assets in the condensed consolidated balance sheets, was $52 million and $51 million at June 30, 2025 and December 31, 2024, respectively.
Contract liabilities relate to payments received in advance of the satisfaction of performance under the contract. The amount of contract liabilities, which is included within Other current liabilities and Other non-current liabilities in the condensed consolidated balance sheets, was $53 million and $61 million at June 30, 2025 and December 31, 2024, respectively.
The amount of revenue recognized during the six months ended June 30, 2025 that was included in the contract liabilities balance at the beginning of the period was $19 million.
Transaction Price Allocated to Remaining Performance Obligations
At June 30, 2025, the transaction price allocated to unsatisfied performance obligations for contracts expected to be greater than one year, or performance obligations for which we do not have a right to consideration from the customer in the amount that corresponds to the value to the customer for our performance completed to date, variable consideration which is not accounted for in accordance with the sales-based or usage-based royalties guidance, or contracts which are not wholly unperformed, is approximately $863 million. Of this amount, we expect to recognize as revenue approximately 28% within the next 12 months, approximately 32% between 13 and 36 months, approximately 21% between 37 and 60 months, and the remaining balance through July 9, 2036.
5. Trade and Other Receivables
Trade and Other Receivables, net
Trade and other receivables are recorded at amortized cost, net of allowance for credit losses, and represent a contractual right to receive money on demand or on fixed or determinable dates that are typically short-term with payment due within 90 days or less.
| ($ in millions) | June 30, 2025 | December 31, 2024 | ||||||||||||
| Trade and other receivables, gross | 429 | 469 | ||||||||||||
Allowance for credit losses (1) | (1) | (1) | ||||||||||||
| Trade and other receivables, net | 428 | 468 | ||||||||||||
(1) As of and for the six months ended June 30, 2025 and the year ended December 31, 2024, balances and activity related to the allowance for credit losses were immaterial.
14
Table of Contents
We enter into various factoring agreements with third-party financial institutions to sell certain of our trade receivables. We factored trade receivables of $217 million and $403 million during the six months ended June 30, 2025 and year ended December 31, 2024, respectively, under these factoring arrangements. The cash received from these arrangements is reflected as net cash provided by operating activities in the condensed consolidated statements of cash flows. In certain of these factoring arrangements, for ease of administration, we will collect customer payments related to the factored gross receivables, including our trade receivables, which we then remit to the financial institutions. At June 30, 2025 and December 31, 2024, we had $80 million and $152 million, respectively, that was collected on behalf of the financial institutions and recorded as other current liabilities in the condensed consolidated balance sheets. The net cash flows relating to these collections are reported as financing activities in the condensed consolidated statements of cash flows.
6. Inventories, net
| ($ in millions) | June 30, 2025 | December 31, 2024 | ||||||||||||
| Raw materials | 26 | 25 | ||||||||||||
| Work in progress | 3 | 3 | ||||||||||||
| Finished goods | 90 | 87 | ||||||||||||
| Inventories, gross | 119 | 114 | ||||||||||||
| Excess and obsolescence reserve | (2) | (2) | ||||||||||||
| Inventories, net | 117 | 113 | ||||||||||||
7. Leases
Lessee
We have operating and finance leases for real estate (warehouses, office space, data centers), vehicles, communication equipment, and other equipment. Many of our real estate leases include one or more options to renew, while some include termination options. Certain vehicle and equipment leases include residual value guarantees and options to purchase the leased asset. Many of our real estate leases include variable payments for maintenance, real estate taxes, and insurance that are determined based on the actual costs incurred by the landlord. As of June 30, 2025, the Company does not have any significant leases that have not yet commenced.
The classification of our operating and finance leases in the condensed consolidated balance sheets is as follows:
| ($ in millions) | Balance Sheet Classification | June 30, 2025 | December 31, 2024 | |||||||||||||||||
| Assets: | ||||||||||||||||||||
| Operating ROU asset | Operating lease right-of-use assets | 99 | 102 | |||||||||||||||||
Finance ROU asset, net (1) | Other non-current assets | 17 | 16 | |||||||||||||||||
| Total lease assets | 117 | 118 | ||||||||||||||||||
| Liabilities: | ||||||||||||||||||||
| Operating lease liability, current | Other current liabilities | 25 | 24 | |||||||||||||||||
| Finance lease liability, current | Other current liabilities | 8 | 7 | |||||||||||||||||
| Operating lease liability, non-current | Operating lease liabilities | 79 | 83 | |||||||||||||||||
| Finance lease liability, non-current | Other non-current liabilities | 14 | 14 | |||||||||||||||||
| Total lease liabilities | 127 | 128 | ||||||||||||||||||
(1) Finance right-of-use (“ROU”) assets are recorded net of accumulated amortization of $17 million and $16 million at June 30, 2025 and December 31, 2024, respectively.
15
Table of Contents
Weighted-average remaining lease terms and discount rates are as follows:
| June 30, 2025 | December 31, 2024 | |||||||||||||
| Weighted-Average Remaining Lease Term (in years) | ||||||||||||||
| Operating leases | 2.51 | 2.59 | ||||||||||||
| Finance leases | 3.06 | 3.13 | ||||||||||||
| Weighted-Average Discount Rate | ||||||||||||||
| Operating leases | 2.34 | % | 2.34 | % | ||||||||||
| Finance leases | 5.11 | % | 5.06 | % | ||||||||||
Components of lease expense are as follows:
| For the three months ended June 30, | For the six months ended June 30, | |||||||||||||||||||||||||
| ($ in millions) | 2025 | 2024 | 2025 | 2024 | ||||||||||||||||||||||
| Operating lease costs | 8 | 8 | 16 | 15 | ||||||||||||||||||||||
Finance lease costs (1) | 2 | 2 | 3 | 3 | ||||||||||||||||||||||
| Short-term lease costs | 6 | 6 | 12 | 12 | ||||||||||||||||||||||
Variable lease costs (2) | 3 | 3 | 7 | 7 | ||||||||||||||||||||||
(2) Includes immaterial amounts related to sublease income.
Finance lease costs include amortization expense as follows:
| For the three months ended June 30, | For the six months ended June 30, | |||||||||||||||||||||||||
| ($ in millions) | 2025 | 2024 | 2025 | 2024 | ||||||||||||||||||||||
Amortization expense of Finance ROU assets | 1 | 1 | 3 | 3 | ||||||||||||||||||||||
Maturities of operating and finance lease liabilities at June 30, 2025 are as follows ($ in millions):
| Year | Operating Leases | Finance Leases | Total | |||||||||||||||||
| Remainder of 2025 | 16 | 4 | 21 | |||||||||||||||||
| 2026 | 28 | 8 | 36 | |||||||||||||||||
| 2027 | 20 | 6 | 26 | |||||||||||||||||
| 2028 | 15 | 3 | 18 | |||||||||||||||||
| 2029 | 13 | 2 | 15 | |||||||||||||||||
| 2030 and thereafter | 31 | — | 32 | |||||||||||||||||
| Total lease payments | 123 | 24 | 148 | |||||||||||||||||
| Less: Imputed interest | (19) | (2) | (21) | |||||||||||||||||
| Present value of lease liabilities | 105 | 22 | 127 | |||||||||||||||||
Cash flow information and non-cash activity related to leases is as follows:
| For the six months ended June 30, | ||||||||||||||
| ($ in millions) | 2025 | 2024 | ||||||||||||
| Cash paid for amounts included in the measurement of lease liabilities: | ||||||||||||||
| Operating cash flows used for operating and finance leases | 17 | 15 | ||||||||||||
| Finance cash flows used for finance leases | 4 | 3 | ||||||||||||
| Non-cash activity: | ||||||||||||||
| ROU assets obtained in exchange for lease obligations (net of early terminations) | ||||||||||||||
| Operating leases | 7 | 6 | ||||||||||||
| Finance leases | 4 | 1 | ||||||||||||
16
Table of Contents
8. Restructuring
OPtiMa 3.0
During the third quarter of 2024, we initiated a multi-phase restructuring plan (“OPtiMa 3.0”) to realign and optimize our cost structure due to the ending of the TSA period after the two Italian dispositions (Italian gaming B2C businesses & Italian commercial services business) and the Transaction. The plan is focused on realigning and optimizing our general and administrative activities. Actions under the plan include the reduction of approximately 3% of our workforce, the optimization of our real estate footprint given our hybrid workforce and headcount reductions, and the reduction of other indirect costs previously incurred due to a larger business portfolio.
Phase 1 commenced in the third quarter of 2024 and is expected to be completed within a 12-month period from inception. In the second quarter of 2025, we commenced Phase 2. Phase 2 is expected to be completed within a 12-month period from inception. During the three and six months ended June 30, 2025, we incurred $23 million under Phase 2 of the plan in severance and related employee costs, and expect to incur an additional $3 million in other costs during the 12-month period.
The following table summarizes consolidated restructuring expense for all restructuring programs by type of cost:
| ($ in millions) | For the three months ended June 30, 2025 | For the six months ended June 30, 2025 | ||||||||||||
| Severance and Related Employee Costs | 21 | 21 | ||||||||||||
| Other | — | — | ||||||||||||
| Total | 21 | 21 | ||||||||||||
Rollforward of Restructuring Liability
The following table presents the activity in the restructuring liability under the above and other ongoing plans for the six months ended June 30, 2025:
OPtiMa 3.0 Plan | ||||||||||||||||||||||||||
| ($ in millions) | Phase 1 | Phase 2 | 2021 Italian Workforce Redundancies | Total | ||||||||||||||||||||||
| Balance at beginning of period | 29 | — | 16 | 46 | ||||||||||||||||||||||
| Restructuring expense, net | — | 23 | — | 23 | ||||||||||||||||||||||
| Cash payments | (13) | — | (2) | (15) | ||||||||||||||||||||||
Other adjustments, net(1) | 1 | — | 2 | 3 | ||||||||||||||||||||||
| Balance at end of period | 18 | 23 | 16 | 56 | ||||||||||||||||||||||
| Cumulative expense | 36 | 23 | 31 | 90 | ||||||||||||||||||||||
(1) Includes foreign currency translation adjustments and a Phase 1 reduction of $2 million due to lower actual expense and savings from voluntary terminations.
All liabilities are related to severance and related employee costs.
17
Table of Contents
9. Debt
The Company’s debt obligations consist of the following:
| June 30, 2025 | December 31, 2024 | |||||||||||||||||||||||||||||||||||||
| ($ in millions) | Principal | Debt issuance cost, net | Total | Principal | Debt issuance cost, net | Total | ||||||||||||||||||||||||||||||||
| 4.125% Senior Secured U.S. Dollar Notes due April 2026 | — | — | — | 750 | (2) | 748 | ||||||||||||||||||||||||||||||||
| 3.500% Senior Secured Euro Notes due June 2026 | — | — | — | 779 | (2) | 777 | ||||||||||||||||||||||||||||||||
| 6.250% Senior Secured U.S. Dollar Notes due January 2027 | 750 | (2) | 748 | 750 | (2) | 748 | ||||||||||||||||||||||||||||||||
| 2.375% Senior Secured Euro Notes due April 2028 | 586 | (2) | 584 | 519 | (2) | 517 | ||||||||||||||||||||||||||||||||
| 5.250% Senior Secured U.S. Dollar Notes due January 2029 | 750 | (3) | 747 | 750 | (4) | 746 | ||||||||||||||||||||||||||||||||
| 4.250% Senior Secured Euro Notes due March 2030 | 586 | (7) | 579 | 519 | (6) | 513 | ||||||||||||||||||||||||||||||||
| Senior Secured Notes | 2,672 | (14) | 2,658 | 4,068 | (18) | 4,050 | ||||||||||||||||||||||||||||||||
| Euro Term Loan Facilities due January 2027 | 469 | (4) | 465 | 623 | (5) | 619 | ||||||||||||||||||||||||||||||||
| Euro Term Loan Facilities due September 2030 | 1,172 | (6) | 1,166 | — | — | — | ||||||||||||||||||||||||||||||||
| Revolving Credit Facility A due July 2027 | 375 | (5) | 370 | 163 | (6) | 157 | ||||||||||||||||||||||||||||||||
| Revolving Credit Facility B due July 2027 | 35 | (6) | 30 | 334 | (6) | 328 | ||||||||||||||||||||||||||||||||
| Long-term debt, less current portion | 4,723 | (35) | 4,688 | 5,188 | (35) | 5,153 | ||||||||||||||||||||||||||||||||
| 4.125% Senior Secured U.S. Dollar Notes due April 2026 | 750 | (1) | 749 | — | — | — | ||||||||||||||||||||||||||||||||
| 3.500% Senior Secured Euro Notes due June 2026 | 879 | (1) | 878 | — | — | — | ||||||||||||||||||||||||||||||||
| Euro Term Loan Facilities due January 2027 | 234 | — | 234 | 208 | — | 208 | ||||||||||||||||||||||||||||||||
| Current portion of long-term debt | 1,863 | (3) | 1,861 | 208 | — | 208 | ||||||||||||||||||||||||||||||||
| Short-term borrowings | — | — | — | — | — | — | ||||||||||||||||||||||||||||||||
| Total debt | 6,586 | (37) | 6,549 | 5,396 | (35) | 5,361 | ||||||||||||||||||||||||||||||||
At June 30, 2025 and December 31, 2024, there were no debt issuance costs, net recorded as other non-current assets in the condensed consolidated balance sheets. Refer to Note 16 - Subsequent Event herein for additional information as a result of the closing of the Transaction.
The principal amount of long-term debt maturing over the next five years and thereafter as of June 30, 2025 is as follows ($ in millions):
Year | U.S. Dollar Denominated | Euro Denominated | Total | |||||||||||||||||
| Remainder of 2025 | — | — | — | |||||||||||||||||
| 2026 | 750 | 1,113 | 1,863 | |||||||||||||||||
| 2027 | 1,125 | 738 | 1,863 | |||||||||||||||||
| 2028 | — | 820 | 820 | |||||||||||||||||
| 2029 | 750 | 234 | 984 | |||||||||||||||||
| 2030 and thereafter | — | 1,055 | 1,055 | |||||||||||||||||
| Total principal amounts | 2,625 | 3,961 | 6,586 | |||||||||||||||||
At June 30, 2025 and December 31, 2024, we were in compliance with all covenants under our outstanding debt agreements.
2030 Euro Term Loan Facilities
On March 14, 2025, the Parent entered into a senior facilities agreement (the “2030 Facilities Agreement”) which provided €1 billion of term loan facilities to IGT Lottery S.p.A. as borrower (together, the “2030 Facilities”). The 2030 Facilities consist of a facility in the amount of €500 million (“Facility A”), which may be used for general corporate purposes, and a facility also in the amount of €500 million (“Facility B”) to be utilized in connection with the Italian Gioco del Lotto license (the “Italian Lotto license”), for use toward the Italian Lotto license upfront fee. Facility A was utilized on March 24, 2025 for repayment of
18
Table of Contents
borrowings under the Revolving Credit Facilities. Facility B was utilized on June 5, 2025, following the announcement that the Company was the preferred bidder to be awarded the Italian Lotto license.
IGT Lottery S.p.A. must repay the 2030 Facilities in installments, as detailed below:
| Due Date | Facility A (€ in millions) | Facility B (€ in millions) | ||||||||||||
| September 14, 2027 | 100 | 100 | ||||||||||||
| September 14, 2028 | 100 | 100 | ||||||||||||
| September 14, 2029 | 100 | 100 | ||||||||||||
| September 14, 2030 | 200 | 200 | ||||||||||||
Interest on the 2030 Facilities is payable either three or six months in arrears at rates equal to the applicable EURIBOR plus a margin based on Brightstar’s public debt ratings.
The 2030 Facilities are guaranteed by the Parent and certain subsidiaries of the Parent. Upon the occurrence of certain events, IGT Lottery S.p.A. may be required to prepay the 2030 Facilities in full. The 2030 Facilities Agreement provides for standard covenants and restrictions, which are substantially identical to those under the agreements for the Revolving Credit Facilities and other term loan facilities. The 2030 Facilities Agreement limits the aggregate amount that the Parent can pay with respect to dividends and repurchases of ordinary shares in each year to $400 million if any two of our public debt ratings by Fitch, Moody’s, and S&P are lower than Ba1/BB+ and $550 million if any two of our public debt ratings by Fitch, Moody’s, and S&P are equal to or higher than Ba1/BB+, and provides that such limit is eliminated if any two of our public debt ratings by Moody’s, S&P, and Fitch are equal to or higher than Baa3/BBB-. The 2030 Facilities Agreement permits shareholder distributions and/or share buybacks up to an amount not exceeding the difference between the net proceeds of the Transaction and $2 billion. The 2030 Facilities Agreement also contains customary covenants (including maintaining a minimum ratio of EBITDA to net interest costs and maximum ratio of total net debt to EBITDA) and events of default.
Fair Value of Debt
Debt is categorized within Level 2 of the fair value hierarchy. Senior Secured Notes are valued using quoted market prices or dealer quotes for the identical financial instrument when traded as an asset in markets that are not active. All other debt is valued using current interest rates, excluding the effect of debt issuance costs. The table below excludes short-term borrowings.
| ($ in millions) | June 30, 2025 | December 31, 2024 | ||||||||||||
| Carrying value | 6,549 | 5,361 | ||||||||||||
| Fair value | 6,572 | 5,346 | ||||||||||||
Interest Expense, net
| For the three months ended June 30, | For the six months ended June 30, | |||||||||||||||||||||||||
| ($ in millions) | 2025 | 2024 | 2025 | 2024 | ||||||||||||||||||||||
| Senior Secured Notes | 32 | 34 | 64 | 67 | ||||||||||||||||||||||
| Revolving Credit Facilities | 9 | 13 | 21 | 28 | ||||||||||||||||||||||
| Term Loan Facilities | 11 | 6 | 15 | 12 | ||||||||||||||||||||||
| Other | — | 2 | 1 | 4 | ||||||||||||||||||||||
| Interest expense | 52 | 55 | 101 | 111 | ||||||||||||||||||||||
| Interest income | (4) | (2) | (7) | (4) | ||||||||||||||||||||||
| Interest expense, net | 49 | 53 | 94 | 106 | ||||||||||||||||||||||
10. Commitments and Contingencies
Legal Proceedings
From time to time, the Parent and/or one or more of its subsidiaries are party to legal, regulatory, or administrative proceedings regarding, among other matters, claims by and against us, and injunctions by third parties arising out of the ordinary course of business or its other business activities. Licenses are also subject to legal challenges by competitors seeking to annul awards
19
Table of Contents
made to the Company. The Parent and/or one or more of its subsidiaries are also, from time to time, subjects of, or parties to, ethics and compliance inquiries and investigations related to the Company’s ongoing operations. Legal proceedings that were previously disclosed may no longer be reported because, as a result of the rulings in the case, settlements, changes in our business, or other developments, in our judgment, they are no longer material to the Company’s business, financial position, or results of operations.
At June 30, 2025, provisions for all legal proceedings was $4 million. With respect to legal proceedings where we have determined that an incremental loss is reasonably possible but we are unable to determine an estimate of that reasonably possible loss in excess of amounts already accrued, no additional amounts have been accrued, given the uncertainties of litigation and the inherent difficulty of predicting the outcome of legal proceedings.
11. Income Taxes
| For the three months ended June 30, | For the six months ended June 30, | |||||||||||||||||||||||||
| ($ in millions, except percentages) | 2025 | 2024 | 2025 | 2024 | ||||||||||||||||||||||
| (Loss) income before provision for income taxes | (10) | 127 | 46 | 300 | ||||||||||||||||||||||
| Provision for income taxes | 50 | 43 | 97 | 100 | ||||||||||||||||||||||
Effective income tax rate (1) | (482.6) | % | 33.6 | % | 212.9 | % | 33.3 | % | ||||||||||||||||||
(1) Determined using an estimated annual effective income tax rate.
The effective income tax rate for the three and six months ended June 30, 2025 of (482.6)% and 212.9%, respectively differed from the U.K. statutory rate of 25.0% primarily due to operating losses in jurisdictions in which we do not receive a tax benefit, foreign rate differential, and the impact of the international provisions of the U.S. Tax Cuts and Jobs Act of 2017 (the “Tax Act”).
The effective income tax rate for the three and six months ended June 30, 2024 of 33.6% and 33.3%, respectively differed from the U.K. statutory rate of 25.0% primarily due to operating losses in jurisdictions in which we do not receive a tax benefit, foreign rate differential, and the impact of the international provisions of the Tax Act.
At June 30, 2025 and December 31, 2024, we had reserves for uncertain tax positions of $17 million.
At June 30, 2025 and December 31, 2024, interest and penalties were accrued for uncertain tax positions of $29 million and $27 million, respectively.
Pillar Two Global Minimum Tax Framework - Legislative Updates
In December 2021, the Organization for Economic Cooperation and Development (“OECD”) enacted model rules for a new global minimum tax framework (“Pillar Two”). Many non-U.S. tax jurisdictions, including the European Union, have committed to adopting Pillar Two, which establishes a global minimum tax of 15% and is intended to be effective for tax years beginning in 2024. The OECD has since issued administrative guidance providing transition and safe harbor rules around the implementation of the Pillar Two global minimum tax. Based on the Company’s current analysis of the Pillar Two provisions, these tax law changes will not have a material impact on the Company’s financial statements for calendar year 2025.
U.S. Tax Update
On July 4, 2025, the “One Big Beautiful Bill Act” (“OBBBA”) was enacted in the U.S. The legislation introduces a range of significant tax measures, such as the permanent extension of certain expiring provisions of the Tax Act, modifications to the international tax framework, and the restoration of favorable tax treatment for certain business-related tax items. The OBBBA includes multiple effective dates, with certain provisions applicable beginning in 2025 and others phased in through 2027. We are currently assessing its impact on our consolidated financial statements.
12. Shareholders' Equity
Dividends
In the second quarter of 2025, the Board of Directors of the Parent (the “Board”) declared a quarterly cash dividend of $0.20 per share, paid on June 12, 2025.
20
Table of Contents
On July 1, 2025, the Board declared a special cash dividend equal to $3.00 per share. The special dividend, of approximately $609 million in the aggregate, is payable on July 29, 2025, to shareholders of record on July 14, 2025.
On July 24, 2025, the Board declared a quarterly cash dividend of $0.20 per share. The dividend, of approximately $41 million in the aggregate, is payable on August 26, 2025, to shareholders of record on August 12, 2025. Future dividends are subject to Board approval.
Accumulated Other Comprehensive Income (“AOCI”)
The following tables detail the changes in AOCI:
| For the three months ended June 30, 2025 | ||||||||||||||||||||||||||||||||||||||
| Unrealized Gain (Loss) on: | AOCI | |||||||||||||||||||||||||||||||||||||
| ($ in millions) | Foreign Currency Translation | Hedges | Other | Total | Attributable to non-controlling interests | Attributable to Brightstar Lottery PLC | ||||||||||||||||||||||||||||||||
| Balance at March 31, 2025 | 464 | (5) | 3 | 463 | 49 | 512 | ||||||||||||||||||||||||||||||||
| Change during period | 17 | (6) | — | 11 | (20) | (8) | ||||||||||||||||||||||||||||||||
| Tax effect | — | 1 | — | 1 | — | 1 | ||||||||||||||||||||||||||||||||
| OCI | 17 | (5) | — | 13 | (20) | (7) | ||||||||||||||||||||||||||||||||
| Balance at June 30, 2025 | 482 | (10) | 3 | 475 | 29 | 505 | ||||||||||||||||||||||||||||||||
| For the three months ended June 30, 2024 | ||||||||||||||||||||||||||||||||||||||
| Unrealized Gain (Loss) on: | AOCI | |||||||||||||||||||||||||||||||||||||
| ($ in millions) | Foreign Currency Translation | Hedges | Other | Total | Attributable to non-controlling interests | Attributable to Brightstar Lottery PLC | ||||||||||||||||||||||||||||||||
| Balance at March 31, 2024 | 471 | (4) | 3 | 470 | 59 | 529 | ||||||||||||||||||||||||||||||||
| Change during period | 1 | — | — | 1 | 3 | 4 | ||||||||||||||||||||||||||||||||
| Tax effect | — | — | — | — | — | — | ||||||||||||||||||||||||||||||||
| OCI | 1 | — | — | 1 | 3 | 4 | ||||||||||||||||||||||||||||||||
| Balance at June 30, 2024 | 472 | (4) | 3 | 471 | 61 | 532 | ||||||||||||||||||||||||||||||||
| For the six months ended June 30, 2025 | ||||||||||||||||||||||||||||||||||||||
| Unrealized Gain (Loss) on: | AOCI | |||||||||||||||||||||||||||||||||||||
| ($ in millions) | Foreign Currency Translation | Hedges | Other | Total | Attributable to non-controlling interests | Attributable to Brightstar Lottery PLC | ||||||||||||||||||||||||||||||||
| Balance at December 31, 2024 | 452 | (2) | 3 | 453 | 63 | 516 | ||||||||||||||||||||||||||||||||
| Change during period | 29 | (9) | — | 20 | (33) | (13) | ||||||||||||||||||||||||||||||||
| Tax effect | — | 2 | — | 2 | — | 2 | ||||||||||||||||||||||||||||||||
| OCI | 29 | (7) | — | 22 | (33) | (11) | ||||||||||||||||||||||||||||||||
| Balance at June 30, 2025 | 482 | (10) | 3 | 475 | 29 | 505 | ||||||||||||||||||||||||||||||||
| For the six months ended June 30, 2024 | ||||||||||||||||||||||||||||||||||||||
| Unrealized Gain (Loss) on: | AOCI | |||||||||||||||||||||||||||||||||||||
| ($ in millions) | Foreign Currency Translation | Hedges | Other | Total | Attributable to non-controlling interests | Attributable to Brightstar Lottery PLC | ||||||||||||||||||||||||||||||||
| Balance at December 31, 2023 | 481 | (6) | 3 | 479 | 42 | 521 | ||||||||||||||||||||||||||||||||
| Change during period | (9) | 2 | — | (7) | 19 | 12 | ||||||||||||||||||||||||||||||||
| Tax effect | — | — | — | — | — | — | ||||||||||||||||||||||||||||||||
| OCI | (9) | 2 | — | (8) | 19 | 12 | ||||||||||||||||||||||||||||||||
| Balance at June 30, 2024 | 472 | (4) | 3 | 471 | 61 | 532 | ||||||||||||||||||||||||||||||||
21
Table of Contents
13. Earnings Per Share
The following table presents the computation of basic and diluted income per share of common stock:
| For the three months ended June 30, | For the six months ended June 30, | |||||||||||||||||||||||||
| ($ and shares in millions, except per share amounts) | 2025 | 2024 | 2025 | 2024 | ||||||||||||||||||||||
| Numerator: | ||||||||||||||||||||||||||
| Net (loss) income from continuing operations attributable to Brightstar Lottery PLC | (96) | 43 | (119) | 114 | ||||||||||||||||||||||
| Net income (loss) from discontinued operations attributable to Brightstar Lottery PLC | 38 | (2) | 88 | 10 | ||||||||||||||||||||||
| Net (loss) income attributable to Brightstar Lottery PLC | (58) | 42 | (31) | 123 | ||||||||||||||||||||||
| Denominator: | ||||||||||||||||||||||||||
| Weighted-average shares - basic | 203 | 201 | 203 | 201 | ||||||||||||||||||||||
| Incremental shares under stock-based compensation plans | — | 2 | — | 2 | ||||||||||||||||||||||
| Weighted-average shares - diluted | 203 | 203 | 203 | 203 | ||||||||||||||||||||||
| Net (loss) income from continuing operations attributable to Brightstar Lottery PLC per common share - basic | (0.47) | 0.21 | (0.59) | 0.57 | ||||||||||||||||||||||
| Net (loss) income from continuing operations attributable to Brightstar Lottery PLC per common share - diluted | (0.47) | 0.21 | (0.59) | 0.56 | ||||||||||||||||||||||
| Net income (loss) from discontinued operations attributable to Brightstar Lottery PLC per common share - basic | 0.19 | (0.01) | 0.43 | 0.05 | ||||||||||||||||||||||
| Net income (loss) from discontinued operations attributable to Brightstar Lottery PLC per common share - diluted | 0.19 | (0.01) | 0.43 | 0.05 | ||||||||||||||||||||||
| Net (loss) income attributable to Brightstar Lottery PLC per common share - basic | (0.29) | 0.21 | (0.15) | 0.61 | ||||||||||||||||||||||
| Net (loss) income attributable to Brightstar Lottery PLC per common share - diluted | (0.29) | 0.21 | (0.15) | 0.61 | ||||||||||||||||||||||
During periods when we are in a net loss position, certain outstanding stock options and unvested restricted stock awards are excluded from the computation of diluted earnings per share because including them would have had an antidilutive effect.
There were 2 million stock options and unvested restricted stock awards excluded from the computation of diluted earnings per share for the three months ended and six months ended June 30, 2025 as their inclusion would have had an antidilutive effect.
There were nominal stock options and unvested restricted stock awards excluded for the three months ended and six months ended June 30, 2024.
14. Segment Information
The Company operates and manages its continuing operations business as a single segment for the purposes of assessing performance and making operating decisions. We are a pure-play lottery business that derives revenues from providing sales, operations, product development, technology, and support to worldwide traditional lottery and iLottery customers.
The chief operating decision maker (“CODM”) reviews net income, as reported in the condensed consolidated financial results from continuing operations, when making decisions about allocating resources and evaluating financial performance. The CODM uses net income to evaluate the overall capital allocation strategy in deciding whether to reinvest profits into capital expenditures, or into other parts of the business such as paying down debt, paying dividends, or for acquisitions.
The segment’s accounting policies are the same as those described in Note 2 - Summary of Significant Accounting Policies. The measure of segment assets is reported on the condensed consolidated balance sheets as total assets.
15. Related Parties
On March 9, 2022, Enrico Drago, then Chief Executive Officer of the PlayDigital business and immediate family member of Marco Drago, a member of the Brightstar Lottery Board of Directors (the “Board”) up until May 14, 2024, was granted a
22
Table of Contents
synthetic equity award pursuant to the PlayDigital Equity Award Program designed to align the incentives of certain employees of the Company’s PlayDigital business with the growth in the valuation of such business. The synthetic equity award was scheduled to vest in three, four, and five years after the grant date with tranche percentages of 35%, 25%, and 40% and could be settled in equity or cash.
On March 27, 2024, Enrico Drago’s synthetic equity award was modified to change the valuation methodology applicable to the award and to allow for the continued vesting of the award in consideration of his new role as a member of the Board following his resignation from the role of Chief Executive Officer of the PlayDigital business and the planned sale or other disposition of the PlayDigital business.
On June 25, 2025, Enrico Drago’s synthetic equity award was modified to accelerate the vesting upon the sale of IGT Gaming and change the valuation methodology to align the award with the other plan participant. At June 30, 2025, there is no estimated unrecognized compensation expense attributable to the synthetic equity award granted to Enrico Drago.
16. Subsequent Event
IGT Gaming Sale
On July 1, 2025, the Company completed the previously announced sale of IGT Gaming per the Transaction Agreements with Apollo Funds, as described in Note 3. - Discontinued Operations and Assets Held for Sale, herein. The Company estimates the fair value of the proceeds from the transaction to be approximately $4.1 billion to $4.2 billion (subject to certain post-closing adjustments and indemnities) and expects to recognize a gain on the transaction in non-operating income during the third quarter of 2025. As of the date of this report, the Company has not completed the gain on sale of discontinued operations calculation and therefore the estimates presented are subject to further refinement and may result in changes.
On July 1, 2025, the Company announced the planned use of the proceeds as follows:
•$2.0 billion used for previously disclosed contractual debt reductions.
•$1.1 billion to be returned to shareholders:
◦The Company's Board of Directors declared a special cash dividend to common stockholders in the amount of $3.00 per share. The record date of the distribution was July 14, 2025 and payable on July 29, 2025.
◦In addition, the Board authorized a $500 million, two-year share repurchase program. The new authorization replaces the Company's existing share repurchase program.
•$500 million to partially fund upcoming Italy Lotto license payments.
•$400 million to be used for general corporate purposes.
Debt Reductions
Concurrent with the sale, the Company exercised its right to redeem in whole the 4.125% Senior Secured U.S. Dollar Notes due April 2026 and the 3.500% Senior Secured Euro Notes due June 2026 which had outstanding balances of $750 million and $879 million as of June 30, 2025, respectively, and prepaid $351 million and $53 million of the Term Loan Facilities due January 2027 and Revolving Credit Facilities due July 2027, respectively.
Effective July 1, 2025, the Revolving Credit Facility A and B commitments reduced from $820 million and €1 billion to $650 million and €800 million, respectively. As of July 24, 2025, the Company has additional borrowing capacity from undrawn credit facilities of $1.6 billion.
Share Repurchase Program
On and effective as of July 1, 2025, the Parent’s Board of Directors authorized a new $500 million share repurchase program, which superseded and replaced prior authorizations. This new program authorizes the Parent to repurchase, from time to time during a period of two years from its approval, up to an aggregate of $500 million of the Parent’s outstanding ordinary shares through open market repurchases in compliance with Rule 10b-18 under the Securities Exchange Act of 1934 or through privately negotiated transactions at management’s discretion based on market and business conditions, applicable legal requirements and other factors.
23
Table of Contents
Italy Lotto License
On July 16, 2025, the Company was notified by the Agenzia delle Dogane e dei Monopoli that LottoItalia, a consortium comprised of Allwyn, Arianna 2001, and Novomatic Italia, and led by Brightstar Lottery, had been awarded the Italy Lotto License, effective as of December 1, 2025. The Italy Lotto License has a term of nine years from December 1, 2025. The first €500 million installment was paid on July 17, 2025.
24
Table of Contents
Item 2. Management's Discussion and Analysis of Financial Condition and Results of Operations
The following discussion and analysis of the Company's financial condition and results of operations should be read in conjunction with the condensed consolidated financial statements, including the notes thereto, included in this report, as well as “Item 5. Operating and Financial Review and Prospects” and “Item 18. Financial Statements” in the Company's 2024 Form 20-F.
The following discussion includes information for the three and six months ended June 30, 2025 and 2024. Amounts reported in millions are computed based on the amounts in thousands. Certain amounts in columns and rows within tables may not foot due to rounding. Percentages presented are calculated from the underlying unrounded amounts.
The following discussion includes certain forward-looking statements. Actual results may differ materially from those discussed in such forward-looking statements. Factors that could cause or contribute to such differences include, but are not limited to, those discussed below and elsewhere in this report, including on page 4 under the heading “Forward-Looking Statements”, and in “Item 3.D. Risk Factors” included in the Company's 2024 Form 20-F and the “Forward-Looking Statements” safe harbor under the Private Securities Litigation Reform Act of 1995 (the “Forward-Looking Statements Safe Harbor”). In July 2025, we changed our corporate name from International Game Technology PLC to Brightstar Lottery PLC (NYSE: BRSL) (“Brightstar”). We will not distinguish between our prior and current corporate name and will refer to our current corporate name throughout this filing. As used in this Item 2, the terms “we,” “our,” “us,” and the “Company” refer to Brightstar Lottery PLC together with its consolidated subsidiaries, and “Parent” refers to Brightstar Lottery PLC.
Business Overview
Brightstar Lottery is an innovative, forward-thinking global leader in lottery that builds on our renowned expertise in delivering secure technology and producing reliable, comprehensive solutions for our customers. As a premier pure play global lottery company, our best-in-class lottery operations, retail and digital solutions, and award-winning lottery games enable our customers to achieve their goals, fulfill player needs, and distribute meaningful benefits to communities. Brightstar has a well-established local presence and is a trusted partner to governments and regulators around the world, creating value by adhering to the highest standards of service, integrity, and responsibility.
The Company operates and provides an integrated portfolio of innovative lottery solutions, including lottery management services and instant lottery systems. The Company operates a worldwide land-based lottery and iLottery business, including sales, operations, product development, technology, and support, and is a leading iLottery platform provider globally. IGT Gaming, which is fully included in discontinued operations for all periods presented herein, provides innovative gaming technology products and services, including gaming systems, electronic gaming machines, iGaming, and sports betting. The Company is supported by central corporate support functions, including finance, people and transformation, legal, corporate communications, and strategy and corporate development.
On July 26, 2024, the Parent and Everi Holdings Inc. (“Everi”) entered into definitive agreements (the “Transaction Agreements”) under which IGT Gaming and Everi were simultaneously acquired by a holding company (the “Buyer”) owned by funds managed by affiliates of Apollo Global Management, Inc. (the “Apollo Funds”) in an all-cash transaction (the “Transaction”). Refer to Note 16 - Subsequent Events herein for additional information.
The financial results of IGT Gaming have been reflected as discontinued operations in our condensed consolidated statements of operations and the assets and liabilities of IGT Gaming have been reflected as held for sale in our condensed consolidated balance sheets, for all periods presented. Accordingly, we report our results of continuing operations (i.e. what was formerly the Global Lottery segment) as a pure-play lottery business, representing the services and products we have continued to provide upon closing of the Transaction on July 1, 2025. Unless otherwise noted, amounts and disclosures included herein relate to our continuing operations.
Key Factors Affecting Operations and Financial Condition
The Company’s worldwide operations can be affected by industrial, economic, and political factors on both a regional and global level. The tightening of monetary policy by central banks, increased deficit projections in the U.S., changes in inflation rates, and the ongoing conflicts between Russia and Ukraine and various Middle Eastern conflicts, and other macroeconomic factors have caused disruptions and uncertainty in the global economy, including rising interest rates, increased inflationary pressures, foreign exchange rate fluctuations, potential cybersecurity risks, and exacerbated supply chain challenges. However, these events did not have a material impact on our supply chain or our results of operations during the six months ended June 30, 2025. The extent to which our business, or the business of our suppliers or manufacturers, will be impacted in the future is unknown. We will continue to monitor the effects of these events, as well as the evolving trade disputes involving the U.S. and other countries, which could raise the prices of certain consumer goods, on our business and our results of operations.
25
Table of Contents
Critical Accounting Estimates
The Company’s condensed consolidated financial statements are prepared in conformity with GAAP which require the use of estimates, judgments, and assumptions that affect the carrying amount of assets and liabilities and the amounts of income and expenses recognized. The estimates and underlying assumptions are based on information available at the date that the financial statements are prepared, on historical experience, judgments, and assumptions considered to be reasonable and realistic. There have been no material changes to the critical accounting estimates previously disclosed in the Company’s 2024 Form 20-F.
The areas that require greater subjectivity of management in making estimates and judgments and where a change in such underlying assumptions could have a significant impact on the Company’s condensed consolidated financial statements are fully described in “Item 1. Notes to the Condensed Consolidated Financial Statements (Unaudited)—Note 2. Summary of Significant Accounting Policies” included herein.
Results of Operations
Comparison of 2025 and 2024
Revenues and Key Performance Indicators
| For the three months ended June 30, | For the six months ended June 30, | |||||||||||||||||||||||||||||||||||||||||||||||||
| 2025 | 2024 | Change | 2025 | 2024 | Change | |||||||||||||||||||||||||||||||||||||||||||||
| ($ in millions) | $ | $ | $ | % | $ | $ | $ | % | ||||||||||||||||||||||||||||||||||||||||||
Operating and facilities management contracts, net | 576 | 573 | 4 | +1 | 1,121 | 1,178 | (57) | -5 | ||||||||||||||||||||||||||||||||||||||||||
| Systems, software, and other | 12 | 13 | (2) | -11 | 25 | 27 | (2) | -9 | ||||||||||||||||||||||||||||||||||||||||||
| Service revenue | 588 | 586 | 2 | — | 1,146 | 1,205 | (60) | -5 | ||||||||||||||||||||||||||||||||||||||||||
| Product sales | 42 | 27 | 16 | +59 | 68 | 69 | (1) | -1 | ||||||||||||||||||||||||||||||||||||||||||
| Total revenue | 631 | 613 | 18 | +3 | 1,214 | 1,274 | (60) | -5 | ||||||||||||||||||||||||||||||||||||||||||
Total revenue for the three months ended June 30, 2025 increased $18 million primarily driven by an increase in revenue from product sales, and an increase in revenue from operating and facilities management contracts as a result of higher instant ticket and draw-game same-store sales growth in Italy, supported by favorable foreign currency impacts. These increases were partially offset by decreased lottery management agreement (“LMA”) incentive revenues and lower revenue from U.S. multi-state jackpot (“U.S. MSJP”) games (Mega Millions® and Powerball®) compared to elevated activity in the prior corresponding period.
Total revenue for the six months ended June 30, 2025 decreased $60 million primarily driven by a decrease in revenue from operating and facilities management contracts as a result of decreased LMA incentive revenues and higher U.S. MSJP activity in the prior period, as discussed in further detail below.
26
Table of Contents
| For the three months ended June 30, | For the six months ended June 30, | |||||||||||||||||||||||||
| (% on a constant-currency basis) | 2025 | 2024 | 2025 | 2024 | ||||||||||||||||||||||
| Global same-store sales growth | ||||||||||||||||||||||||||
| Instant ticket & draw games | +2.6 | % | -0.2 | % | +1.2 | % | -0.2 | % | ||||||||||||||||||
U.S. MSJP | -34.5 | % | +22.5 | % | -41.2 | % | +7.9 | % | ||||||||||||||||||
| Total | +0.3 | % | +0.9 | % | -1.8 | % | +0.3 | % | ||||||||||||||||||
U.S. same-store sales growth | ||||||||||||||||||||||||||
| Instant ticket & draw games | +0.6 | % | -1.9 | % | -0.3 | % | -2.2 | % | ||||||||||||||||||
U.S. MSJP | -34.5 | % | +22.5 | % | -41.2 | % | +7.9 | % | ||||||||||||||||||
| Total | -2.7 | % | — | % | -4.8 | % | -1.2 | % | ||||||||||||||||||
Rest of world same-store sales growth | ||||||||||||||||||||||||||
Instant ticket & draw games | +8.4 | % | +3.0 | % | +6.8 | % | +2.8 | % | ||||||||||||||||||
| Italy same-store sales growth | ||||||||||||||||||||||||||
| Instant ticket & draw games | +3.7 | % | +2.3 | % | +1.4 | % | +3.4 | % | ||||||||||||||||||
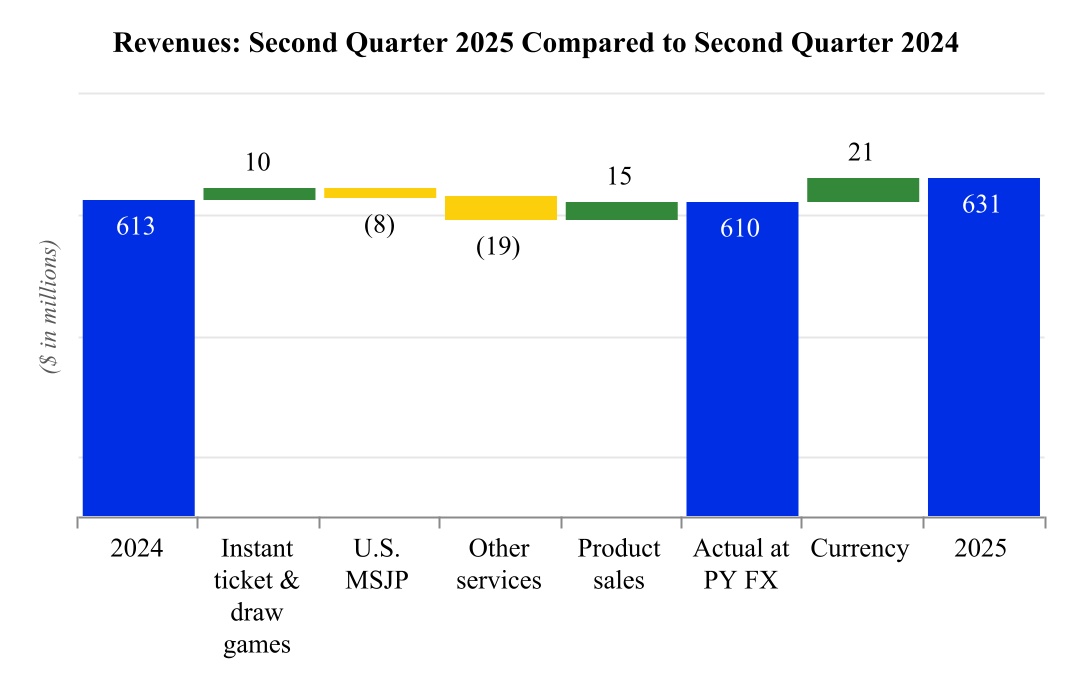
Service revenue during the quarter increased, primarily due to instant and draw game revenues, excluding MSJP, increasing $10 million, $29 million including the impact of foreign currency, due to a 3.7% increase in same-store sales in Italy and a 8.4% increase in same-store sales in Rest of world. These increases were offset by a $19 million reduction in LMA incentive revenue, a component of Other Services, and a 34.5% drop in same-store sales for U.S. MSJP as the size of jackpots were lower in the quarter compared to the same period last year.
Product sales, including the impact of foreign currency, increased $16 million, or 59%, from the same quarter last year mainly due to a $7 million increase in instant ticket printing operations driven by existing customers and $8 million in sales to customers in the U.S. primarily for terminal deliveries.
27
Table of Contents
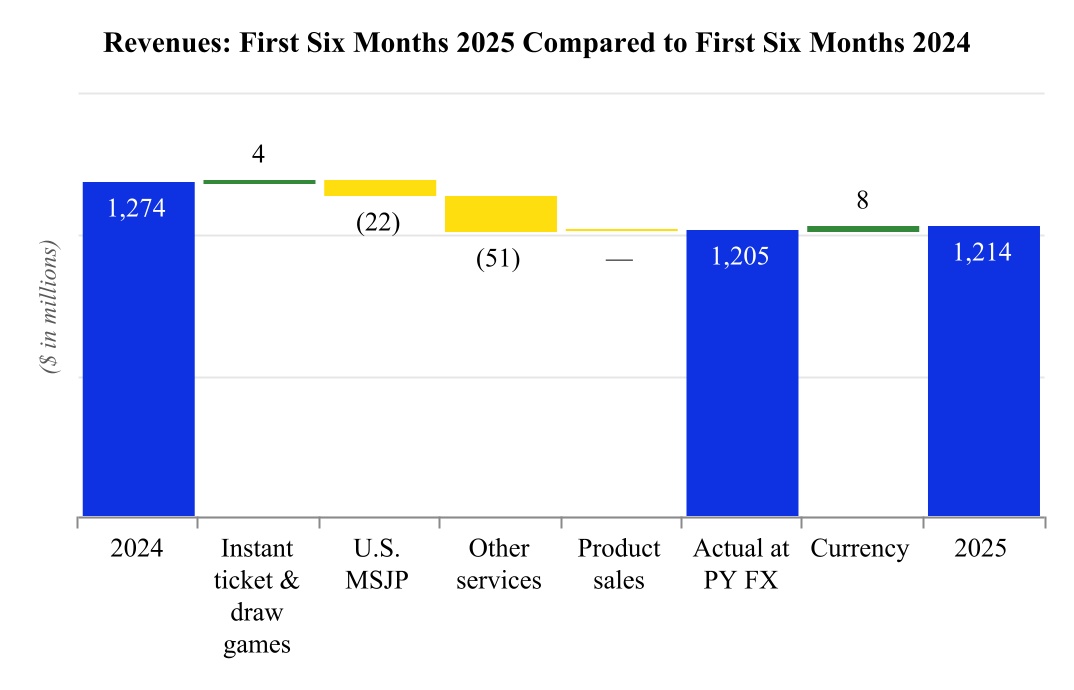
Service revenue for the six months ended June 30, 2025 declined, primarily due to a $52 million reduction in LMA incentive revenue, a component of Other Services, and a 41.2% drop in same-store sales for U.S. MSJP games as the size of jackpots were lower in the six months ended June 30, 2025 compared to the same period last year. Partially offsetting the decrease, instant and draw game revenues supported by favorable foreign currency impacts, excluding U.S. MSJP, increased due to 1.4% of same-store sales growth in Italy and a 6.8% of same-store sales growth in the Rest of world.
The recognition of the LMA incentive shortfall in the first quarter was triggered by the lack of significant U.S. MSJP activity during the first nine months of the LMA’s fiscal year, and in-line with expectations, the remainder of the incentive shortfall was recognized in the second quarter as no significant U.S. MSJP activity occurred in the three months ended June 30, 2025.
Product sales, including the impact of foreign currency, for the six months ended June 30, 2025 decreased $1 million, or 1.2%, from the same quarter last year mainly due to the non-recurrence of $13 million in sales to a Canadian customer for terminal and software deliveries, and $9 million in sales to customers in Europe and Asia primarily for central systems software upgrades. These decreases were partially offset by a $10 million increase in instant ticket printing operations, driven by existing customers and $8 million in sales to customers in the U.S. primarily for terminal deliveries.
Cost of Revenue
| For the three months ended June 30, | For the six months ended June 30, | |||||||||||||||||||||||||||||||||||||||||||||||||
| 2025 | 2024 | Change | 2025 | 2024 | Change | |||||||||||||||||||||||||||||||||||||||||||||
| ($ in millions) | $ | $ | $ | % | $ | $ | $ | % | ||||||||||||||||||||||||||||||||||||||||||
| Cost of services | 321 | 304 | 17 | +6 | 626 | 608 | 18 | +3 | ||||||||||||||||||||||||||||||||||||||||||
| Cost of product sales | 35 | 22 | 13 | +61 | 57 | 48 | 10 | +20 | ||||||||||||||||||||||||||||||||||||||||||
Cost of services for the three months ended June 30, 2025 increased by $17 million compared to the same period last year, primarily due to a $4 million increase in point-of-sale consumables used in providing instant ticket and draw games, a $6 million increase in the aggregate for postage & freight and marketing, and a $3 million increase in depreciation and amortization from higher cost capitalization related to contract renewals, while other expenses remained stable. Cost of product sales increased by $13 million as compared to the same period last year in-line with the increase in product sales, with a 100 basis point rise in the cost of product sales as a percentage of product sales.
Cost of services for the six months ended June 30, 2025 increased by $18 million compared to the same period last year, driven by a 420 basis point rise in the cost of services as a percentage of service revenue, primarily due to an $8 million increase in depreciation and amortization from higher cost capitalization related to contract renewals, as well as various increases in postage & freight costs, payroll & benefits principally from higher benefit costs, and licensing and royalties costs as compared
28
Table of Contents
to the prior corresponding period. Cost of product sales increased by $10 million as compared to the same period last year, and the cost of product sales as a percentage of product sales increased, largely due to changes in the product mix.
Gross Margins
| For the three months ended June 30, | Change | For the six months ended June 30, | Change | |||||||||||||||||||||||||||||||||||||||||||||||
| $ / Basis Points (“bps”) | % | $ / Basis Points (“bps”) | % | |||||||||||||||||||||||||||||||||||||||||||||||
| ($ in millions) | 2025 | 2024 | 2025 | 2024 | ||||||||||||||||||||||||||||||||||||||||||||||
| Gross margin | ||||||||||||||||||||||||||||||||||||||||||||||||||
| Service | 267 | 282 | (15) | -5 | 520 | 598 | (78) | -13 | ||||||||||||||||||||||||||||||||||||||||||
| % of service revenue | 45 | % | 48 | % | (280) | bps | 45 | % | 50 | % | (420) | bps | ||||||||||||||||||||||||||||||||||||||
| Product | 7 | 5 | 2 | +51 | 11 | 21 | (10) | -49 | ||||||||||||||||||||||||||||||||||||||||||
| % of product sales | 17 | % | 18 | % | (100) | bps | 16 | % | 31 | % | (1480) | bps | ||||||||||||||||||||||||||||||||||||||
Service gross margin as a percentage of service revenue for the three months ended June 30, 2025 decreased to 45% from 48% in the prior corresponding period, primarily attributable to the reduction in LMA incentive revenues, which affect the revenue without a corresponding decrease in costs. Service gross margin as a percentage of service revenue for the six months ended June 30, 2025 decreased to 45% from 50% in the prior corresponding period. This decrease is mainly attributable to a reduction in service revenue, as discussed above, notably from LMA incentive revenues, which affect the revenue without a corresponding decrease in costs.
Gross margin on product sales for the three months ended June 30, 2025 increased compared to the same period last year. This increase is primarily due to an increase in product sales, as discussed above, with gross margin as a percentage of product sales remaining relatively stable. Gross margin on product sales for the six months ended June 30, 2025 decreased compared to the same period last year. This decline is primarily due to reduced product sales, as discussed above, and a less favorable product mix. Specifically, there was a decrease in higher-margin systems and software sales and an increase in lower-margin ticket printing sales.
Operating expenses
| For the three months ended June 30, | For the six months ended June 30, | |||||||||||||||||||||||||||||||||||||||||||||||||
| 2025 | 2024 | Change | 2025 | 2024 | Change | |||||||||||||||||||||||||||||||||||||||||||||
| ($ in millions) | $ | $ | $ | % | $ | $ | $ | % | ||||||||||||||||||||||||||||||||||||||||||
| Selling, general and administrative | 100 | 96 | 4 | +4 | 204 | 198 | 6 | +3 | ||||||||||||||||||||||||||||||||||||||||||
Selling, general and administrative expenses increased in both periods, primarily due to an increase in outside service costs for legal consultants used as compared to the prior corresponding periods. | ||||||||||||||||||||||||||||||||||||||||||||||||||
| For the three months ended June 30, | For the six months ended June 30, | |||||||||||||||||||||||||||||||||||||||||||||||||
| 2025 | 2024 | Change | 2025 | 2024 | Change | |||||||||||||||||||||||||||||||||||||||||||||
| ($ in millions) | $ | $ | $ | % | $ | $ | $ | % | ||||||||||||||||||||||||||||||||||||||||||
| Research and development | 12 | 11 | 1 | +9 | 23 | 22 | 1 | +5 | ||||||||||||||||||||||||||||||||||||||||||
Research and development expenses remained stable for both periods compared to the prior corresponding periods, respectively. | ||||||||||||||||||||||||||||||||||||||||||||||||||
| For the three months ended June 30, | For the six months ended June 30, | |||||||||||||||||||||||||||||||||||||||||||||||||
| 2025 | 2024 | Change | 2025 | 2024 | Change | |||||||||||||||||||||||||||||||||||||||||||||
| ($ in millions) | $ | $ | $ | % | $ | $ | $ | % | ||||||||||||||||||||||||||||||||||||||||||
| Restructuring | 21 | — | 21 | > +200 | 21 | — | 21 | > +200 | ||||||||||||||||||||||||||||||||||||||||||
Higher restructuring costs for both periods related to management initiating Phase 2 of the OPtiMa 3.0 restructuring plan, to realign and optimize our general and administrative activities following the sale of IGT Gaming. The costs are primarily comprised of severance and related employee costs, and actions under Phase 2 of the plan are expected to be completed within a 12 month period from inception. | ||||||||||||||||||||||||||||||||||||||||||||||||||
29
Table of Contents
| For the three months ended June 30, | For the six months ended June 30, | |||||||||||||||||||||||||||||||||||||||||||||||||
| 2025 | 2024 | Change | 2025 | 2024 | Change | |||||||||||||||||||||||||||||||||||||||||||||
| ($ in millions) | $ | $ | $ | % | $ | $ | $ | % | ||||||||||||||||||||||||||||||||||||||||||
| Other operating expense, net | 3 | 1 | 2 | +138 | 5 | 1 | 4 | > +200 | ||||||||||||||||||||||||||||||||||||||||||
Other operating expense, net increased for both periods primarily due to professional advisory fees and other costs related to rebranding of the Lottery business as part of the separation activities. | ||||||||||||||||||||||||||||||||||||||||||||||||||
Operating Margins
| For the three months ended June 30, | Change | For the six months ended June 30, | Change | |||||||||||||||||||||||||||||||||||||||||||||||
| $ / Basis Points (“bps”) | % | $ / Basis Points (“bps”) | % | |||||||||||||||||||||||||||||||||||||||||||||||
| ($ in millions) | 2025 | 2024 | 2025 | 2024 | ||||||||||||||||||||||||||||||||||||||||||||||
| Operating income | 139 | 179 | (40) | -22 | 277 | 397 | (121) | -31 | ||||||||||||||||||||||||||||||||||||||||||
| Operating margin | 22 | % | 29 | % | (700) | bps | 23 | % | 31 | % | (800) | bps | ||||||||||||||||||||||||||||||||||||||
Operating margin decreased for both periods, primarily due to the reduction in LMA incentives revenues with no associated costs reduction, and higher costs associated with Phase 2 of the OPtiMa 3.0 restructuring plan initiated in the quarter. The first six months was further impacted by the drop in product sales, as discussed above.
Non-operating expenses
| For the three months ended June 30, | For the six months ended June 30, | |||||||||||||||||||||||||||||||||||||||||||||||||
| 2025 | 2024 | Change | 2025 | 2024 | Change | |||||||||||||||||||||||||||||||||||||||||||||
| ($ in millions) | $ | $ | $ | % | $ | $ | $ | % | ||||||||||||||||||||||||||||||||||||||||||
| Interest expense, net | 49 | 53 | (4) | -8 | 94 | 106 | (12) | -11 | ||||||||||||||||||||||||||||||||||||||||||
Net interest expense decreased in both periods, primarily due to lower borrowings on the Revolving Credit Facilities and a lower average balance in the Term Loan Facilities following payment of a January installment on the 2027 Facility, partially offset by the new senior facilities agreement entered into in the first quarter and fully utilized in the second quarter as described in “Item 1. Notes to the Condensed Consolidated Financial Statements (Unaudited)—Note 9. Debt”. | ||||||||||||||||||||||||||||||||||||||||||||||||||
| Foreign exchange loss (gain), net | 99 | (4) | 103 | > +200 | 131 | (16) | 147 | > +200 | ||||||||||||||||||||||||||||||||||||||||||
Foreign exchange loss (gain), net principally relates to fluctuations in the Euro to U.S. dollar exchange rate on internal and external debt, as well as foreign currency losses. | ||||||||||||||||||||||||||||||||||||||||||||||||||
| Other non-operating expense, net | 2 | 3 | (1) | -44 | 5 | 7 | (2) | -23 | ||||||||||||||||||||||||||||||||||||||||||
Other non-operating expense, net relates primarily to the Company’s interest in a lottery consortium in Brazil and certain costs of our factoring agreements. | ||||||||||||||||||||||||||||||||||||||||||||||||||
| Provision for income taxes | 50 | 43 | 7 | +16 | 97 | 100 | (3) | -3 | ||||||||||||||||||||||||||||||||||||||||||
The increase in provision for income taxes in the quarter was attributable to higher valuation allowances offset by lower pre-tax income. The increase in the effective tax rate was primarily related to a $132 million increase in non-deductible foreign exchange losses in the Parent. The decrease in the first six months was primarily due to lower pre-tax income. The increase in the effective tax rate was primarily related to a $190 million increase in non-deductible foreign exchanges losses in the Parent. | ||||||||||||||||||||||||||||||||||||||||||||||||||
30
Table of Contents
Income from discontinued operations
| For the three months ended June 30, | For the six months ended June 30, | |||||||||||||||||||||||||||||||||||||||||||||||||
| 2025 | 2024 | Change | 2025 | 2024 | Change | |||||||||||||||||||||||||||||||||||||||||||||
| ($ in millions) | $ | $ | $ | % | $ | $ | $ | % | ||||||||||||||||||||||||||||||||||||||||||
| Income from discontinued operations, net of tax | 40 | — | 39 | > +200 | 92 | 13 | 79 | > +200 | ||||||||||||||||||||||||||||||||||||||||||
Discontinued operations reflects the income from the discontinued operations of IGT Gaming. IGT Gaming revenues during the three and six months ended June 30, 2025 decreased primarily due to a decline in product sales, with reductions in revenues from lower gaming terminal sales and systems sales. IGT Gaming operating expenses in the quarter were also negatively impacted by the write-off of uncollectible customer financing receivables and a litigation settlement incurred in the quarter. The increase in income from discontinued operations, net of tax is primarily due to lower depreciation and amortization while held for sale, more than offsetting the decreased revenues and increased costs in the three and six month periods ended. See “Item 1. Notes to the Condensed Consolidated Financial Statements (Unaudited)—Note 3. Discontinued Operations and Assets Held for Sale” elsewhere in this Form 6-K for additional detail.
Liquidity and Capital Resources
Overview
The Company’s business is capital intensive and requires liquidity to meet its obligations and fund growth. Historically, the Company’s primary sources of liquidity have been cash flows from operations and, to a lesser extent, cash proceeds from financing activities, including amounts available under the Revolving Credit Facilities. In addition to general working capital and operational needs, the Company’s liquidity requirements arise primarily from its need to meet debt service obligations and to fund capital expenditures and upfront license fee payments. The Company also requires liquidity to fund acquisitions and associated costs. The Company’s cash flows generated from operating activities together with cash flows generated from financing activities have historically been sufficient to meet the Company's liquidity needs.
The Company believes its ability to generate cash from operations to reinvest in its business is one of its fundamental financial strengths. Combined with funds currently available and committed borrowing capacity, the Company expects to have sufficient liquidity to meet its financial obligations in the ordinary course of business for the 12 months following the date of issuance of this report and for the longer-term period thereafter.
The cash management activities, funding of operations, and investment of excess liquidity are centrally coordinated by a dedicated treasury team with the objective of ensuring effective and efficient management of funds.
At June 30, 2025 and December 31, 2024, the Company's total available liquidity was as follows, respectively:
| ($ in millions) | June 30, 2025 | December 31, 2024 | ||||||||||||
| Revolving Credit Facilities | 1,582 | 1,364 | ||||||||||||
| Cash and cash equivalents | 1,309 | 584 | ||||||||||||
| Total Liquidity | 2,891 | 1,948 | ||||||||||||
The Revolving Credit Facilities are subject to customary covenants (including maintaining a minimum ratio of EBITDA to total net interest costs and a maximum ratio of total net debt to EBITDA) and events of default, none of which are expected to impact the Company’s liquidity or capital resources. At June 30, 2025, the borrowers were in compliance with such covenants.
Refer to “Item 1. Notes to the Condensed Consolidated Financial Statements (Unaudited)—Note 9. Debt and Note 16. Subsequent Event” included herein for information regarding the Company’s debt obligations, including the maturity profile of borrowings and committed borrowing facilities.
At June 30, 2025 and December 31, 2024, approximately 35% and 25% of the Company’s debt portfolio was exposed to interest rate fluctuations, respectively. The Company’s exposure to floating rates of interest primarily relates to the Revolving Credit Facilities and Euro Term Loan Facilities due January 2027 and September 2030.
31
Table of Contents
The following table summarizes the Company’s U.S. Dollar equivalent cash and cash equivalent balances by currency:
| June 30, 2025 | December 31, 2024 | |||||||||||||||||||||||||
| ($ in millions) | $ | % | $ | % | ||||||||||||||||||||||
| Euros | 1,132 | 86 | 296 | 51 | ||||||||||||||||||||||
| U.S. dollars | 80 | 6 | 182 | 31 | ||||||||||||||||||||||
| Other currencies | 97 | 7 | 105 | 18 | ||||||||||||||||||||||
| Total Cash and cash equivalents | 1,309 | 100 | 584 | 100 | ||||||||||||||||||||||
The Company maintains its cash deposits in a diversified portfolio of global banks, the majority of which are considered Global Systemically Important Banks. The Company holds an immaterial amount of cash in countries where there may be legal or economic restrictions on the ability of subsidiaries to transfer funds in the form of cash dividends, loans, or advances. Furthermore, certain regulatory restrictions due to the shortage of foreign exchange reserves are present in Trinidad and Tobago where approximately $25 million of our foreign cash resides. These restrictions do not have an impact on the ability of the Company to meets its cash obligations.
32
Table of Contents
Cash Flow Summary
The following tables summarize the condensed consolidated statements of cash flows for the six months ended June 30, 2025 and 2024. A complete condensed consolidated statements of cash flows is provided in the condensed consolidated financial statements included herein.

Net cash provided by operating activities from continuing operations was $433 million in the first six months of 2025, compared with net cash provided of $315 million for the same period in 2024. The increase was primarily driven by $86 million of favorability related to the timing of income tax and interest payments and a $59 million increase in cash collections.
Net cash used for investing activities in the first six months of 2025 was $175 million, compared with net cash used of $76 million in the first six months of 2024, principally due to a $100 million increase in capital expenditures, primarily for systems, equipment and other assets related to contracts in California, Colorado, and Kentucky.
Net cash provided by financing activities during the first six months of 2025 was $581 million, compared with net cash used of $413 million in the same period of 2024. The change was primarily due to a $851 million net increase as proceeds from debt exceeded payments in the first six months of 2025 compared to the same period in 2024 as a result of the 2030 Facilities Agreement referenced in Item 1. Notes to the Condensed Consolidated Financial Statements (Unaudited)—Note 9. Debt and a $175 million increase in capital contributions from non-controlling interests.
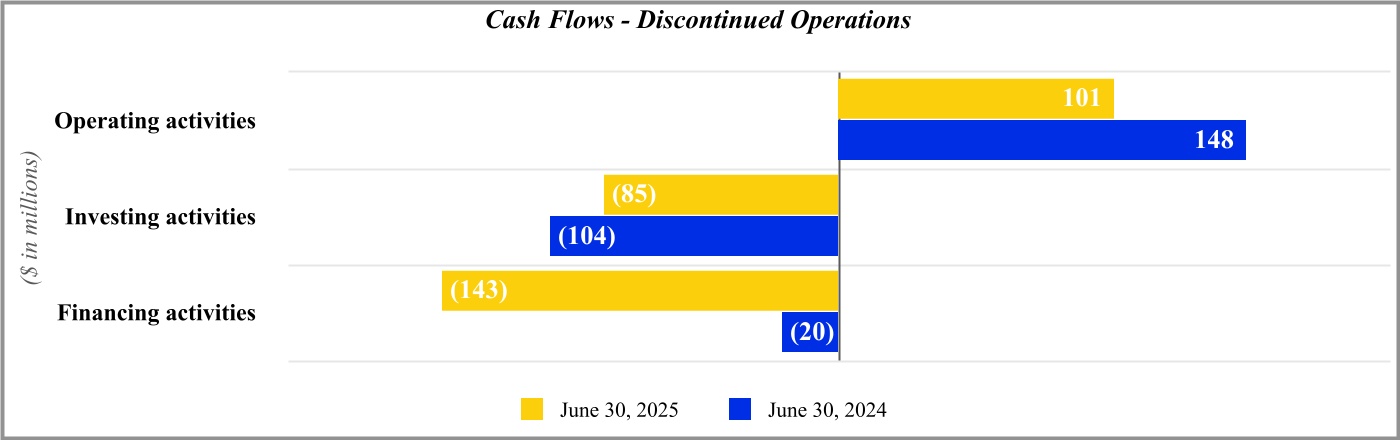
Net cash provided by operating activities from discontinued operations was $101 million in the first six months of 2025, compared with net cash provided of $148 million for the same period in 2024. The decrease is primarily attributable to the timing of payments within tax, interest, and trade and other payables. Net cash used for investing activities was $85 million in the first six months of 2025, compared with $104 million for the same period in 2024. The change was primarily due to a $17 million decrease in capital expenditures. Net cash used in financing activities was $143 million in the first six months of 2025, compared with $20 million for the same period in 2024. Net cash used for financing activities primarily related to a $123 million payment on the Sony deferred license obligation.
33
Table of Contents
Dividends
Our Board of Directors authorized the following cash dividends:
| For the three months ended June 30, | For the six months ended June 30, | |||||||||||||||||||||||||
| ($ in millions, except per share amounts) | 2025 | 2024 | 2025 | 2024 | ||||||||||||||||||||||
Dividends paid/declared per share of common stock | $ | 0.20 | $ | 0.20 | $ | 0.40 | $ | 0.40 | ||||||||||||||||||
Total dividends paid/declared | 41 | 40 | 81 | 80 | ||||||||||||||||||||||
On July 1, 2025, the Board declared a special cash dividend equal to $3.00 per share. The special dividend, of approximately $609 million in the aggregate, is payable on July 29, 2025, to shareholders of record on July 14, 2025.
On July 24, 2025, the Board declared a quarterly cash dividend of $0.20 per share. The dividend, of approximately $41 million, is payable on August 26, 2025, to shareholders of record on August 12, 2025.
Historical payment of dividends is not an indication that dividends will be paid on any future date. The Company has not implemented a formal policy on dividend distributions, and any future dividend payment is subject to Board approval.
U.S. federal income tax considerations for U.S. shareholders of ordinary shares
The following discussion is not intended to serve as a complete summary of the U.S. federal income tax considerations relevant to the Company’s distributions or the ownership of the Company’s ordinary shares. For additional information, please refer to the Company’s Form 20-F for the fiscal year ended December 31, 2024 (“Taxation—Material U.S. Federal Income Tax Considerations”), the terms of which are incorporated herein by reference.
We generally expect that our quarterly dividends will be subject to customary dividend tax treatment in the U.S., but if our total dividends paid during any given year exceed the Parent’s current and accumulated earnings and profits (“E&P”) as of the end of such year (determined under U.S. tax principles), a portion of our dividends paid in that year will be treated: (i) first, as a nontaxable return of capital, to the extent of a shareholder’s tax basis in ordinary shares (on a dollar-for-dollar basis), and (ii) subsequently, as capital gain.
Based on our current expectations, we expect that for U.S. shareholders the special dividend, the Q1 dividend paid on June 12, and any future dividends paid in the current fiscal year will be treated for U.S. income tax purposes as a nontaxable return on capital to the extent of a shareholder’s basis in its shares. To assist investors with U.S. tax reporting requirements, on July 27, 2025 and July 29, 2025, the Company posted IRS form 8937 “Report of Organizational Actions Affecting Basis of Securities” in the Investor Relations section of the Company’s website (ir.brightstarlottery.com). These forms provide an explanation of the tax consequences to U.S. shareholders regarding the Company’s treatment of the cash distributions of $0.20 per ordinary share paid by the Company on June 12, 2025 and the cash distribution of $3.00 per ordinary share paid by the Company on July 29, 2025. Under applicable U.S. tax law, these distributions are expected to be treated as a nontaxable return of capital, which are treated for U.S. income tax purposes as a return on capital to the extent of a shareholder’s basis in its ordinary shares, and thereafter as capital gain. The form 8937s will be updated as necessary following the determination of Brightstar’s financial results for fiscal year 2025 and a review of certain other factors.
Because the calculation of E&P is a full-year determination which depends upon facts that are not known as of the date hereof, no assurances can be provided that the Parent’s actual current and accumulated E&P will not be materially different than the Company’s preliminary estimate and that U.S. shareholders will not be required to treat a portion of the special dividend and other dividends received as dividends for U.S. federal income tax purposes. If the Company subsequently determines that it has current or accumulated E&P, then U.S. shareholders may experience U.S. federal income tax consequences that are materially different than the consequences described above. All U.S. shareholders are urged to consult with a tax advisor to determine the tax consequences of the special dividend and other dividends received, including any state, local or foreign tax considerations based on the shareholder’s individual facts and circumstances.
Item 3. Quantitative and Qualitative Disclosures About Market Risk
There have been no material changes to the disclosure under “Part I, Item 11. Quantitative and Qualitative Disclosures About Market Risk” included in our 2024 Form 20-F.
34
Table of Contents
Item 4. Controls and Procedures
There have been no changes in internal control over financial reporting during the six months ended June 30, 2025 that have materially affected, or are reasonably likely to materially affect, the Company’s internal control over financial reporting.
PART II. OTHER INFORMATION
Item 1. Legal Proceedings
From time to time, the Parent and/or one or more of its subsidiaries are party to legal, regulatory, or administrative proceedings regarding, among other matters, claims by and against us, and injunctions by third parties arising out of the ordinary course of business or its other business activities. Licenses are also subject to legal challenges by competitors seeking to annul awards made to the Company. The Parent and/or one or more of its subsidiaries are also, from time to time, subjects of, or parties to, ethics and compliance inquiries and investigations related to the Company’s ongoing operations.
There have been no material developments to the litigation disclosed in our Annual Report on Form 20-F filed with the SEC on February 25, 2025. Legal proceedings that were previously disclosed may no longer be reported because, as a result of the rulings in the case, settlements, changes in our business, or other developments, in our judgment, they are no longer material to the Company’s business, financial position, or results of operations.
Item 1A. Risk Factors
There have been no material changes to the disclosure under “Part I, Item 3.D. Risk Factors” included in our 2024 Form 20-F.
Item 2. Unregistered Sales of Equity Securities and Use of Proceeds
Issuer Purchases of Equity Securities
No repurchases of common stock were made by or on behalf of the Parent during the second quarter ended June 30, 2025.
On July 1, 2025, the Parent’s Board of Directors authorized a new $500 million share repurchase program, replacing the prior program authorized on November 15, 2021, which had a remaining authorization of $145 million. This new program authorizes the Parent to repurchase, from time to time during a period of two years from its approval, up to $500 million of the Parent’s outstanding ordinary shares through open market repurchases in compliance with Rule 10b-18 under the Securities Exchange Act of 1934 and/or in privately negotiated transactions at management’s discretion based on market and business conditions, applicable legal requirements, and other factors. Shares repurchased are either canceled or held in treasury. As of the date of this filing, the Parent had the full $500 million of authorization remaining under the new program.
The Parent intends to enter into an accelerated share repurchase agreement with one or more dealers to repurchase up to $250 million of the Parent’s ordinary shares. The agreement is being entered into under the Parent’s existing $500 million share repurchase program.
35
SIGNATURE
Pursuant to the requirements of the Securities Exchange Act of 1934, the registrant has duly caused this report to be signed on its behalf by the undersigned, thereunto duly authorized.
BRIGHTSTAR LOTTERY PLC | |||||
| /s/ Massimiliano Chiara | |||||
| Name: Massimiliano Chiara | |||||
| Title: Chief Financial Officer | |||||
Dated: July 29, 2025
36